unit 1 methods, stats
1/60
Earn XP
Name | Mastery | Learn | Test | Matching | Spaced |
|---|
No study sessions yet.
61 Terms
hindsight bias
knew it all along, rooting for one result
applied research
practical and specific problems, what method is better
basic research
just to gain understanding, broad
longitudinal
over a long period of time, understand changes over time, but drop out over time, expensive
cross sectional
different ages in one point in time
explain population during that time
look at differences in age groups
look at many variables at once, cheap and fast
but not casual, response rate low due to low sample size
hypothesis
statement of relationship between two variables
dependent variable
results dependent on independent variable
independent variable
variable being manipulated
operational definition
explain how measure a variable
validity
accurate, when measures what researchers wanted to measure
reliable
consistent, can be replicated
sample
group of participants that represents larger population
population
anyone/anything that can be in a sample
random selection
every member has an EQUAL chance of being selected. help increases likelihood sample represents, generalize findings, best with computer random generate
stratified sampling
process to ensure sample represents population
meta analysis
process of looking at results of studies that measured the same variables
experimenter bias
unconscious to treat a group better to increase chance of confirming their hypothesis
sampling bias
samples that do not accurately represent the entire group
lab experiments
in lab, very controlled
field experiments
in the world, more realistic like social experiments
experiment
carefully controlled show CAUSAL relationship, cause and effect, control or manipulate variables to be more valid, but placebo and confounding variables
confounding variable
any difference between experimental and control that can affect dependent
random assignment
each person has equal chance of being placed in a group
participant relevant conducting
participant can't choose their own group
situation relevant conditioning
need to have same controlling enviro
double blind
researcher blind and participant blind (ex. researchers don’t know which is placebo and which one is real medication)
single blind
participants don’t know what group they are in
demand characteristics
cues to think participants are in certain group to respond in certain way
social desirability
give answers that look good to them, not true answer
participant bias
demand character, social desirability
control group
no independent variable
hawthorne effect
participant change behavior because being evaluated
placebo method
given medication to control but doesn’t have effect in it, just think they took drug
correlation
any variables correlation, how one can predict the other
make logical predictions, NO cause and effect
unknown variable can influence relationship
(ex. alcohol consumption and unemployment)
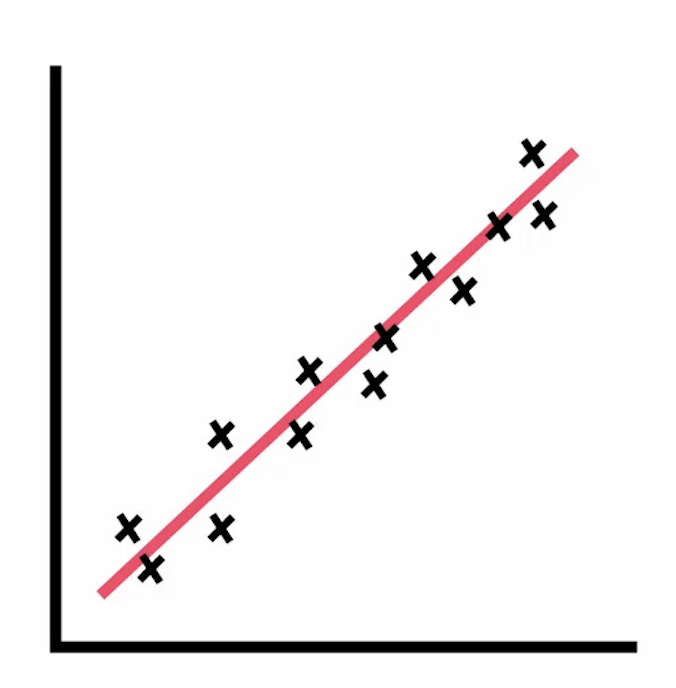
positive correlation
dots up and up
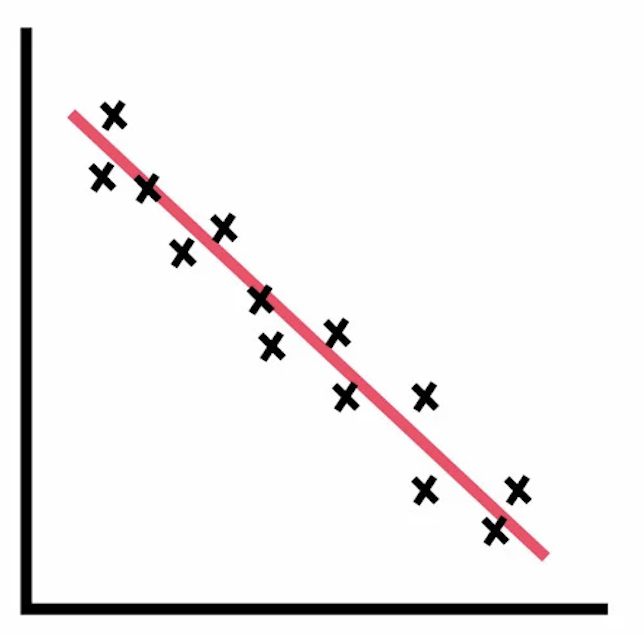
negative correlation
dots one down one up
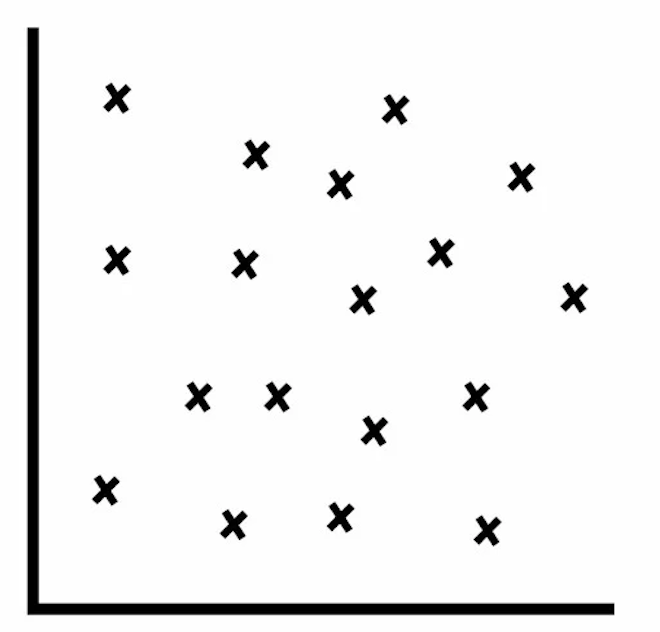
no correlation
dots scattered
survey method
if there is relationship ask questions, no independent or dependent variable
get data from people fast, cheaper
response rate can be low, self reported answers are inaccurate
naturalistic observation
just observe, no manipulation, realistic, no cause and effect, no mental processes
case study
one specific person or small group, detailed picture, cannot generalize to large population
correlation coefficient
-1 and 1 strong, 0 weak, show if correlation is strong or week
illusory correlation
perception of relationship when it doesn’t exist
descriptive stats
to describe a set of data
frequency distribution
a table or graph showing the distribution
central tendency
MMM mean median mode
mean
average, add all divide by # of scores
median
central, middle number, good for outliers
mode
most freq, can have more than 1
outliers
very extreme score, leads to skewed distribution
positive skewed distribution
TO THE LEFT, caused by low score
negative skewed distribution
TO THE RIGHT, caused by high score
measures of variability
diversity of distribution, range, variance, standard deviation
standard deviation
distance from the mean (root of variance)
z score
distance of a score from mean, neg and pos
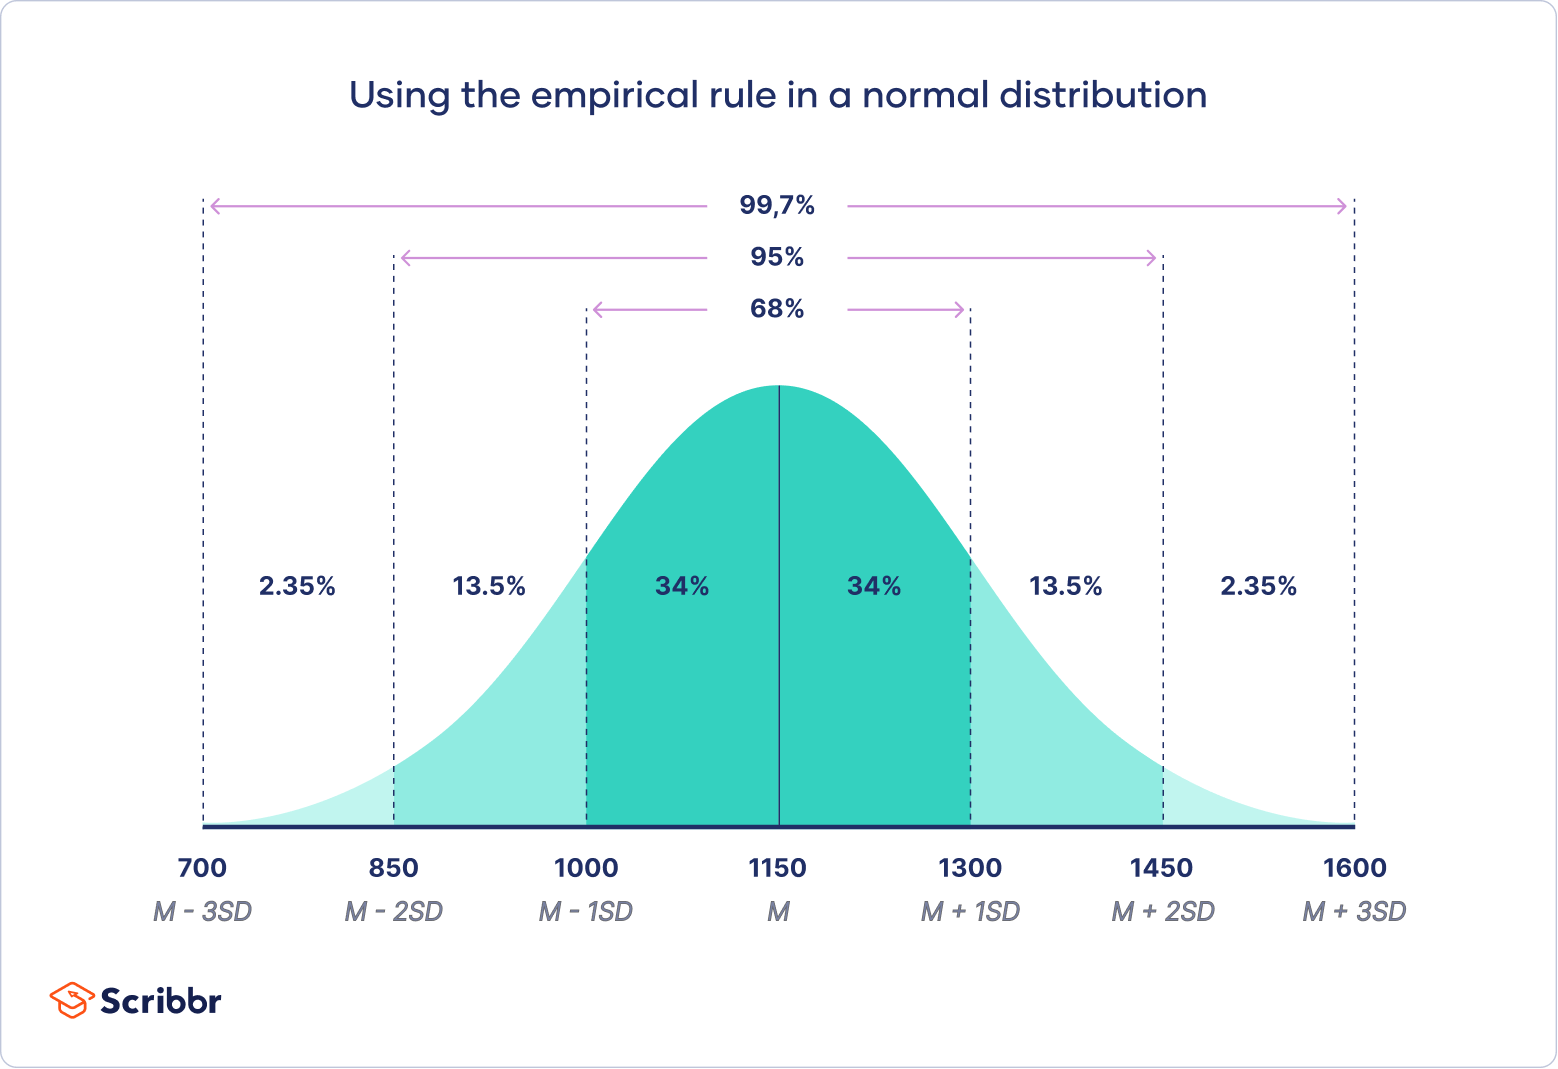
normal distribution curve
2 13 34 34 13 2
bimodal distribution
data distribution with two peaks
inferential stats
can be applied to larger population
sampling error
how much different sample is to population
sampling bias
sampling process that is not representative sample
p value
probability is due to chance, lower value the better (percentage decimal)
statistically significant
p value lower than 0.5 (or 5%)