Global Macro Investing - theory
1/269
There's no tags or description
Looks like no tags are added yet.
Name | Mastery | Learn | Test | Matching | Spaced | Call with Kai |
|---|
No analytics yet
Send a link to your students to track their progress
270 Terms
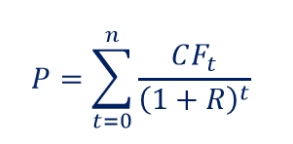
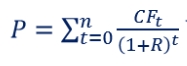
How do you determine the value of an asset?
determined by summing the present value of its expected future cash flows
determined by the discount model
the longer you wait, the higher the return on the asset
How do you determine the expected return of an asset?
using the fama-french 3/5 factor model
risk-free return (ie free lunch) + additional risk + size factor + value factor + profitability factor + investment factor
highlights the importance of diversification
only systematic risk will be rewarded

why is it difficult to consistently beat the market?
because it is efficient
how is asset pricing different from investment?
asset pricing theory explains returns using large datasets
ie it focuses on historical data
investment focuses on decision-making based on current conditions to determine the best action
eg after US invaded Venezuela, is it better to long or short oil?
asset pricing theory can’t help us as this event has never happened before
is the size factor always a good investment strategy to follow?
it can be a good investment strategy as you can short large firms and go long on small firms and earn a risk-free return
ie we are using the proceeds from one commodity to buy another
however, the SMB value factor fluctuates a lot overtime so it is not always a good investment decision
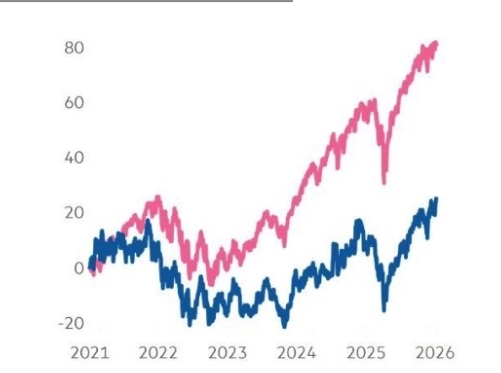
What can help to explain the large difference between S&P500 firms and Russell 2000 firms?
S&P 500 firms are mainly dominated by tech and AI firms which has seen a massive growth in recent years
Russell 2000 index is only up 24% over the past 5 years whereas S&P 500 has increased over 80%
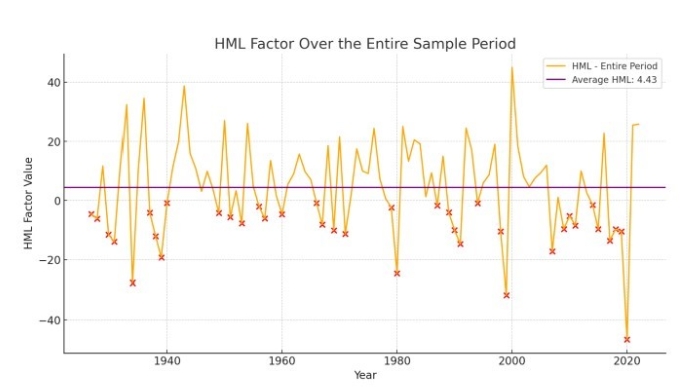
is the value factor a good investment strategy?
it can be viewed as a good strategy as it can provide an average annual return of 4.43%
however, Fama-French discovered that the factor is redundant once you include profitability and investment factors
small picture investing example (fund managers)
job is to beat a benchmark by trying to identify the shares (or bonds or other assets) that will outperform their peers
decision begins with the specifics
UK firm has expensive share prices, cost pressures, and profits are stagnating
Germany firm has cheap share price, managing costs well, and profits are growing
it would be in the fund manager’s interest to sell the share of the UK firm but buy the share of the Germany firm
big picture investing example (macro investors)
still in invest in shares, bonds, and other assets
instead of starting with company specific, they start with the bigger picture
identify large external forces that can drive the performance of companies, asset classes, and markets over time and distil these into a focused portfolio of investments
external forces include: economic developments, social change, and demographic shifts
invest in companies and other assets, across sectors and regions, that have the potential to benefit from these forces
try to profit from short exposure to companies/assets we expect to do badly as a result of these forces
no benchmark to constrain investors
aren’t reliant on rising markets to generate returns on investment
how is social change an external force for investing?
if we have an ageing population, how could this affect inflation?
furthermore, how does this impact dividends?
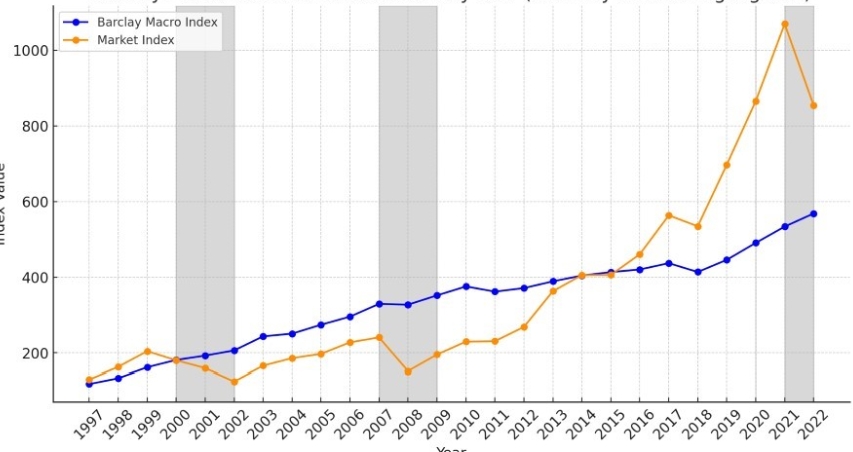
why do macro-style funds tend to yield slightly lower returns?
macro-style funds will buy AND sell whereas a typical macro investor will only buy
therefore, macro-style funds will have reduced risks
especially evident during market crashes when the macro strategy can both mitigate losses and profit from downward movements
how do large institutional investors possess significant information advantages over retail investors?
can afford large trading costs
eg a Bloomberg terminal (a financial software platform) costs $20,000+ per year
institutional investors exert substantial influence over manager compensation, encouraging ongoing communication
ie their reputation allows them to continue to succeed
they can act as market-moving information creators
eg if Blackrock is unhappy with a firm, they will be vocal about it and this will cause the share price of that firm to crash
lower financing and transaction costs provide a competitive edge
value investing/bottom-up strategies are particularly exposed to information asymmetry
Managers may have discrepancies in their approach to information disclosure, creating barriers for external investors. However, this is not a severe issue for macro investing, why?
free and fair access to most of the data
trading the entire economy, which diminishes the influence of individual participants, and even large institutions
communication is designed for the public, making it straightforward
presence of consensus topics leads to extensive coverage and liquidity
what financial assets are most commonly traded?
currencies
equities
fixed income
commodities
characteristics of currencies
the FX market is the most liquid financial market with a massive trading volume
has the highest trading volume
operates as a truly 24-hour market, due to time zone differences
major currencies have super tight bid-ask spreads
ie they have very low transaction costs
UK is most commonly traded within the FX market
trading the US dollar for the british pound
important to consider the currency regime when investing as different regimes have varying effects
characteristics of fixed income securities
for macro investing, sovereign/government bonds have a pivotal role
they represent the ‘risk-free’ rate as the government is very unlikely to default
this means the payoff is almost always realized
government bonds act as the primary tool for implementing monetary policy
they are also a major source of funding for governments to execute fiscal policies
how are fixed income assets distinct from other asset types?
their expected payoffs remain fixed when no default occurs
favourable for risk-averse investors
what is the crucial thing to know for fixed income securities?
when cash flows are known, the only uncertainty is the discount rate
predicting the discount is crucial
makes long-dated fixed income funds unfavourable as any changes in R are amplified
they are not intended to be kept until the end date due to the high duration risk
need to consider investment horizon
characteristics of equities
equity returns are not fixed, reflecting uncertainty in payoffs
makes them favourable for risk-loving individuals
equity returns are closely linked to earnings and the broader economy
index exposure is often obtained via derivatives, without individual stock analysis
individual stocks can still provide valuable information
in the long-run, equities will derive higher levels of return
why is it important to keep an eye on the Magnificent seven?
if one of these firms fails, it will cause the market to collapse as they hold a large percentage
characteristics of commodities
commodity producers naturally take long positions, benefitting from price increases
to reduce uncertainty, they often hedge by offsetting positions
commodities are among the most volatile asset classes but they lack the secular trends observed in equities
don’t experience a drift as the price fluctuations will be small
are derivatives high risk?
yes because they are traded on margin
examples of broad markets ETFs
SPY: tracks the S&P 500
QQQ: tracks the Nasdaq-100
examples of thematic/regional ETFs
ESGV: US ESG equities
PDJ: Chinese internet firms
IDA: Indian equities
examples of leveraged ETFs
SQQQ: - 3* daily return of the Nasdaq-100
TQQQ: +3*daily return of the Nasdaq-100
these are high risk
stages of a business cycle
expansion
peak
contraction
trough
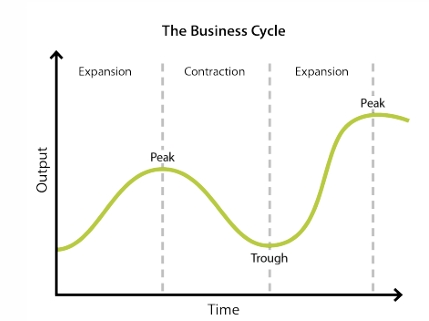
characteristics of economic expansion
decreasing unemployment
increasing wages
increased spending
characteristics of economic contraction
increasing unemployment
results in the supply of labour to be greater than the demand
decreasing wages
decreased spending
who identifies economic recessions and expansions? (in the US)
the NBER’s Business Cycle Dating Committee identifies the dates of peaks and troughs that frame economic recessions and expansions
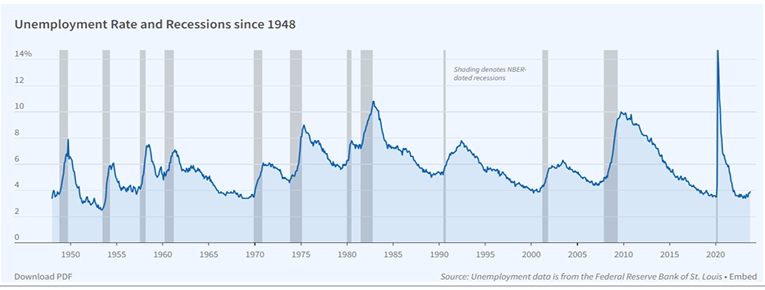
what is noticeable about unemployment in recessions?
unemployment increases quickly but goes down quite slowly
it doesn’t move in a symmetric way
what factors determine the natural output level?
labour force and human capital
determined by social structures rather than economy
capital stock and technology
natural resources
institutional and structural characteristics
education and training
economic policies
demographics and population health
if a country has an ageing population, this means there are not enough young people to pay for taxes to support the older generation
sociopolitical stability
overall, very long-run exogenous factors determine natural output level
why must we determine the natural output level?
if the economy is growing too quickly, this will result in very high levels of inflation
if we are growing too slowly, this will result in high levels of unemployment
although the NBER Business Cycle Dating Committee determine when recessions occur, what problem do we still have?
they can’t predict when a recession will happen (ie no ex-ante predictions are made)
although they determine the dates of cycles for us, their announcements are made ex-post
they are informing us of the research findings after we are already in that particular phase of the cycle
this is not very useful when making investment decisions
need to adopt a forward-looking perspective on the business cycle
why do we care about business cycles?
it affects the value of an asset
business cycles shape monetary and fiscal policy
policy actions affect the discount rate (R)
the discount rate includes the risk-free rate plus the discount premium
if the economy is ‘over-heating’ the interest rate will increase
if the economy is slow, the interest rate will decrease
business cycle also affects firm earnings, and hence cash flows

how does long historical data help us assess where we are in the cycle?
when output is below trend, it often signals economic stress or downturns
eg: 70s oil crisis and inflation, early 90s recession, 2008 global financial crisis and subsequent European debt crisis, the COVID-19 shock and post-Brexit uncertainties
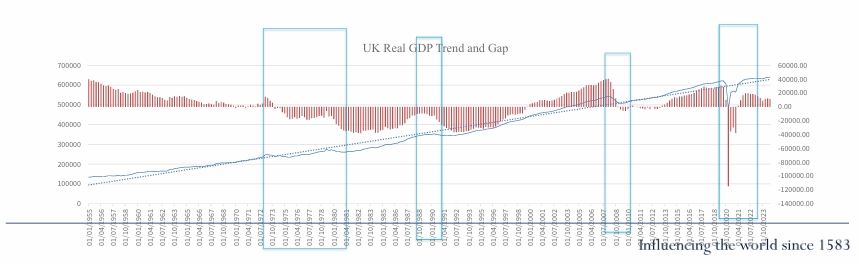
what is the UK natural output rate?
around 1% per year
lower than previous years due to Brexit and other political reasons
how do policy responses help the natural output level?
shocks can deviate output, creating an output gap
this may lead to higher unemployment or inflationary pressures
policy responses can act as counter-shocks, helping to narrow the gap and return output toward its natural level
these measures are predictable which creates trading opportunities
ie if the economy is overheating, we expect higher interest rates so would be a good time to buy a government bond
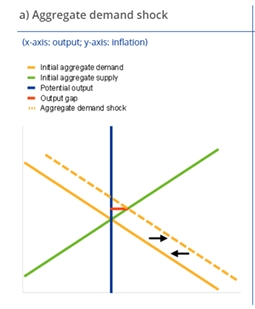
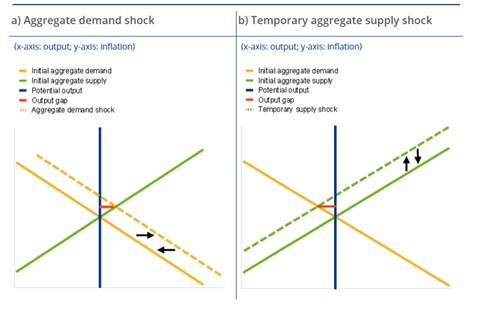
example of an aggregate demand shock
introduction to open AI
resulted in aggregate demand shock to the right
causes the economy to be richer
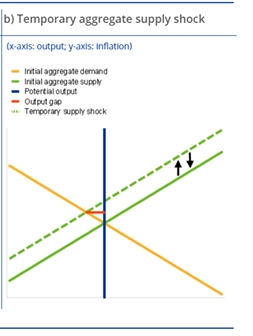
example of an aggregate supply shock
70s oil crash
results in aggregate supply shock to the left
quantity theory of money formula
M = money supply
V = velocity of money
P = price level
T = transactions or output
if we hold the left constant, this implies a negative relationship between P and Y
ie if price goes up, transactions will go down and vice versa

what can help to close the output gap?
shifts in aggregate demand
governments can artificially create a shock to demand or supply
eg Trump’s helicopter money during COVID-19
eg Sunal’s eat out to help out scheme during COVID-19
is giving money to everyone a good way to stimulate the economy?
the money has been raised through taxpayers; not coming from nowhere
it raises the supply of money, resulting in inflation
there are different welfare impacts
would have no effect on super rich individuals but have a huge impact on poorer individuals
results in high levels of demand
could stimulate supply instead
used in China during COVID-19 pandemic by subsidizing suppliers
results in jobs being maintained which is more beneficial in the long-run
however, this results in more being produced than needed, creating a downward pressure on prices
how can we gain insight into the current state of the economy?
by examining output (real GDP) and unemployment
however, GDP growth is not reflective of how individuals are doing
eg, salaries could be low but net exports could be high
output level is more reflective on how individuals are doing
trends in these indicators help us assess whether the economy is expanding or contracting
ways to identify a business cycle
two consecutive quarters of negative real GDP growth
the Conference Board Leading Economic Index (LEI)
it provides an early indication of significant turning points in the business cycle and the near-term economic outlook
is nowcasting accurate and precise?
no, the margins are very large
common sources of shocks
financial market disruptions
eg Blackrock don’t publish their deals but even if they did, we wouldn’t understand the impact of them
international disturbances
technological changes
energy price fluctuations
monetary policy actions aimed at controlling inflation
hard to make ex-ante predictions on the impact of the shocks
COVID-19 recession was short-lived
few anticipated the AI-driven boom in 2022
are business cycles the same?
no
the great recession differed to the energy crisis recessions
facts about the great recession
longest economic downturn since WWII
deepest recession prior to COVID-19
real GDP fell 8.5% in Q4 2008
unemployment peaked at 10% in October 2009
triggered by the subprime mortgage crisis and the collapse of the US housing bubble
facts about the energy crisis recessions
energy crisis 1: january - july 1980
energy crisis 2: july 1981 - november 1982
after the oil shock , the economy expanded briefly, but inflation remained high, peaking around 15% in 1980
period ended in a ‘double-dip’ recession
the 1980 recession was partly triggered by Fed rate hikes to combat inflation
the 1981-82 recession was the worst since the Great Depression
unemployment reached nearly 11% and GDP fell by 1.8%
Ray Dalio’s credit cycle explanation
Ray Dalio argues that the business cycle is driven by the credit cycle
in periods of optimism, borrowing expands
eventually, debt must be repaid, leading to contractions
if only one individual accumulated a lot of debt, it would have no impact but if the whole population does this, it can be very problematic
the process generates excessive booms and busts in economic activity
it is intuitive as credit expansion and contraction fluctuates over the business cycle
characteristics of a recovery
unemployment declines as firms begin to increase hiring
inflation remains relatively low, but may start to rise as demand picks up
consumer spending increases, potentially leading to moderate inflation
discount rate (R) may stay low to encourage borrowing and investment (ie low interest rates)
cash flow (CF) typically improves as economic activity picks up
characteristics of overheating/expansion
strong labour demand tightens the job market and pushes wages higher
low unemployment and rising inflation emerge
this means there are more job posts for one individual (ie labour demand > labour supply)
central banks respond by raising interest rates to cool the economy
discount rate (R) tends to increase in order to cool down the economy and curb inflation (due to increased interest rates)
cash flow (CF) peak or near peak levels (due to high levels of spending) but inflation may erode real gains
ie high cash flow but decelerating
characteristics of stagflation/slowdown
employment may stagnate
economic performance deteriorates
most challenging environment for central banks
interest rates must remain high despite slowing growth
discount rate (R) is challenging to adjust
may increase to control inflation or decrease to stimulate growth
high interest rate, peaked
cash flow (CF) may stagnate or grow minimally due to economic sluggishness (lower CF)
characteristics of contraction/recession
rising unemployment
reduced consumer spending
central banks cut interest rates to stimulate growth
discount rate (R) generally decrease to stimulate borrowing and economic activity
cash flow (CF) often declines as companies face reduced demand and potentially lower profitability
what matters when we want to invest in fixed income assets?
cash flow are given so interest rates (R) are the dominant factor
fixed income tends to be attractive when interest rates peak/start to fall
indication of the economy entering a downturn/contraction
means interest rates will be low, resulting in high price
what matters when we want to invest in equities?
cash flows and interest rates
recovery and early recession phases often signal improving prospects
typically favourable for equity investment
when do fixed income asset perform the best?
when the economy begins to contract
the return is much higher
shows how returns are heavily influenced by business cycles
when do equities perform the best?
perform the best in the contraction (recession) and recovering stage
however, they don’t do their best in the start of the slowdown (it can be very negative)
therefore, a common portfolio strategy is 60/40 fixed income/equities
this is because it creates a hedge as when equities are not doing well, fixed incomes are doing well
are all industries experience pro-cyclical movements with their assets?
no
during the slowdown phase, defensive or counter-cyclical sectors such as Health Care and Utilities tend to perform well
why is utility counter-cyclical?
energy is always needed, no matter how the economy is doing
additionally, since the uprise of open AI, a vast amount of energy is needed to power the plants
results in the industry to be even more counter-cyclical
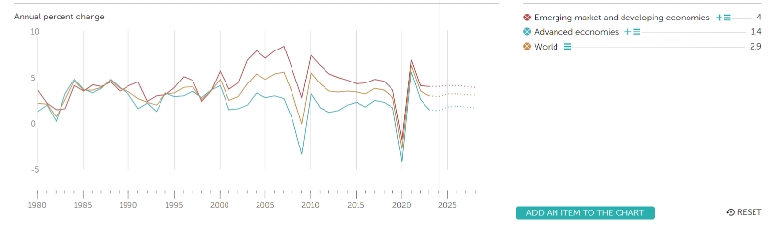
what does this graph show us?
shows that although there are some short-term fluctuations in output growth, real output will gradually drift up
emerging economies are growing faster than developed economies
factors such as innovation in AI and change in population structure are more important for long-term investment
short term noise such as Trump’s discussion about greenland won’t have major impact on long-term investment
it is only important if we are looking at short-term speculation
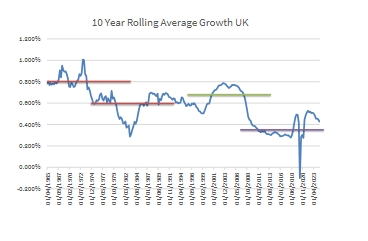
What does this graph show us?
it shows that over the long run, output tends to grow but long-term average growth rates has varied widely
eg in the 70s we had the oil price crash, resulting in lower growth
have to understand what ‘normal’ is to identify what is ‘abnormal’ and set realistic expectations
key assumptions of the solow growth model
the economy only produces a single output (goods)
there are diminishing returns to capital and labour
the economy has a constant savings rate and population growth rate
technology improves at a constant rate
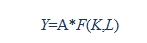
production function in the solow growth model
Y = output
function of capital and labour
K = capital
L = labour
A = productivity
it is a scaling factor that allows us to compare economies whose growth are determined by different factors (eg AI vs cultural)
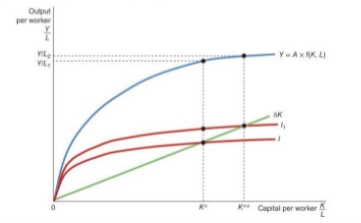
f(k) = a function that represents how capital per worker is transformed into output per worker
assumes constant returns to scale
exhibits diminishing marginal returns to both capital and labour
production function describes how total output is generated from inputs of capital and labour
how can output be allocated, according to the solow model?
current output can be allocated for both saving and consumption in the following year
we can make into per-capita by dividing by total population
consumption brings us happiness but by saving, we will be able to consume more in the future
savings don’t just sit in the bank, they will be converted into investment

investment equation in solow mdoel
investment will always represent a proportion of the total output
investment will be converted into capital and can be used to produce more output in the future

net capital accumulation formula in solow model
the difference between investment and depreciation
as investment increases and the capital stock grows, depreciation rises proportionally, reducing the net rate of capital accumulation

is the value of capital constant?
no
once capital is built, their value gradually declines over time through depreciation
depreciation affects the entire existing capital stock, not just newly added capital
even when new investment occurs, older capital continues to lose value
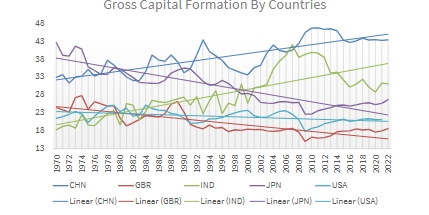
why do India and China experience growth through capital formation but not the UK, Japan, or the US?
China and India benefit as the initial capital stock was low, meaning depreciation was low
although at some point, they will face diminishing returns
comparing to the UK, US, and Japan, they had higher levels of initial capital stock meaning that their levels of depreciation were higher and they reached their steady state quicker
this is why they invest less heavily in infrastructure
what is the effect of higher levels of saving in an economy?
higher saving rate means that, for a given level of output, more resources are allocated to investment, leading to a higher equilibrium level of output
what is the effect of a declining working age population?
results in change in demand for goods
eg we may need fewer houses but more house carer services
what is the prediction of the solow model with higher levels of population?
an increase in the rate of population growth reduces the capital per worker, leading to a lower level of output per worker
on average, everyone will become poorer as the average output per worker drops
this is not entirely accurate though as we see in India and China that have very high levels of population but have not become poorer due to this
what can help to explain why the solow model prediction that higher population = poorer population is wrong?
differences in demographic structure can lead to different economic outcomes
ie the life-cycle hypothesis
a larger working-age population increases aggregate saving, and therefore investment, leading to higher levels of output
we would expect workers to save for retirement, large purchases such as a house etc
this results in investment to be positively associated with population
the structure of the population is a large determinant for investment
why do developed economies continue to experience growth, sometimes even at a faster rate than emerging markets?
economic development/productivity growth
change in productivity (A in the solow model) affects output per worker and therefore, living standards
higher level of A will scale all inputs up, resulting in higher levels of output
even if labour and capital is low, higher levels of productivity can result in higher levels of output
resources are allocated in a more efficient way
developed economies continue to grow mainly through technological progress
this is because if there is slow population growth, this constrains the labour input
additionally this constrains capital due to lower levels of investment
why is productivity not growing that fast in Europe?
could be due to EU regulations
what is an interesting insight on east Asian economies with productivity?
they are doing very well in terms of innovation which allows them to grow
they are unable to grow through labour due to low fertility rates
what increases labour productivity growth?
greater or higher-quality capital
more efficient use of labour and capital together
can look into changes in capital intensity and capital quality
how does AI affect the productivity of economies?
will result in different levels of productivity
a country’s access to new technologies will ultimately decides this
AI is now overtaking entry-level jobs, affecting graduates’ job prospects
possible reasons behind Britain’s productivity puzzle
chronic and road based under-investment
inadequate diffusion of productivity-enhancing practices between firms and places
institutional fragmentation and lack of joined-up policies
what is the effect of productivity on incomes?
low productivity growth = poorer economy
eg in the UK, productivity should be about 24% higher than it is today if it continued to follow its pre-crisis trend
this means that our salaries should be 24% higher
relationship between growth and corporate savings
some companies (earnings per share/EPS) have a higher correlation with domestic output than with global output
suggests that these countries are more self-sufficient and don’t need to rely on other countries
if EPS growth has higher correlation with global GDP, the country is driven more by exports
this means exposure to foreign markets will become important
corporate earnings and growth rates are highly correlated
corporate announcements can given an indication of future growth as companies tend to have forward-looking strategies
does high output = high stock return?
not really
Ritter (2025) found that there was no positive relationship between return and GDP growth
reasons behind this:
if increase in capital and labour inputs go into new corporations, these do not boost the present value of dividends on existing corporations
equity index does not directly capture new innovation, meaning that the relationship found may be subject to some measurement error
technological change does not increase profits unless firms have lasting monopolies, a condition that rarely occurs
countries with high growth potential do not offer good equity investment opportunities unless valuations are low
ex-ante vs ex-post (measuring relationship between output and stock returns)
output are lagged compared to the equity market
using ex-ante measure to forecast lagged variable doesn’t make sense
also we would be using the stock market to predict the output when we are wanting to use output to predict the stock market
expected return and realized return are different
expected returns are not observable; we can only estimate
eg using historical return or asset pricing model such as CAPM
realized return can be very different from the expected return
why is it important to understand the relationship between output and asset returns?
important from risk perspective: market tends to crash when the output crashes
helps us to understand the motivations of other market participants
unlike investors, who are mainly driven by returns, corporations tend to be more earnings-driven
policy markets care about output, and their policies will influence investment decisions
eg if output has been low for a long time, policy makers will make some effort to increase investment incentives to increase output
builds a foundation for global asset allocation
helps us to understand the consensus view and, therefore, market sentiment
are new technologies/innovation captured in equity index?
no
this is because new innovative firms are relatively small whereas the equity index captures mature firms
can explain why we don’t see the positive relationship between equity return and GDP empirically
why did the price of gold/silver drop at the end of january?
due to Trump’s announcement of the new Fed head
shows how much of an influence news about central banks have on financial market
the announcement removed some uncertainty, which had previously led to an increase in prices of gold and silver
additionally, Warsh (new nominee) is seen as hawkish
interest rates and price of gold typically move in opposite directions
this means that price of gold is likely to be low for a while as he increases interest rates
key functions of the central bank
issuing currency
sole authority
responsible for issuing banknotes and coins
banker to the government
manages government accounts and public debt
regulating banks
supervises and regulates commercial banks to ensure financial stability
implementing monetary policy
controls the money supply and interest rates to influence economic activity
dual mandate of Federal Reserve
two main objectives: to promote maximum employment and ensure price stability
output is NOT an objective
maximum employment
refers to the highest level of employment an economy can achieve without triggering an acceleration in inflation
need to strike a balance
although higher wage increases welfare, it will result in wage-price spiral inflation
price stability
defined as maintaining a low and stable rate of inflation over an extended period
eg the Fed aims for an inflation rate of around 2%
however, they don’t adjust the policy so frequently as they look over the long-run horizon
eg if for one quarter there is low inflation but in the next quarter there is high inflation, as long as on average it is around 2%, the policy won’t change
summary of Fed’s mandate
promote price stability and maximum employment (dual mandate)
moderate long-term interest rates
summary of BoE’s mandate
maintain price stability (inflation target set by government)
support economic policy (including growth and employment)
oversee financial stability
summary of Bank of Japan (BoJ)’s mandate
achieve price stability (around 2% inflation over medium/long term)
contribute to financial system stability
summary of European Central Bank (ECB)’s mandate
primary objective: maintain price stability (~2% inflation target)
secondary objective: support general economic policies of the EU (eg growth, employment)
summary of People’s Bank of China (PBoC)’s mandate
maintain stability of the RMB’s (Renminbi - chinese currency) value
carry out monetary policy under state council direction
promote economic growth and financial stability
difference in mandates for BoE and Fed
inflation is the priority for BoE
inflation AND employment are equally as important for the Fed
how is the People’s Bank of China different to most central banks?
it is not independent
decisions are made at state council level
this makes it more complicated but the policies taken by the bank will be more aligned to the government’s policies
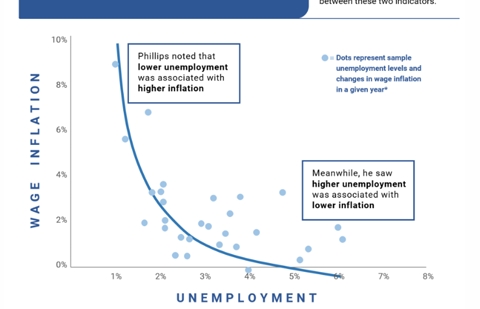
what does the phillips curve illustrate?
it illustrates the negative relationship between unemployment and inflation
intuition: a lower unemployment rate means people are working, increasing demand for labour
puts upward pressure on wage so firms raise prices for their products
never a linear relationship
a one percentage difference in unemployment makes a more than proportionate change in inflation
this makes it more difficult for central banks (especially the Fed with their dual mandate) to create optimal policies
as unemployment increases, it has less of an impact on price levels
it’s not until it decreases to around 4% where we see a large impact on price levels
this is when central bankers will become more hawkish as they know having this price level is unsustainable
in what way does the Fed have a triple mandate?
although it isn’t an explicit mandate, the Fed plays a key role in stabilizing financial markets during crises
eg in March 2023, stress in the US banking system following problems at Silicon Valley Bank promoted the Fed to intervene
the Fed stopped what they were doing to help support the financial market in the short run
despite ongoing rate hikes and quantitative tightening, the ed introduced the Bank Term Funding Program (BTFP) to inject liquidity, leading to a temporary expansion of its balance sheet
key features of Bank Term Funding Program (BTFP)
offered loans of up to one year to banks
institutions could use US treasury bonds and other high-quality collateral as securities for loans, valued at par
avoided banks selling these securities in times of financial stress
program aimed to provide liquidity to financial institutions, helping them meet the needs of depositors and stabilize the banking sector during periods of uncertainty
introduce in March, 2023 in response to the banking crisis
objectives of the Federal Open Market Committee
promote maximum employment, price stability, and moderate long-term interest rates
makes key decisions on interest rates and the US money supply
importance of an independent central bank
the Fed sets the risk-free rate, which serves as the anchor for asset prices
unlike the executive branks, the Fed is not subject to elections
can lead to tensions between the Fed and the President
while the President nominates both Fed Governors (14-year terms) and the Chair (4-year term), any loss of credibility would be disastrous
there isn’t an actual limit to the Chair
ie, you could re-elect the same Chair after the 4 years was up