Chapter 3 - Measurements of Economic Performance
1/84
Earn XP
Description and Tags
Name | Mastery | Learn | Test | Matching | Spaced | Call with Kai | Chat |
|---|
No analytics yet
Send a link to your students to track their progress
85 Terms
The National Accounts
National income and product accounts, or national accounts, keep track of the flows of money between different sectors of the economy.
The Circular-Flow Diagram
This diagram is a simplified representation of the macro economy. Showing the flows of money, goods and services as well as factors of production through the economy.
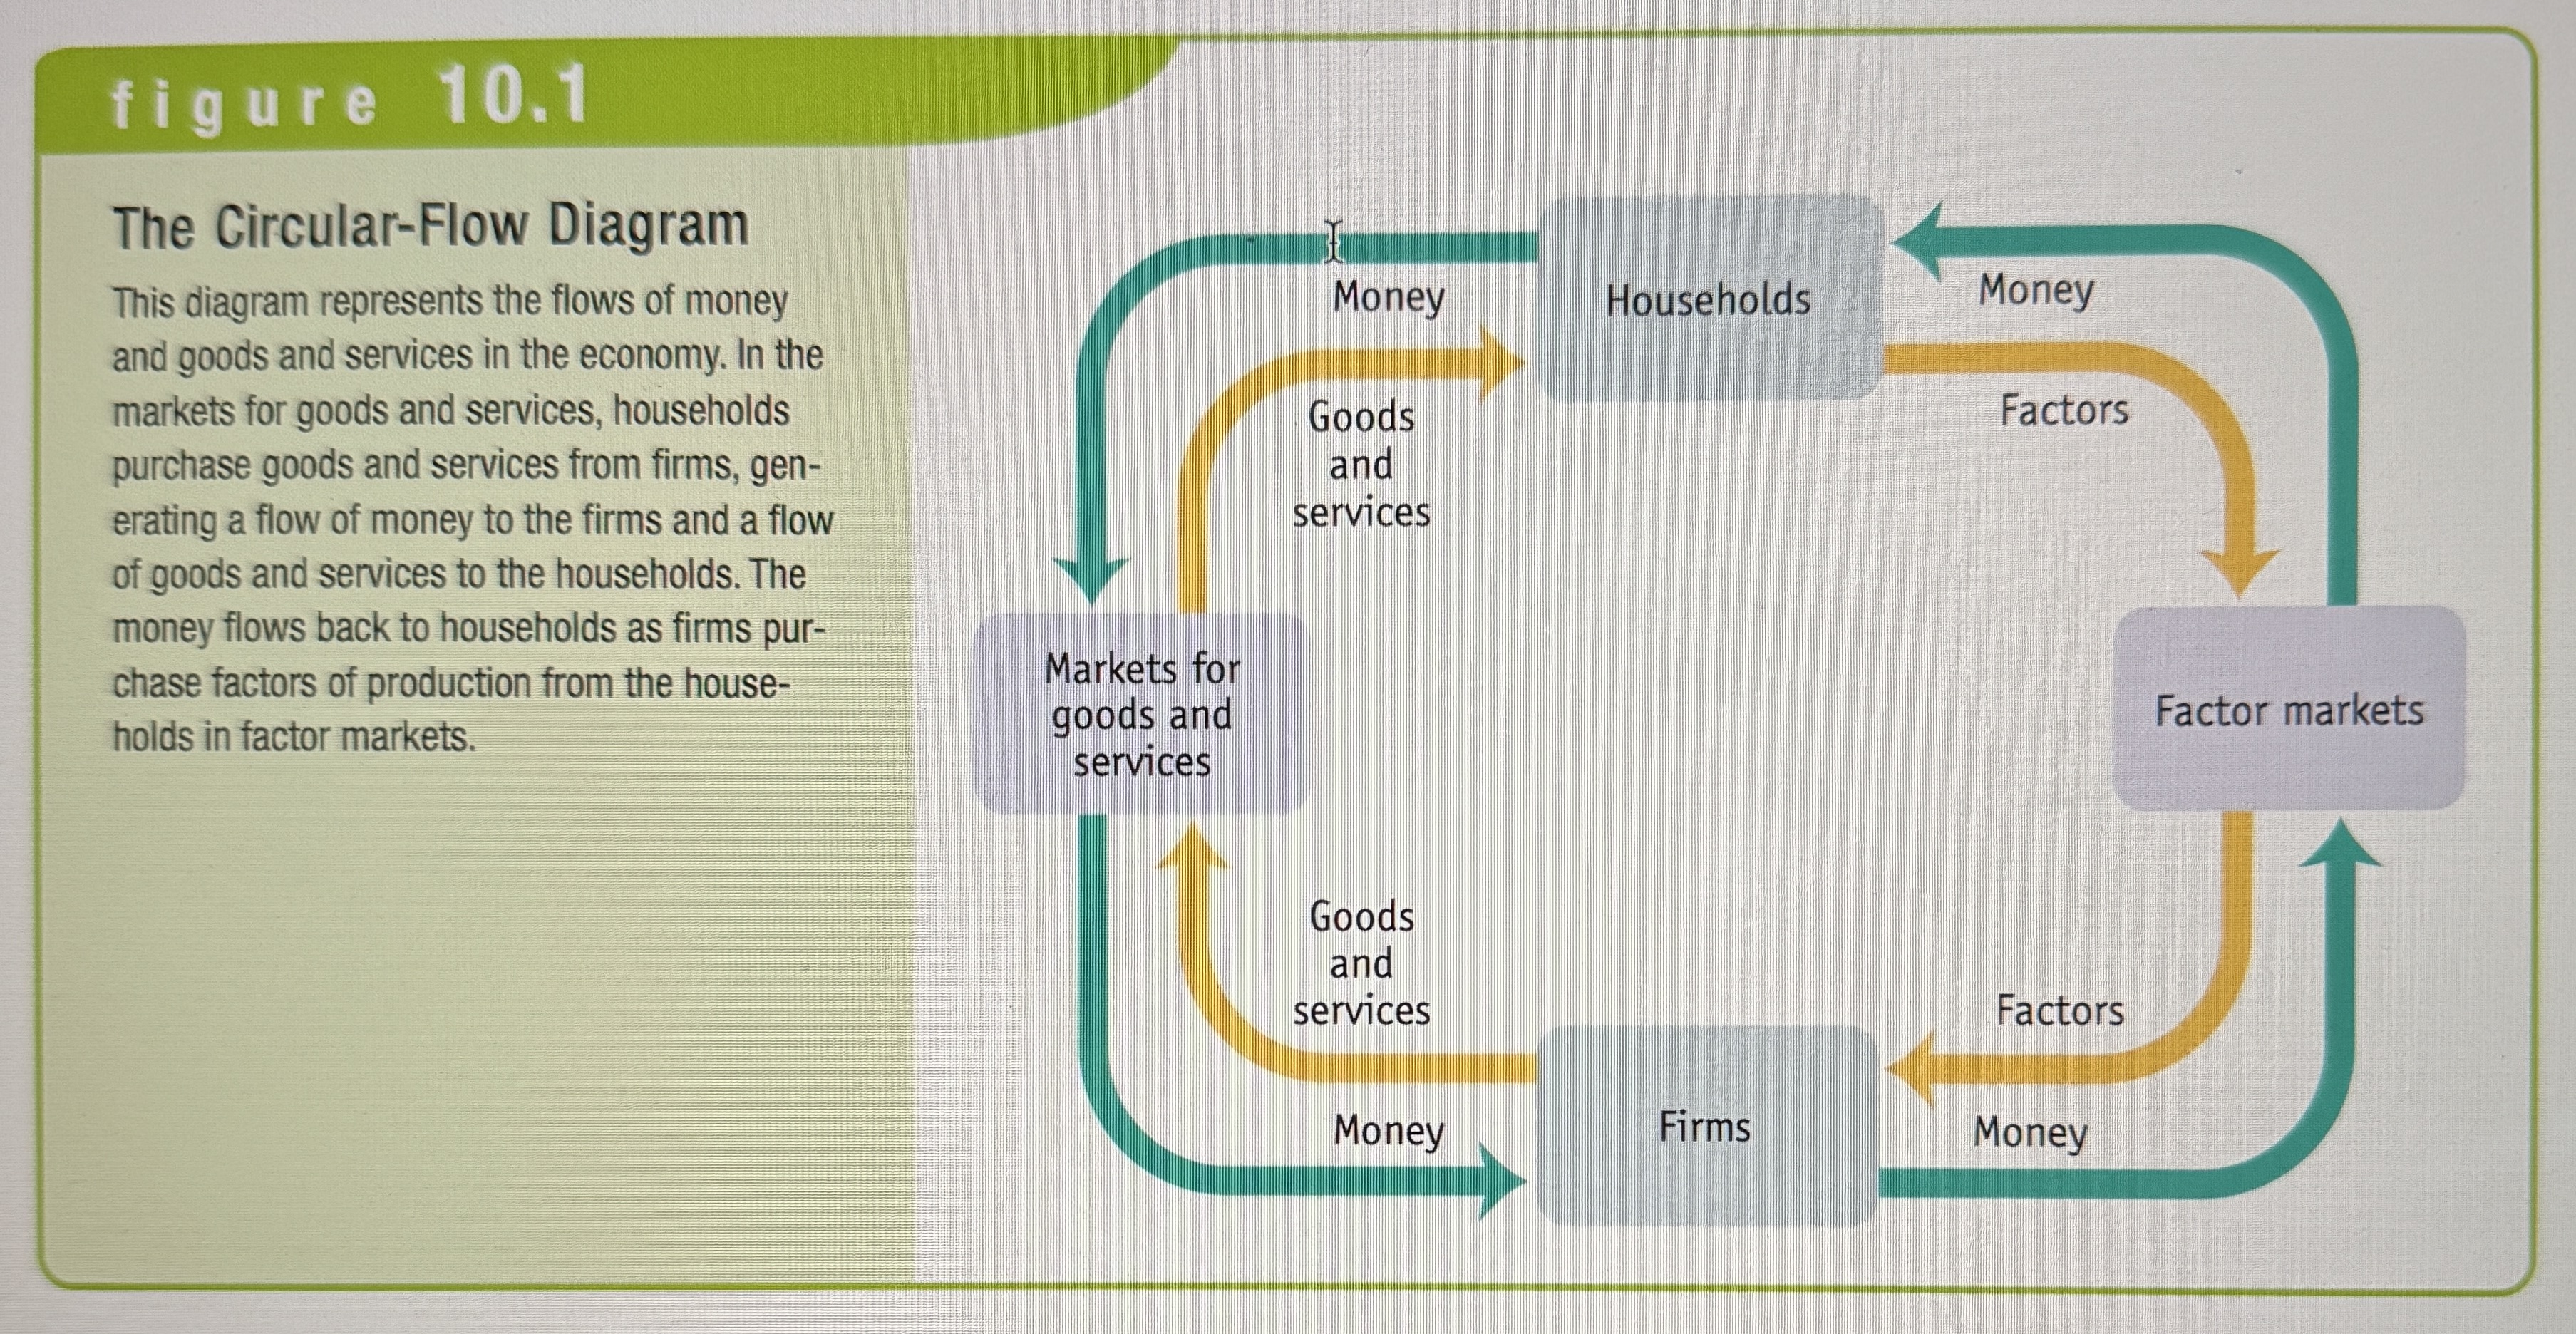
A household
A person or group of people who share income.
A firm
An organization that produces goods and services for sale.
Product Markets
Where goods and services are bought and sold.
Factor Markets
Where resources,especially capital and labor, are bought and sold.
Consumer Spending
Household spending on goods and services
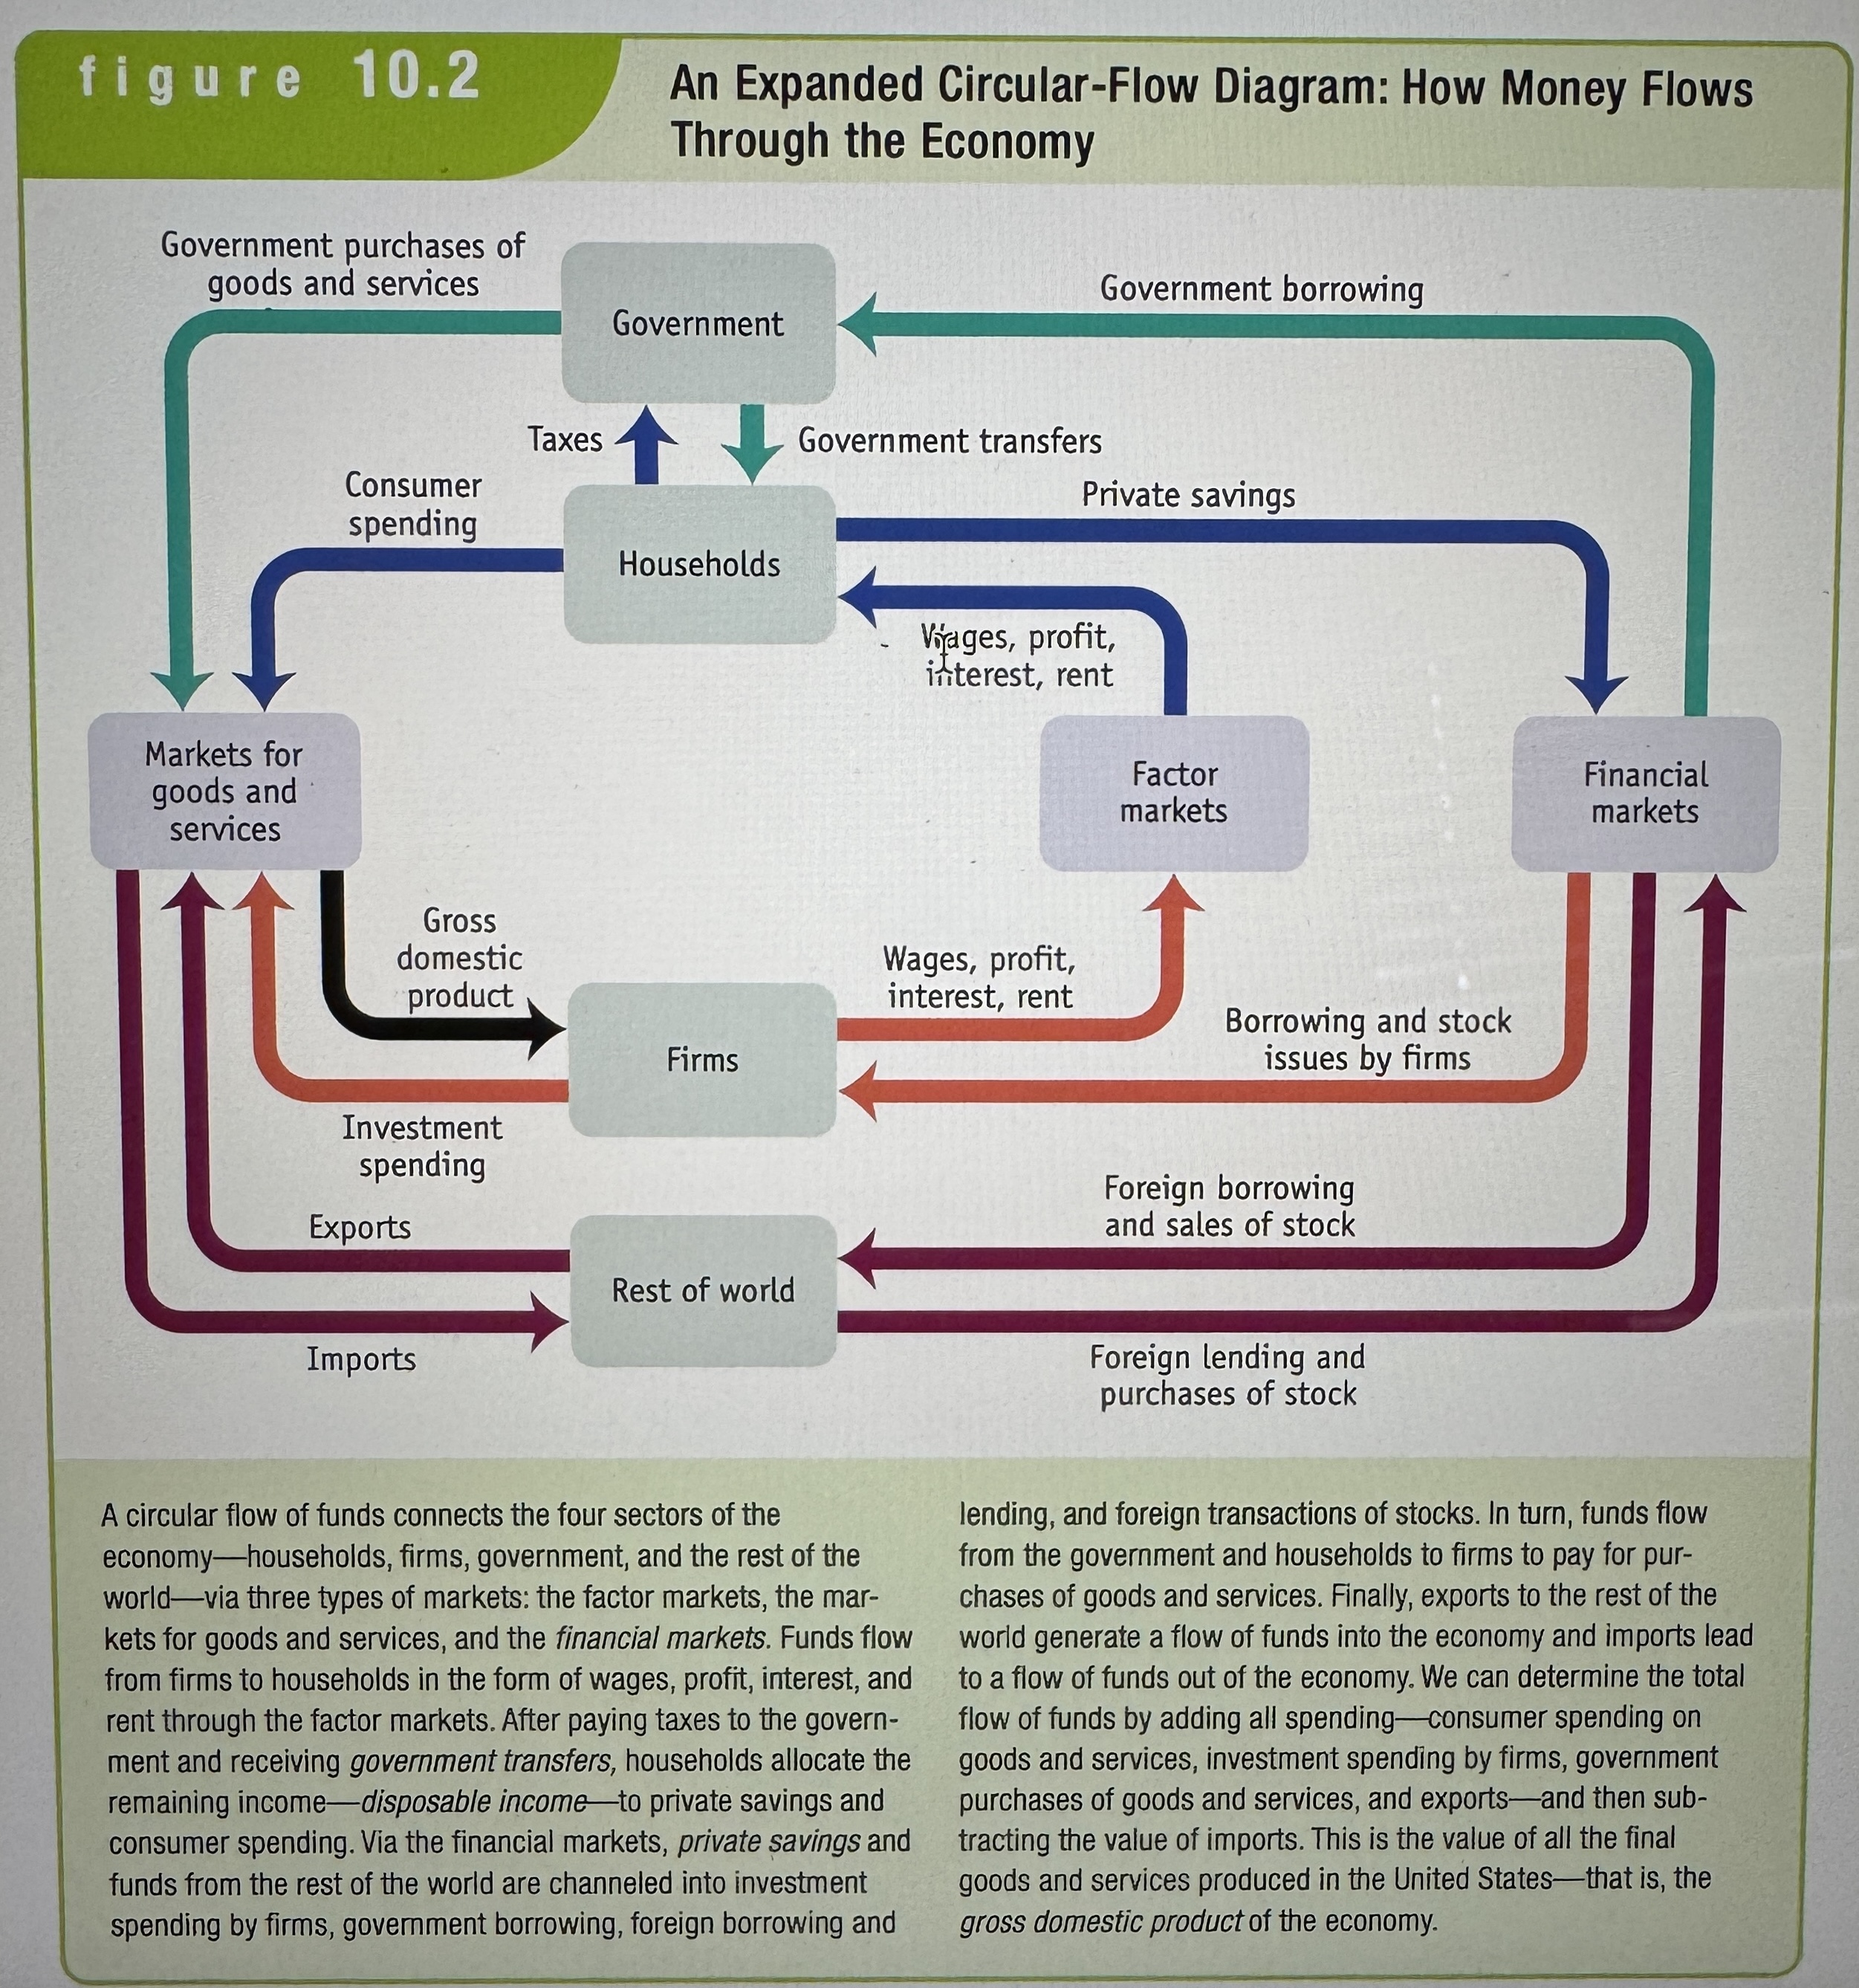
An expanded Circular-Flow Diagram
Ex.
Stock
A share in the ownership of a company held by a shareholder.
Bond
A loan in the form of an IOU that pays interest.
Government Transfers
Payments that the government makes to individuals without expecting a good or service in return. Think social security or Medicaid.
Disposable Income
An amount equal to income + government transfers - taxes. It is the total amount of household income available to spend on consumption and to save.
Private Savings
An amount equal to disposable income - consumer spending. It is disposable income that is not spent on consumption.
Financial Markets
The banking, stock, and bond markets, which channel private savings and foreign lending into investment spending, government borrowing, and foreign borrowing, are known as the financial markets.
Government Borrowing
The amount of funds borrowed by the government in the financial markets.
Government Purchases of Goods and Services
The total expenditures on goods and services by federal, state, and local governments.
Exports vs Imports
Goods and services sold to other countries are exports. Goods and services purchased from other countries are imports.
Inventory
Stocks of goods and raw materials held to facilitate business operations.
Investment Spending
Spending on new productive, physical capital, such as machinery and structures, and on changes in inventories.
Final goods and services
Goods and services sold to the final, or end, user.
Intermediate goods and services
Goods and services bought from one firm by another firm to be used as inputs into the production of final goods and services.
Gross Domestic Product
The total value of all final goods and services produced in the economy during a given year. GDP for short.
Aggregate Spending
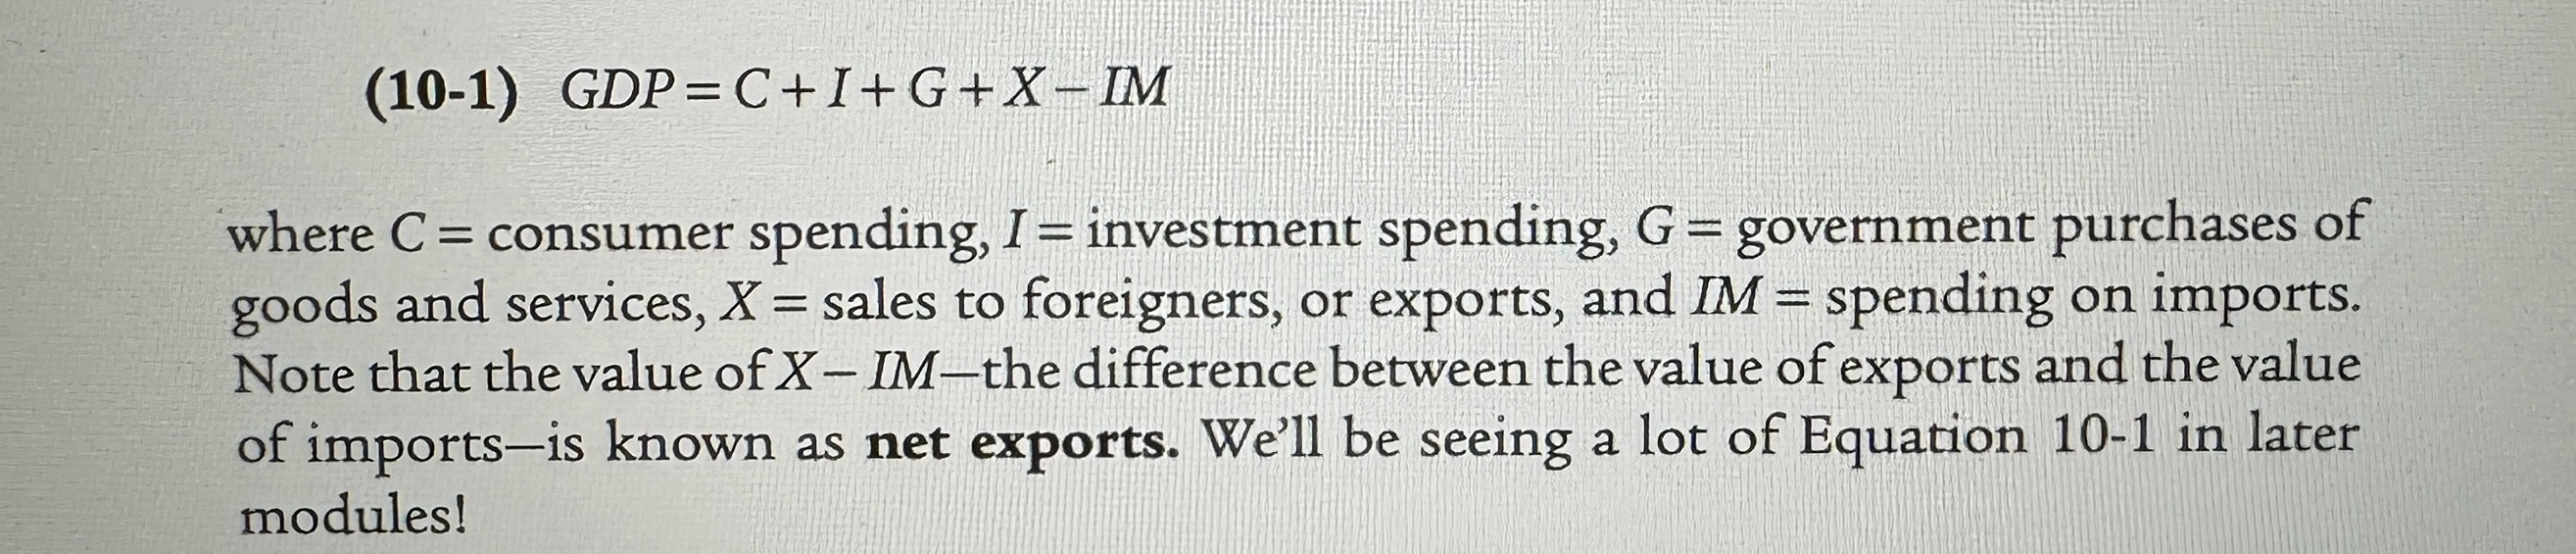
The total spending on domestically produced final goods and services in the economy – is the sum of consumer spending (C) , investment spending (I) , government purchases of goods and services (G) , and exports minus imports (X - IM).
How to calculate GDP?
Ex.
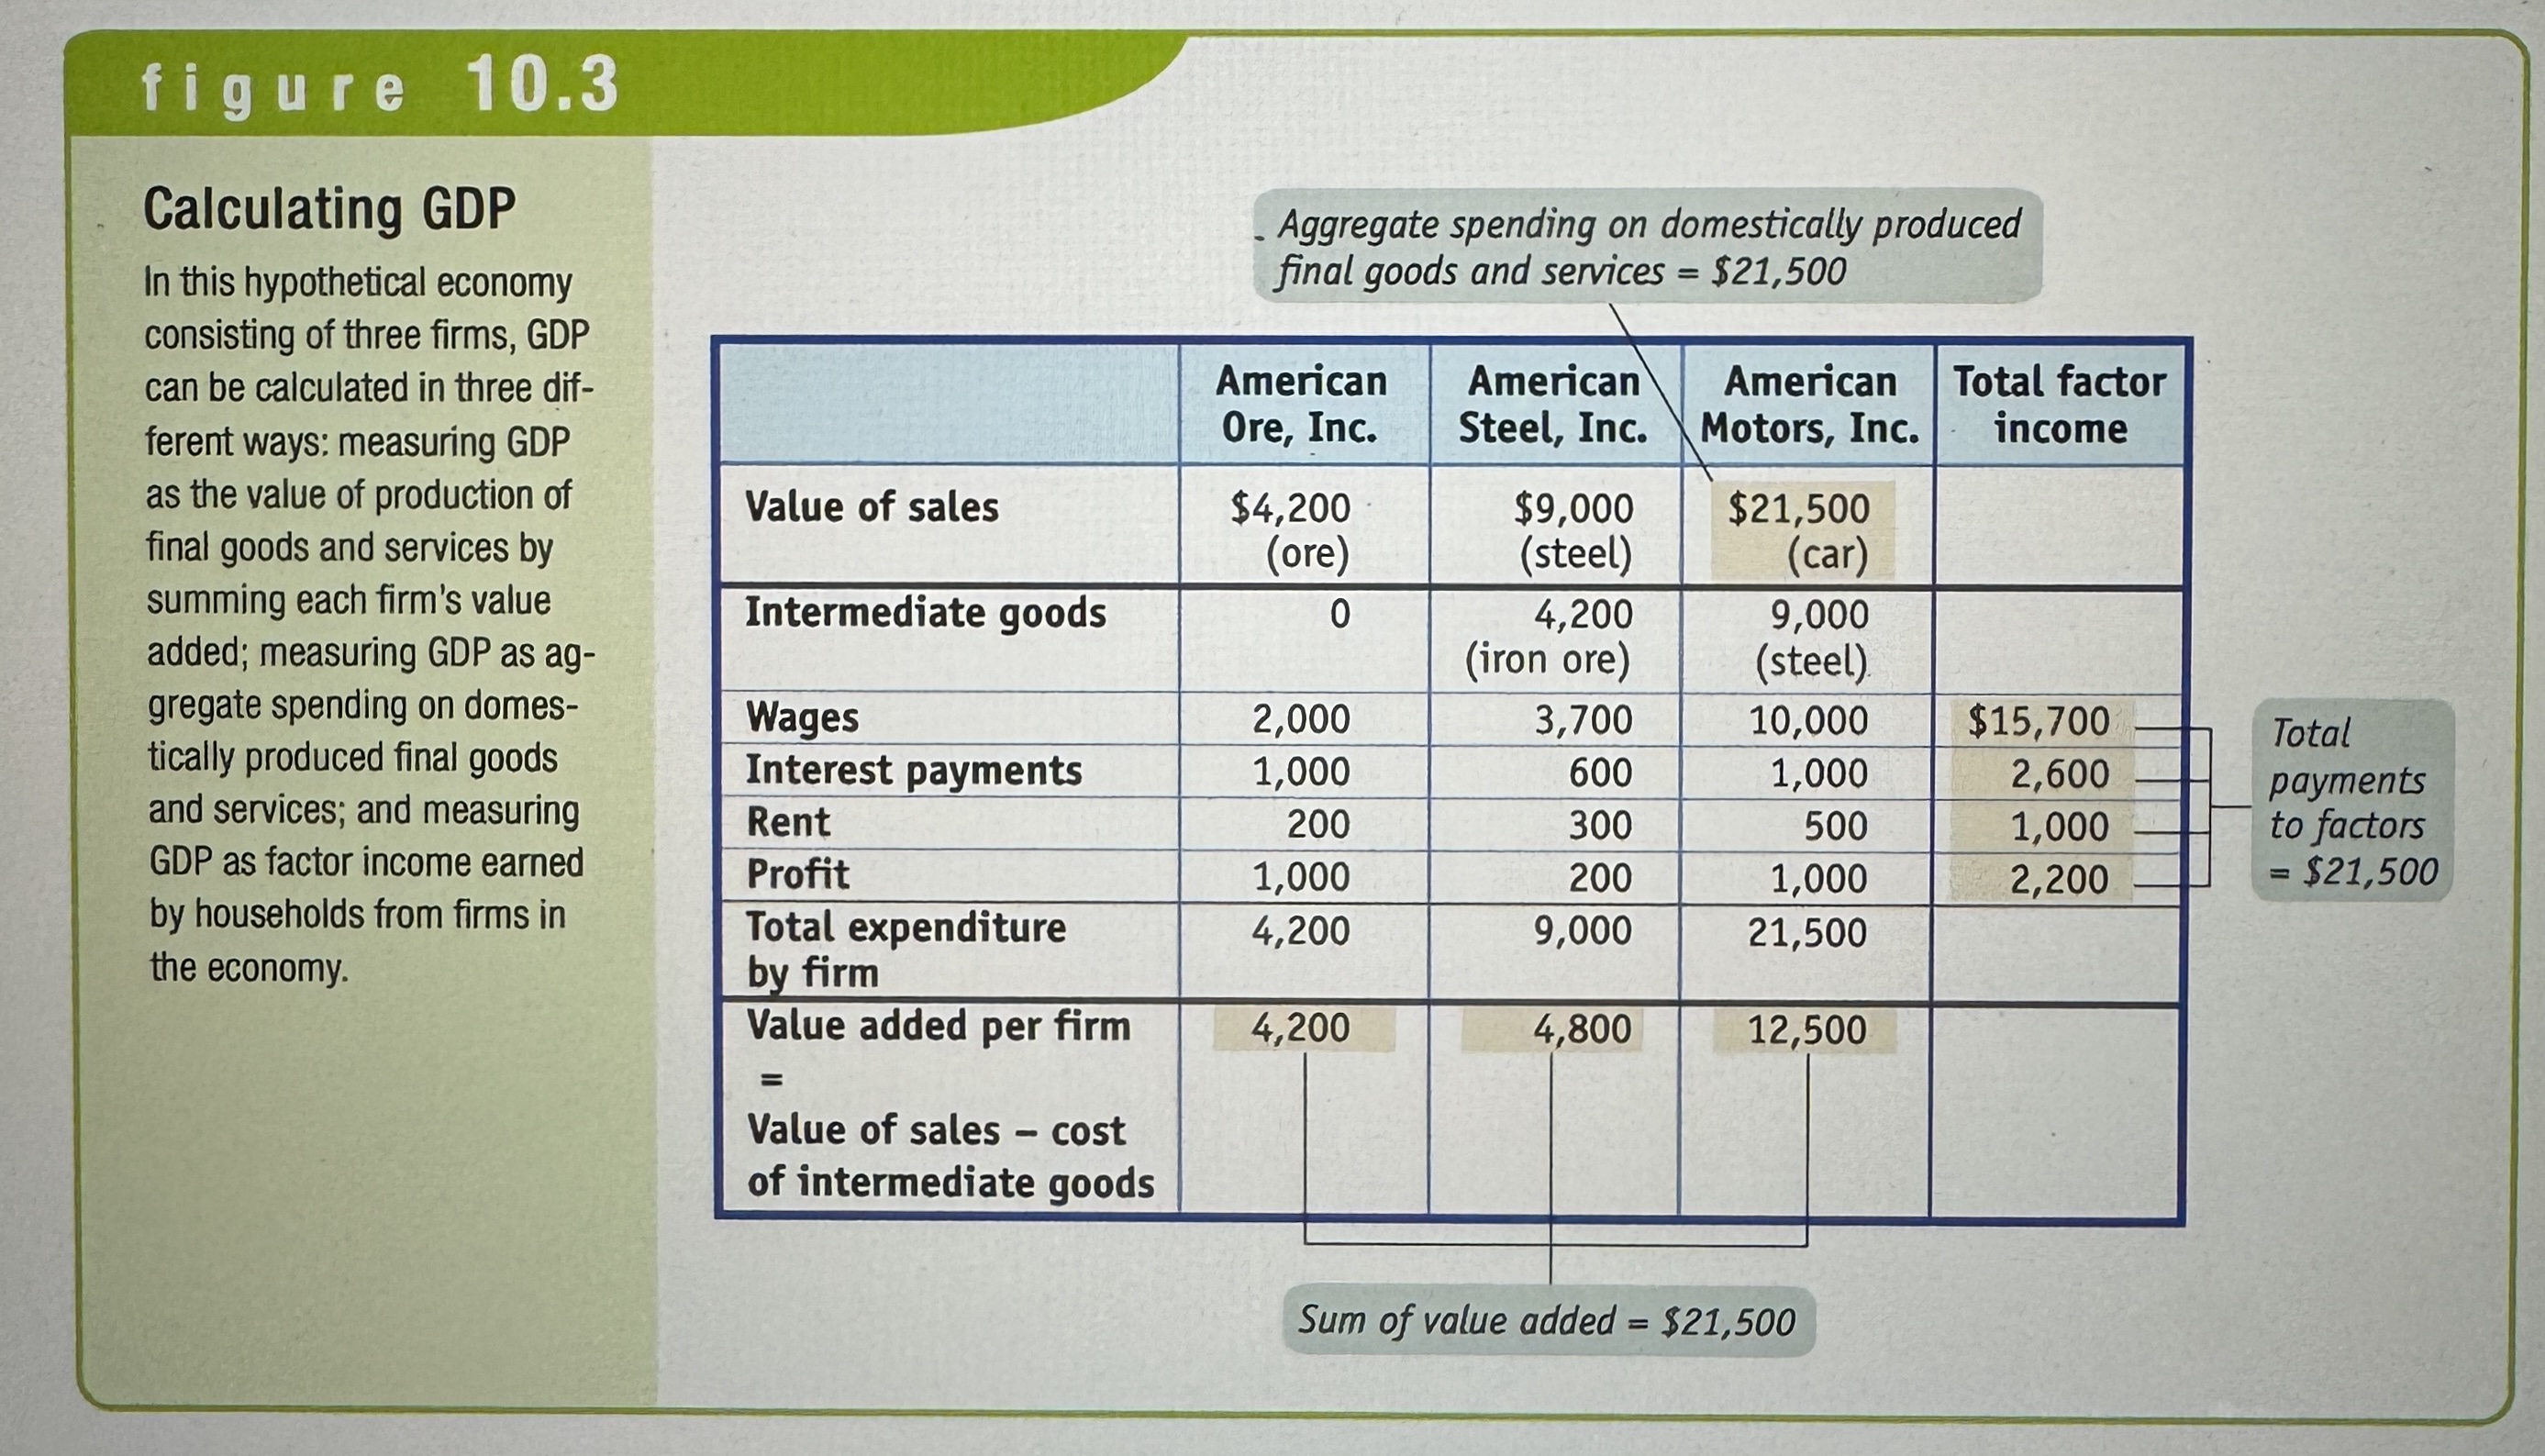
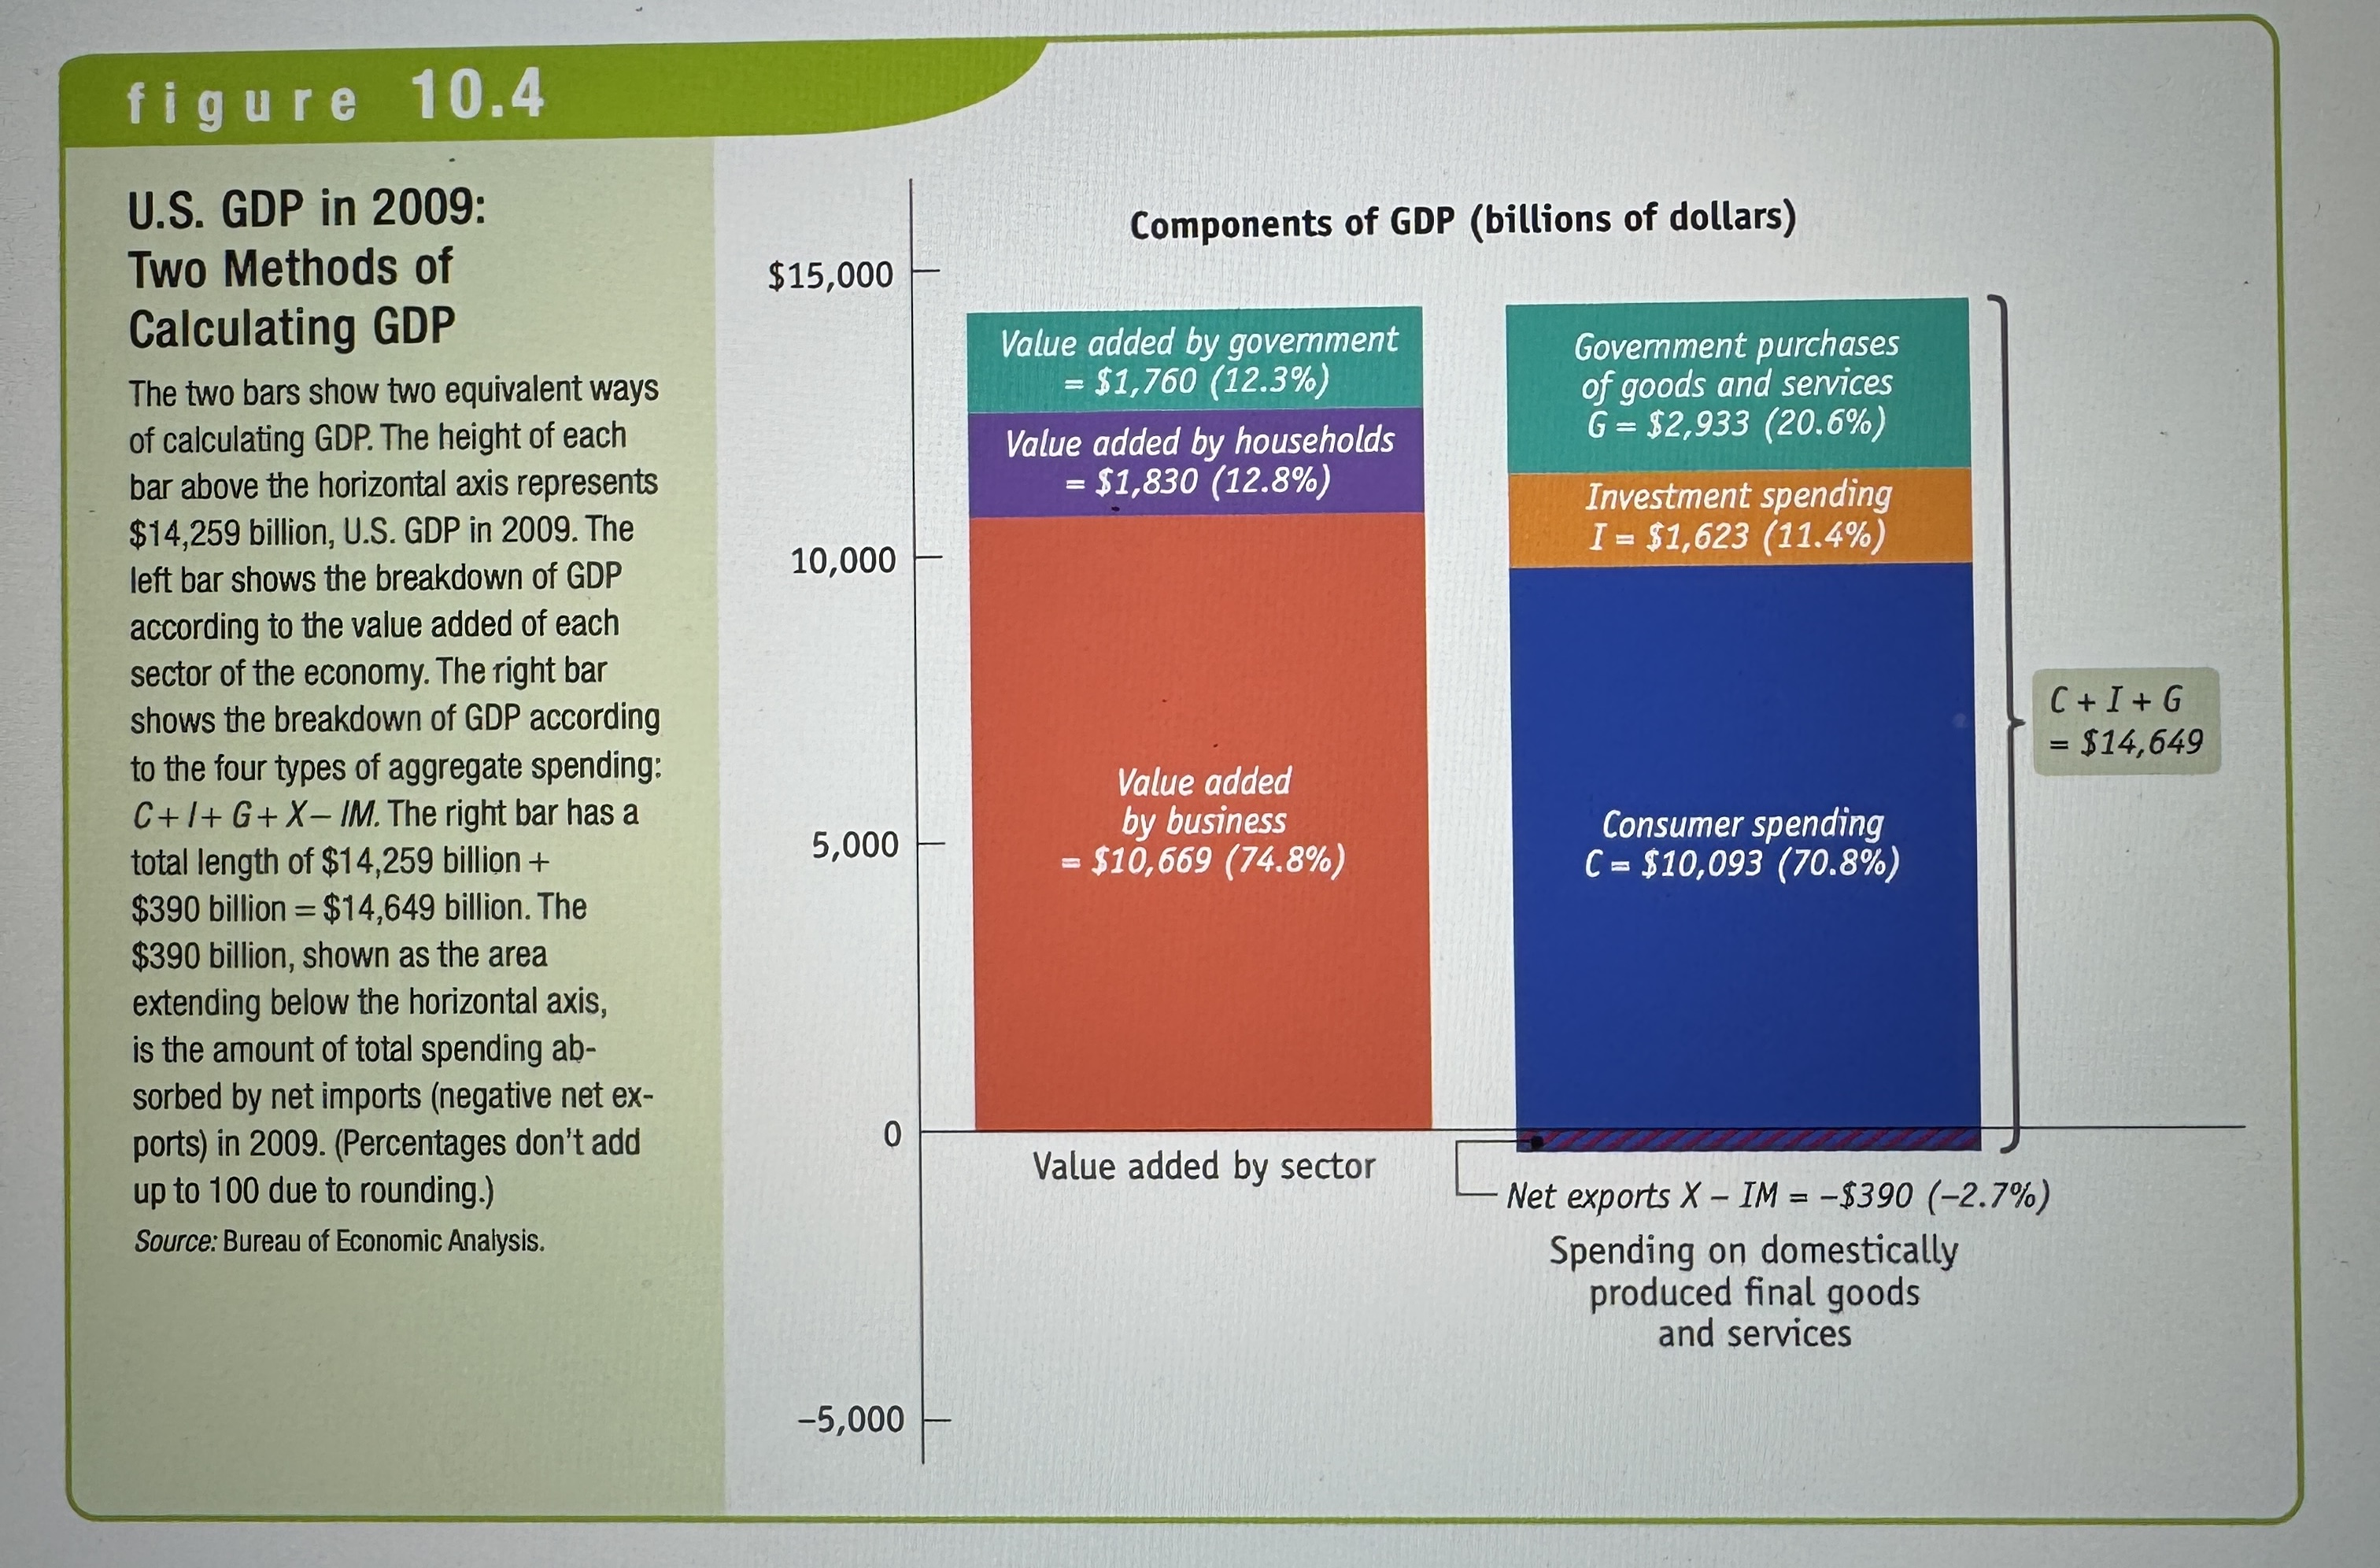
Value Added
The value added of a producer is the value of its sales minus the value of its purchases of inputs.
Net Exports
The difference between the value of exports and the value of imports.
Aggregate Spending GDP Equation
Ex.
U.S. GDP in 2009
Ex.
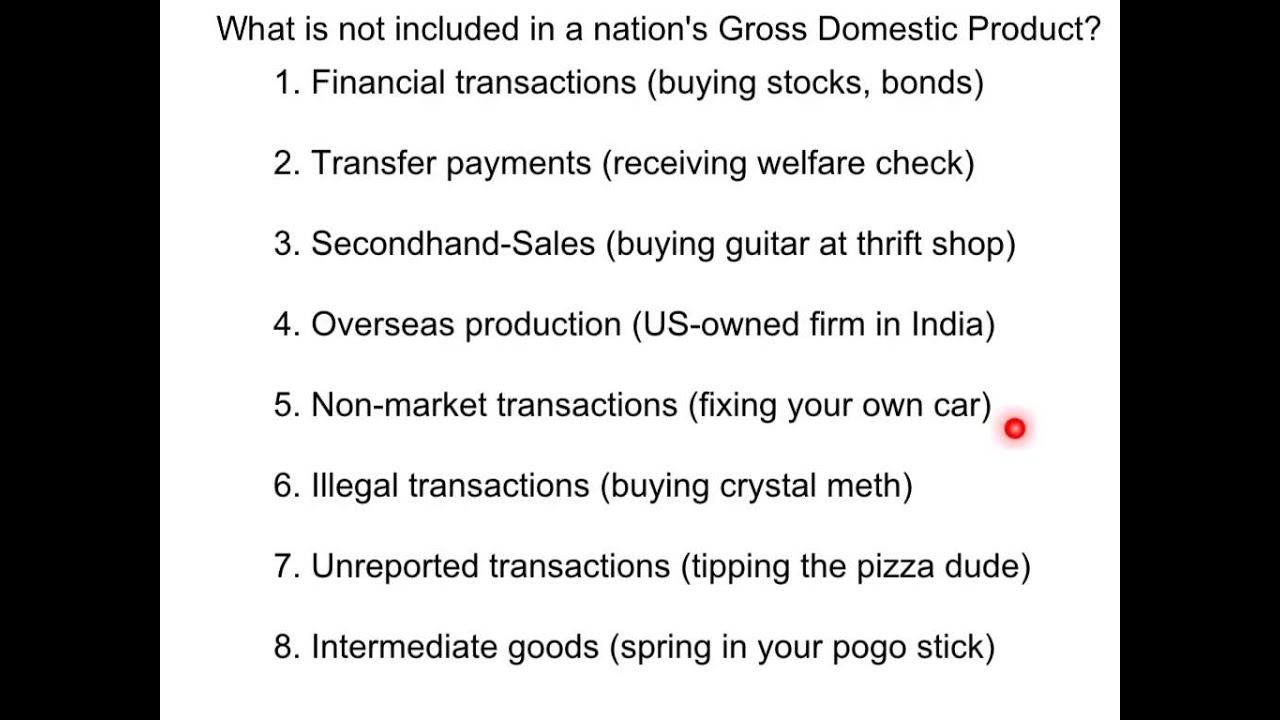
What isn’t included in GDP…
Ex.
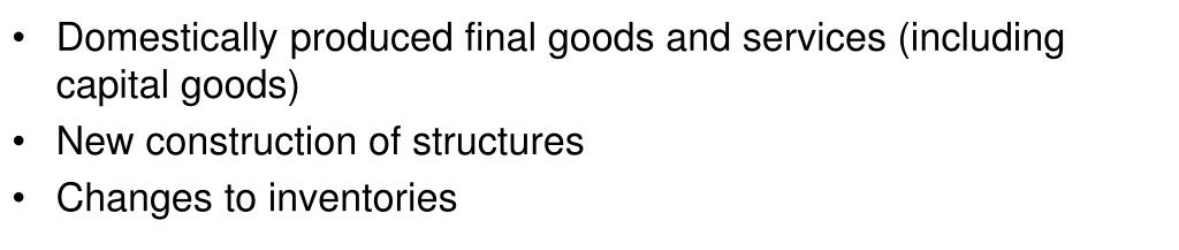
What is included in GDP…
Ex.
Aggregate Output
The total quantity of final goods and services produced within an economy. Know as real GDP.
GDP vs Real GDP
The real GDP counted the second years GDP using the first years fruit prices. Accounting for inflation.
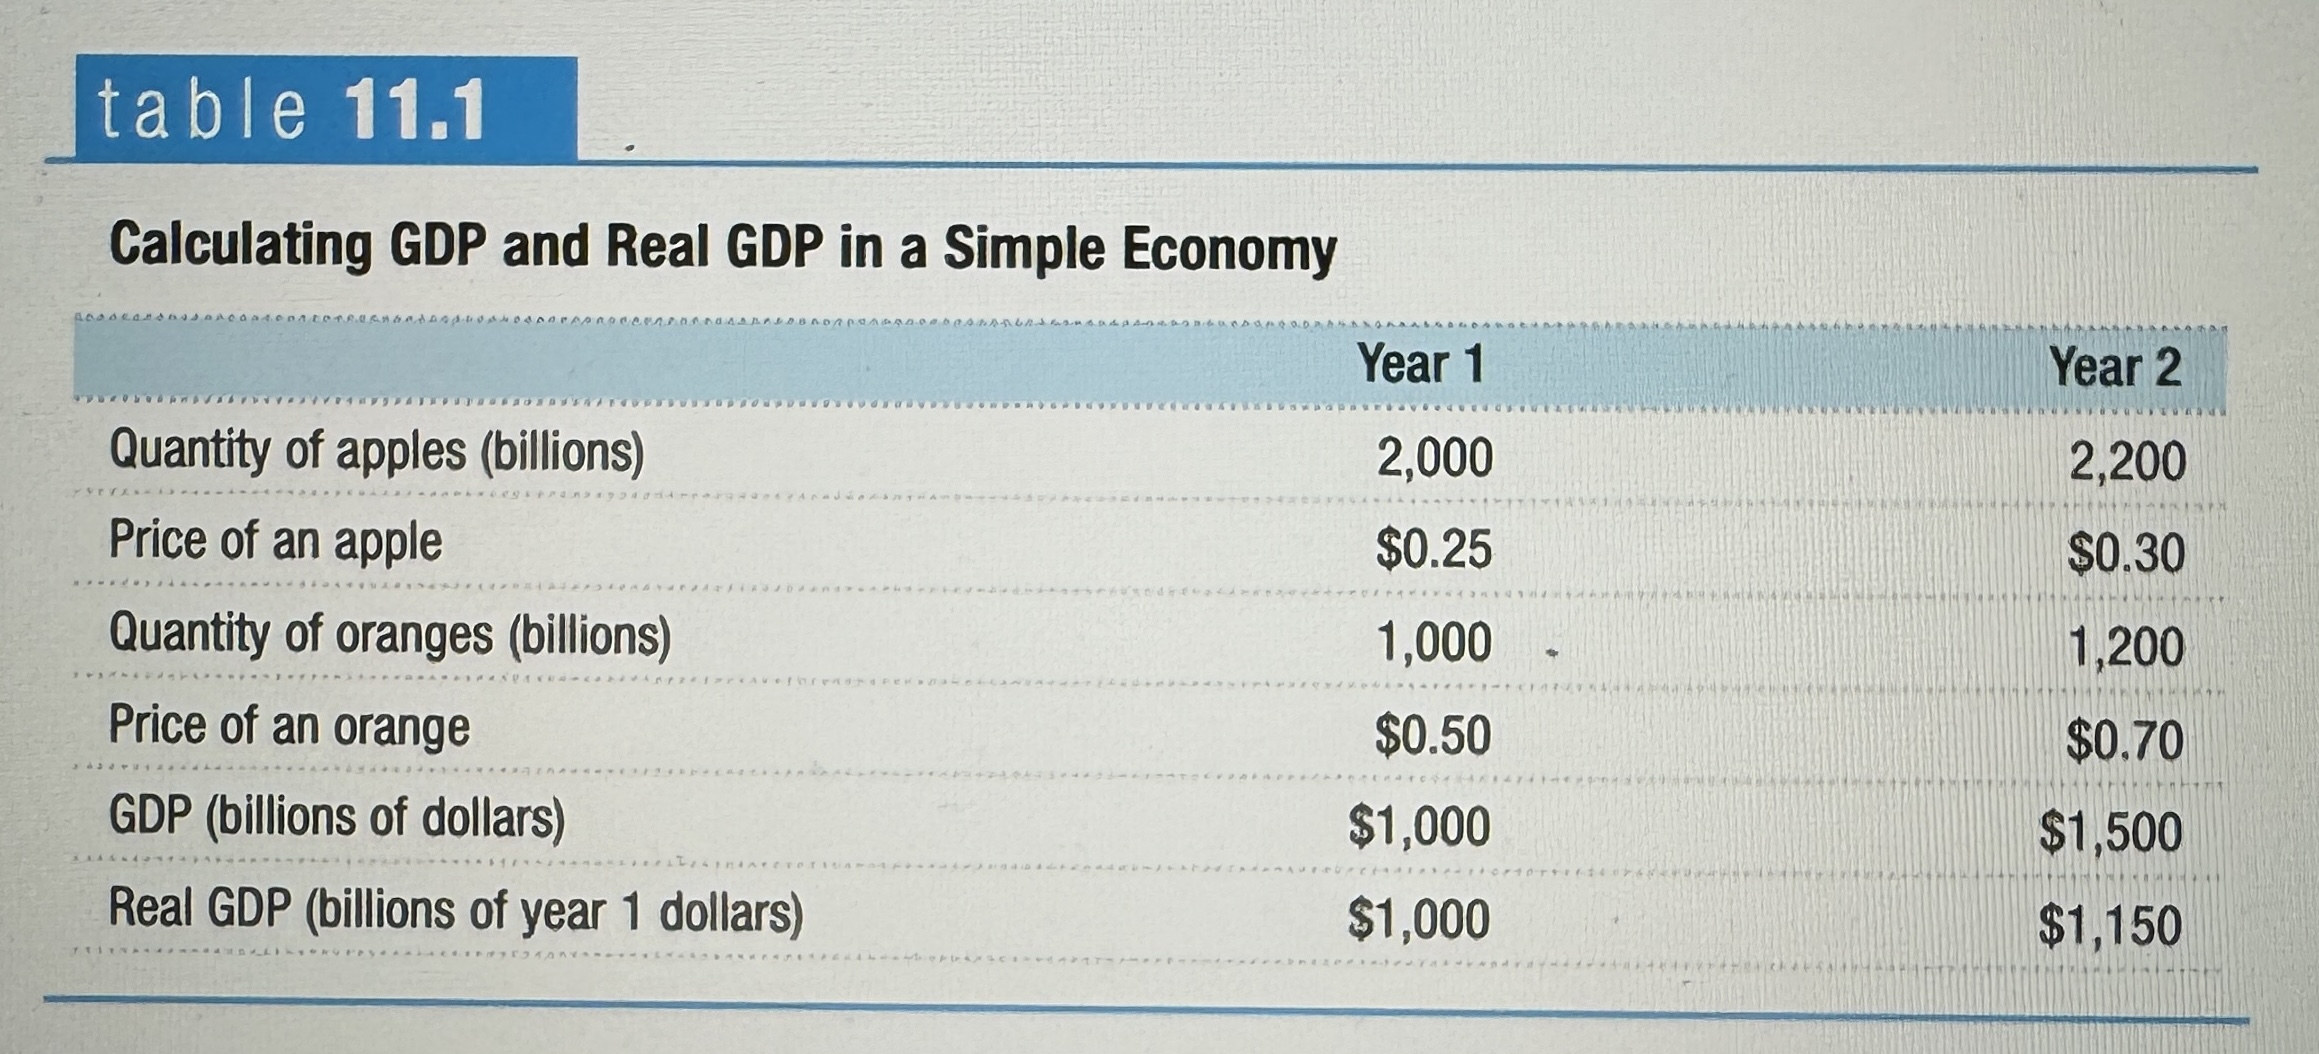
Real GDP
The total value of all final goods and services produced in the economy during a given year, however, it is calculated using the prices of a selected base year. So, it removes the factor of rising prices and instead picks the price of a product in a specific year.
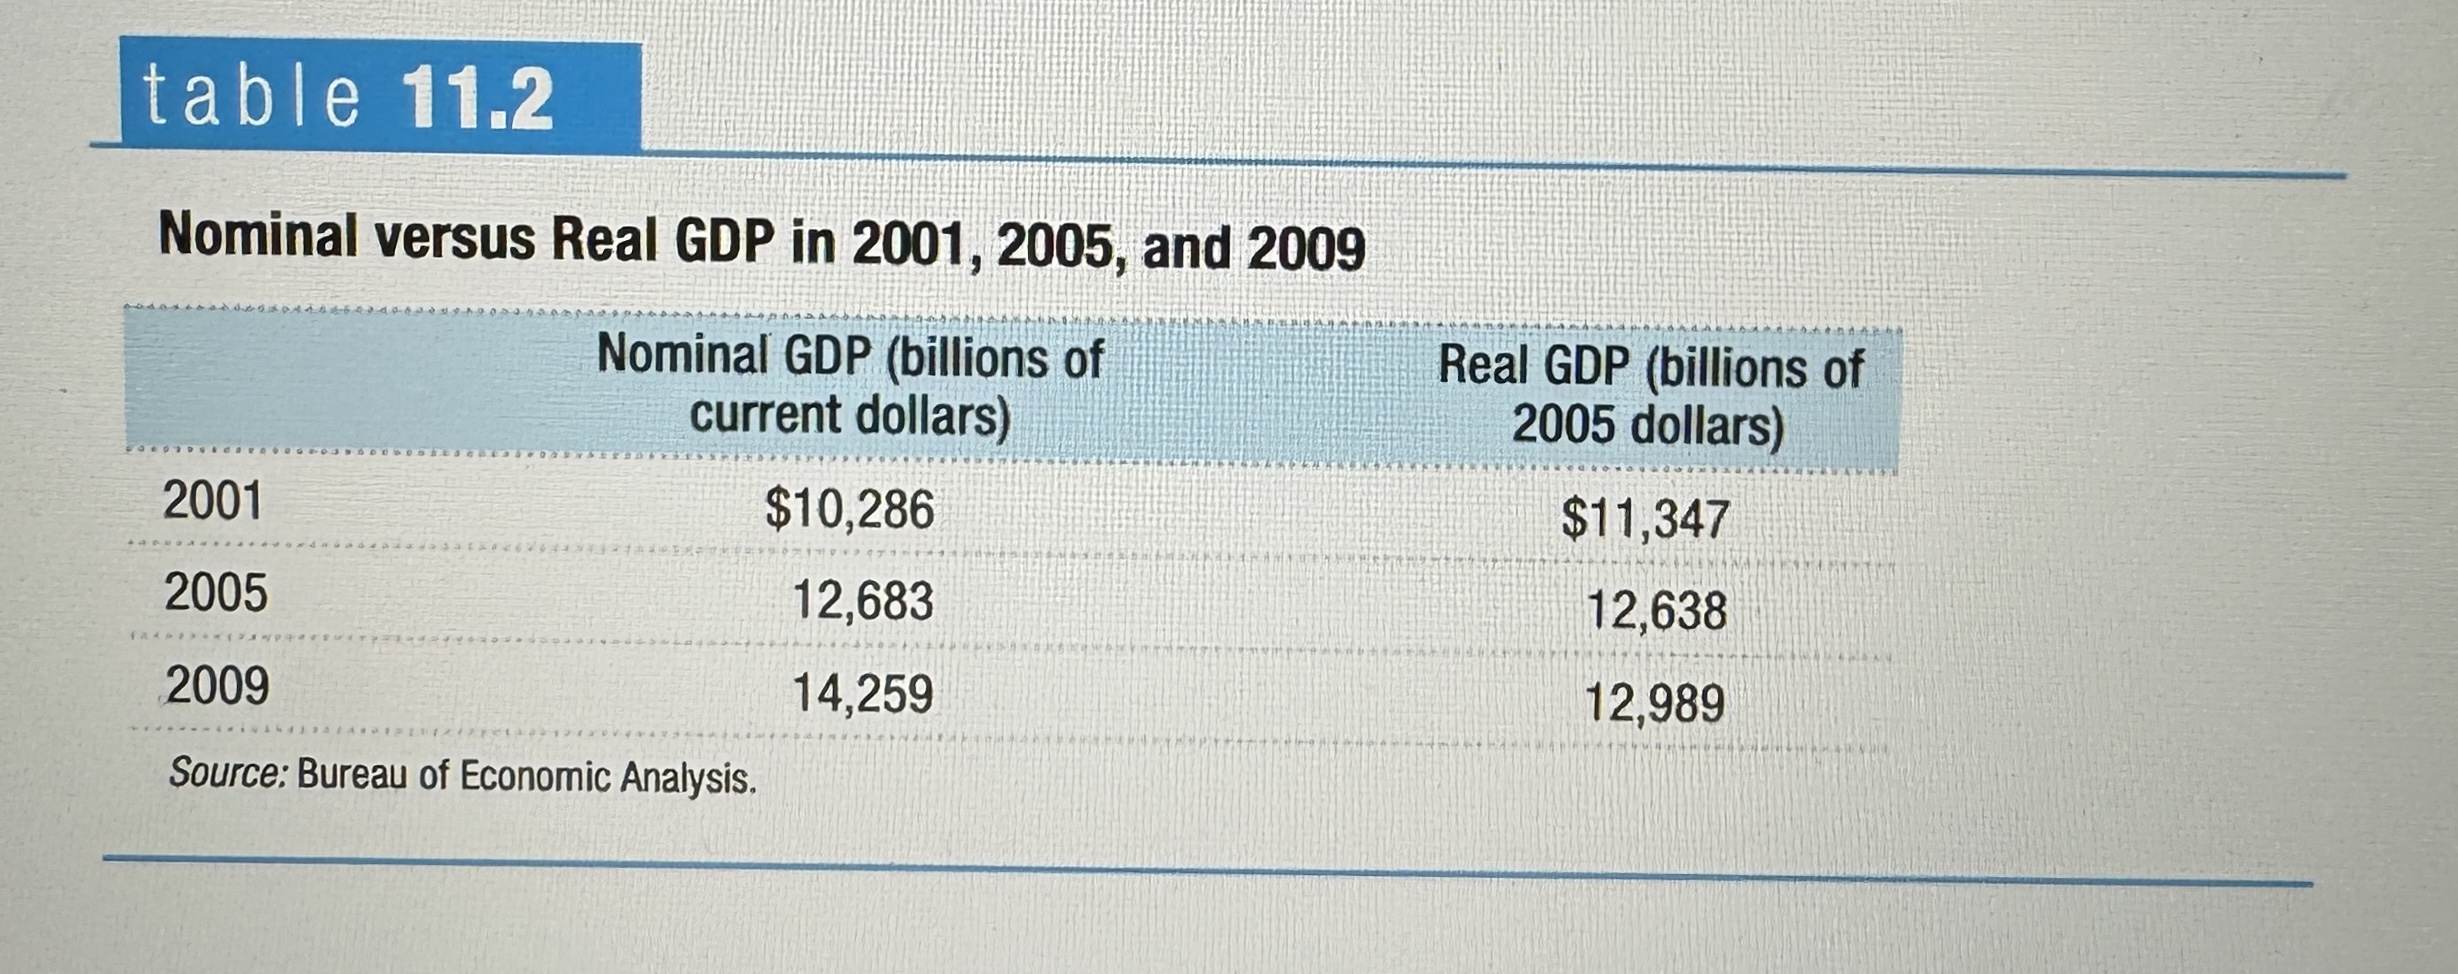
Nominal GDP
The total value of all final goods and services produced in the economy during a given year, calculated with the prices current in the year in which the output is produced. Doesn’t account for any rise in price, just uses the prices from the given year.
Nominal vs Real GDP
Ex.
Chain-linking
The method of calculating changes in real GDP using the average between the growth rate calculated using an early base year, and the growth rate calculated using a late base year. Instead of picking a single base year your averaging between a late and early one.
GDP per Captia
GDP divided by the size of the population; it is equivalent to the average GDP per person.
What can GDP not calculate?
The actual well-being of a country. It can’t show a measure of human welfare because all it is showing is the final gross domestic product itself.
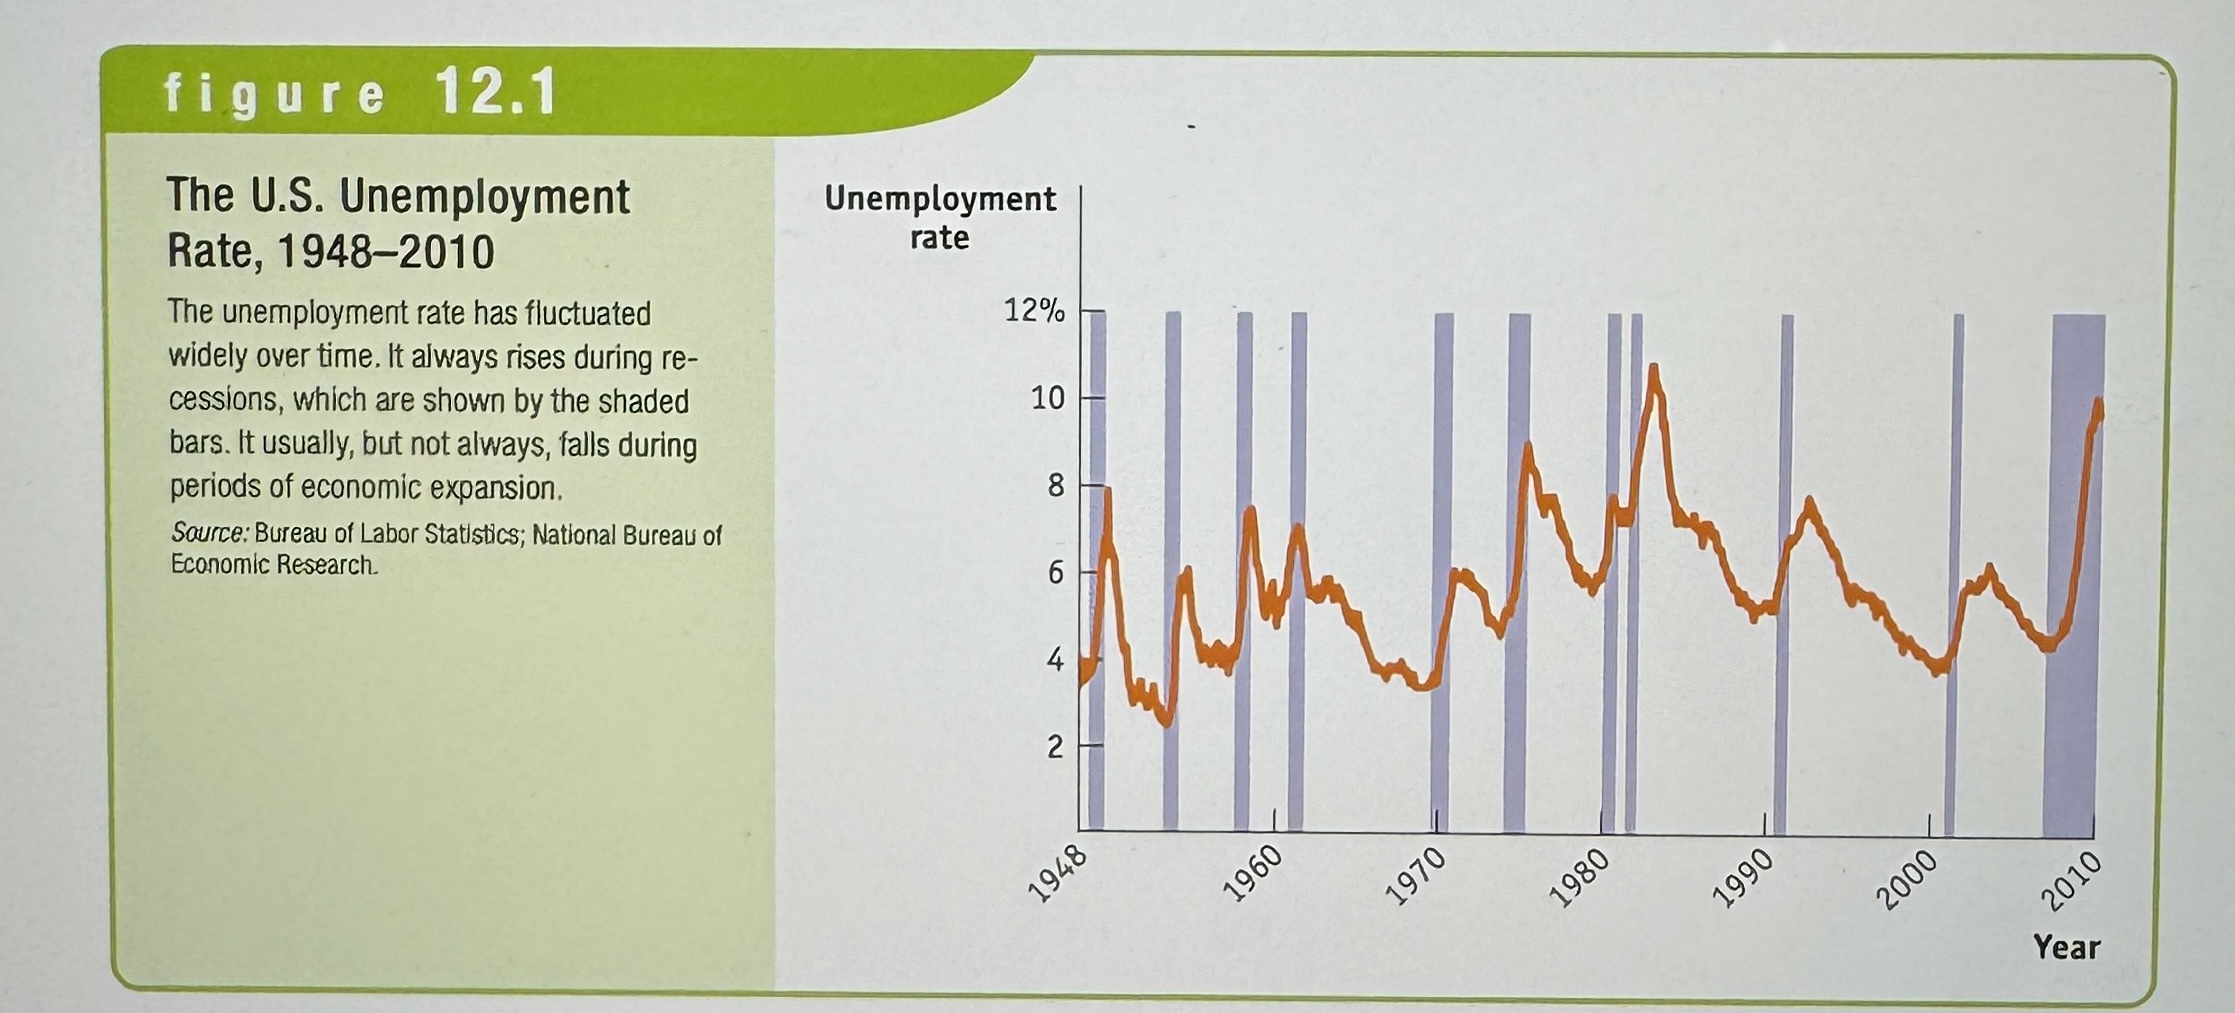
The U.S. Unemployment Rate
Ex.
Employed
People who are currently holding a job in the economy, either full-time or part-time.
Unemployed
People who are actively looking for work, but aren’t currently employed.
Labor Force
Equal to the sum of the employed and the unemployed.
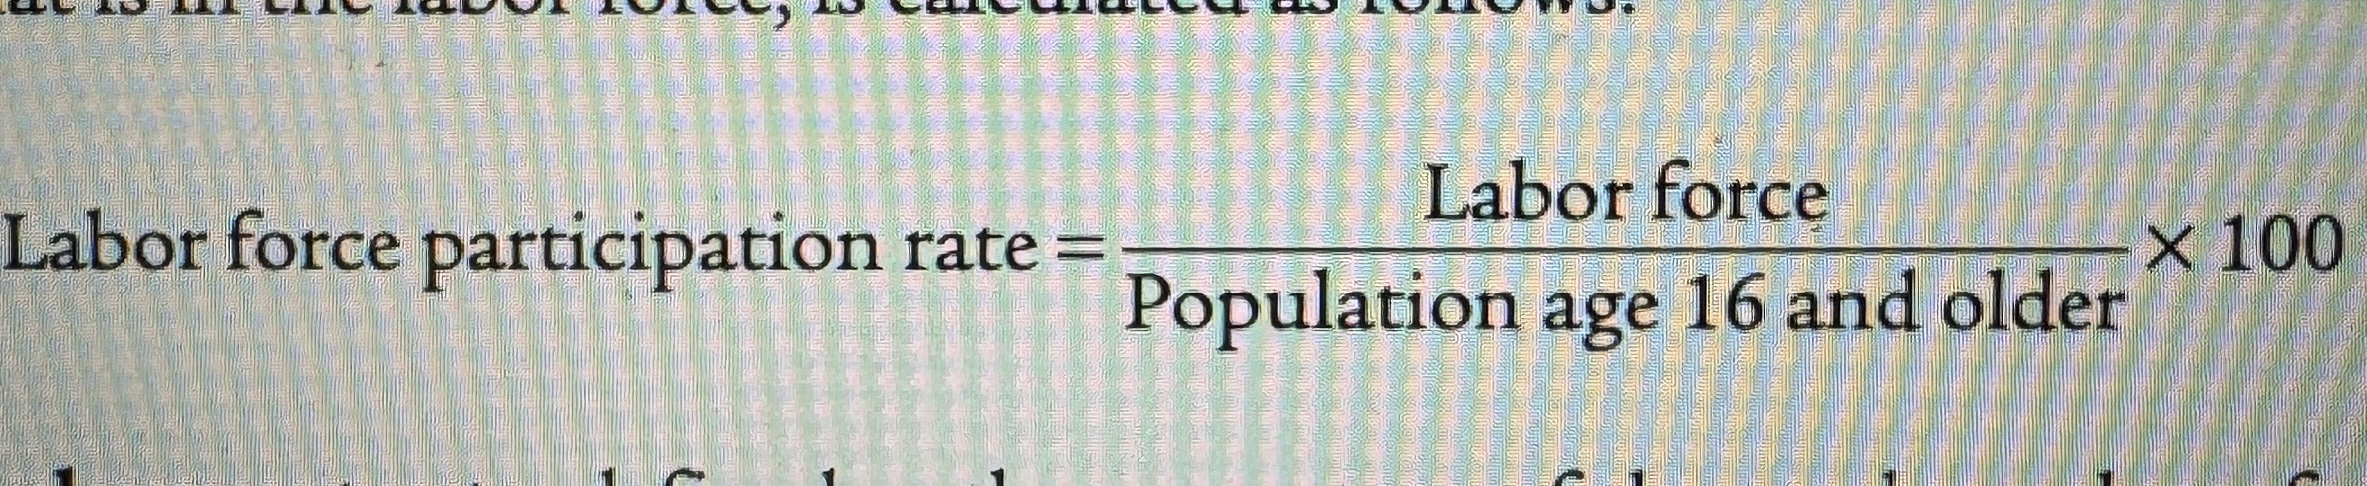
Labor Force Participation Rate
The percentage of the population aged 16 or older that is in the labor force.
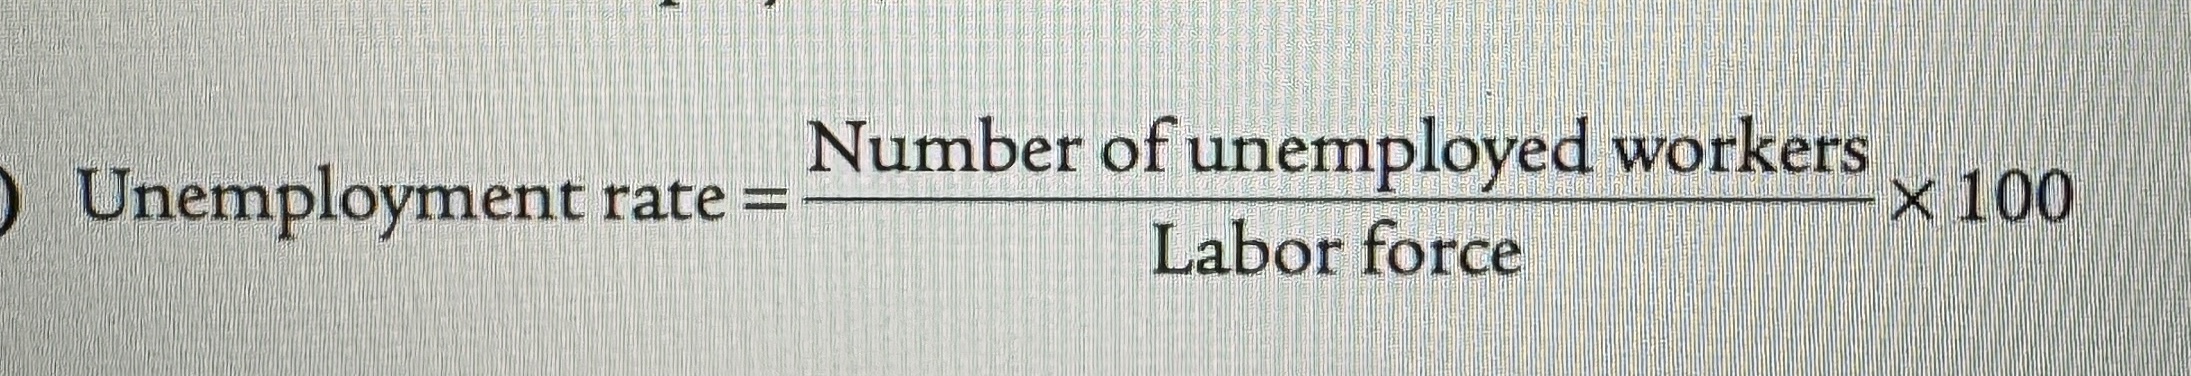
Unemployment Rate
The percentage of the total number of people in the labor force who are unemployed.
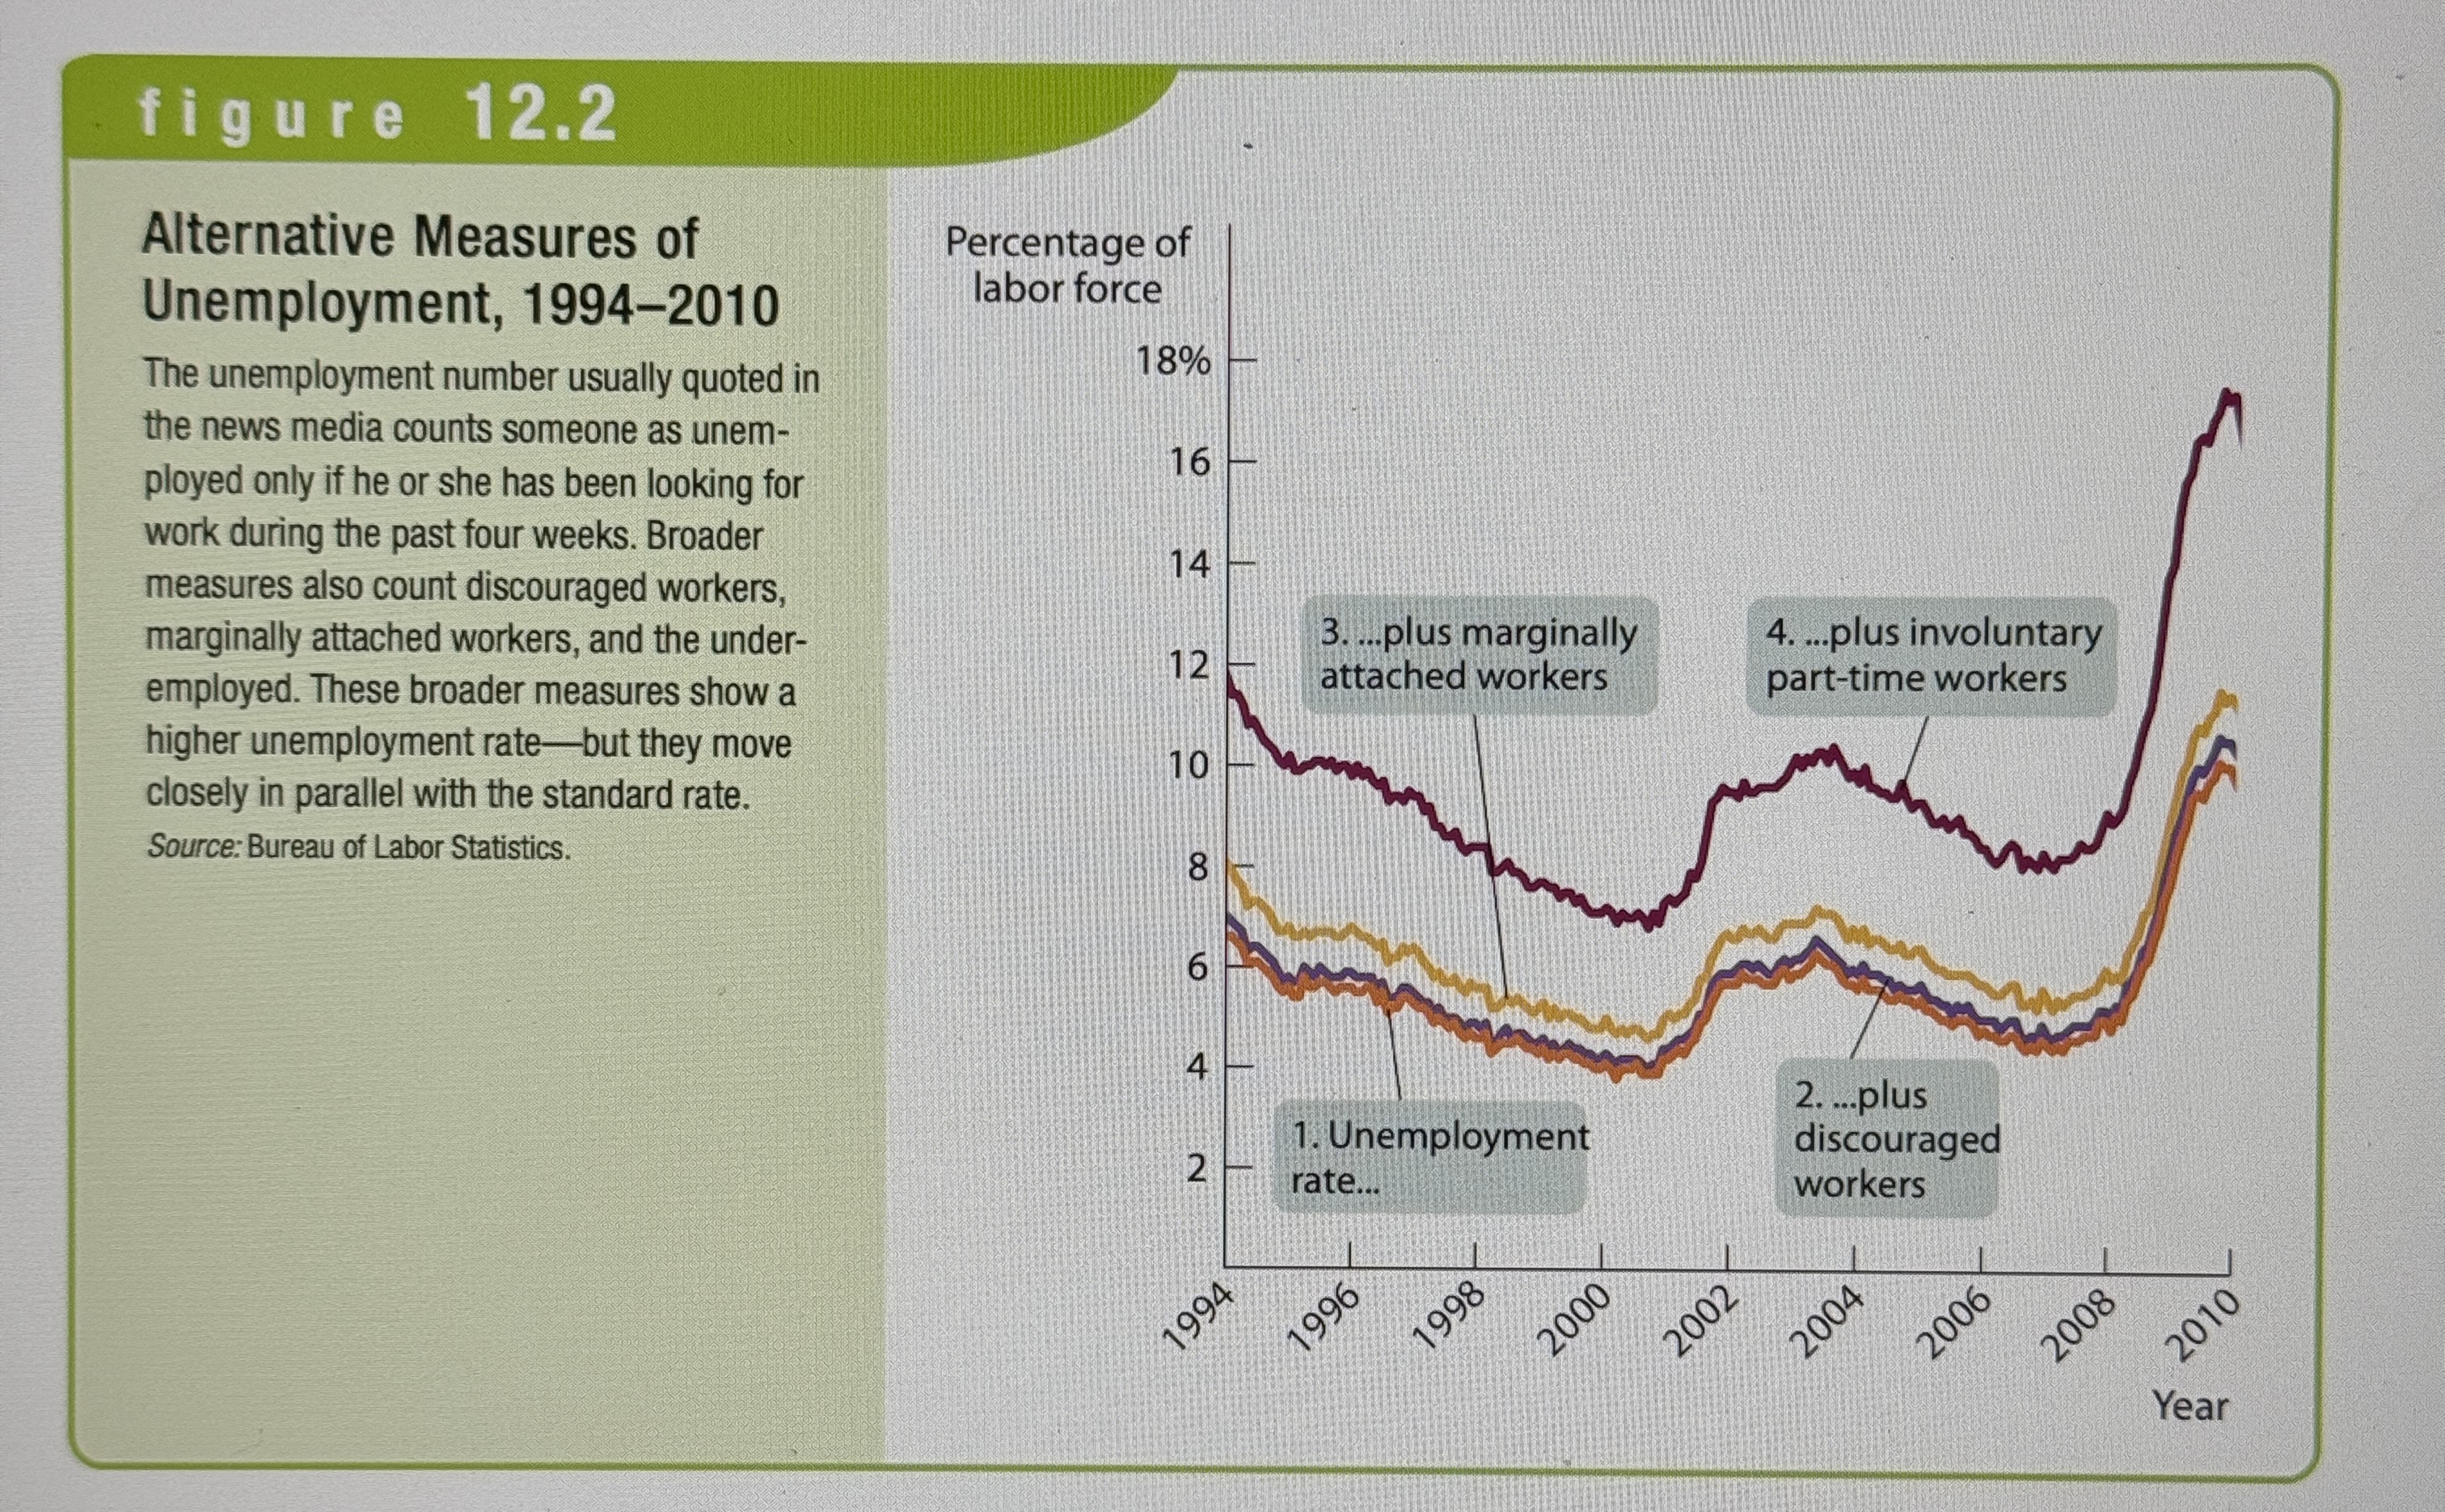
Discouraged Workers
Nonworking people who are capable of working but have given up looking for a job due to the state of the job market. Not counted in unemployment rate.
Marginally attached workers
Would like to be employed and have looked for a job in the recent past, but are not currently looking for work. Also not counted in unemployment.
Underemployed
People who work part-time because they cannot find full-time jobs, they’re overqualified.
Alternative Measures of Unemployment
Ex.
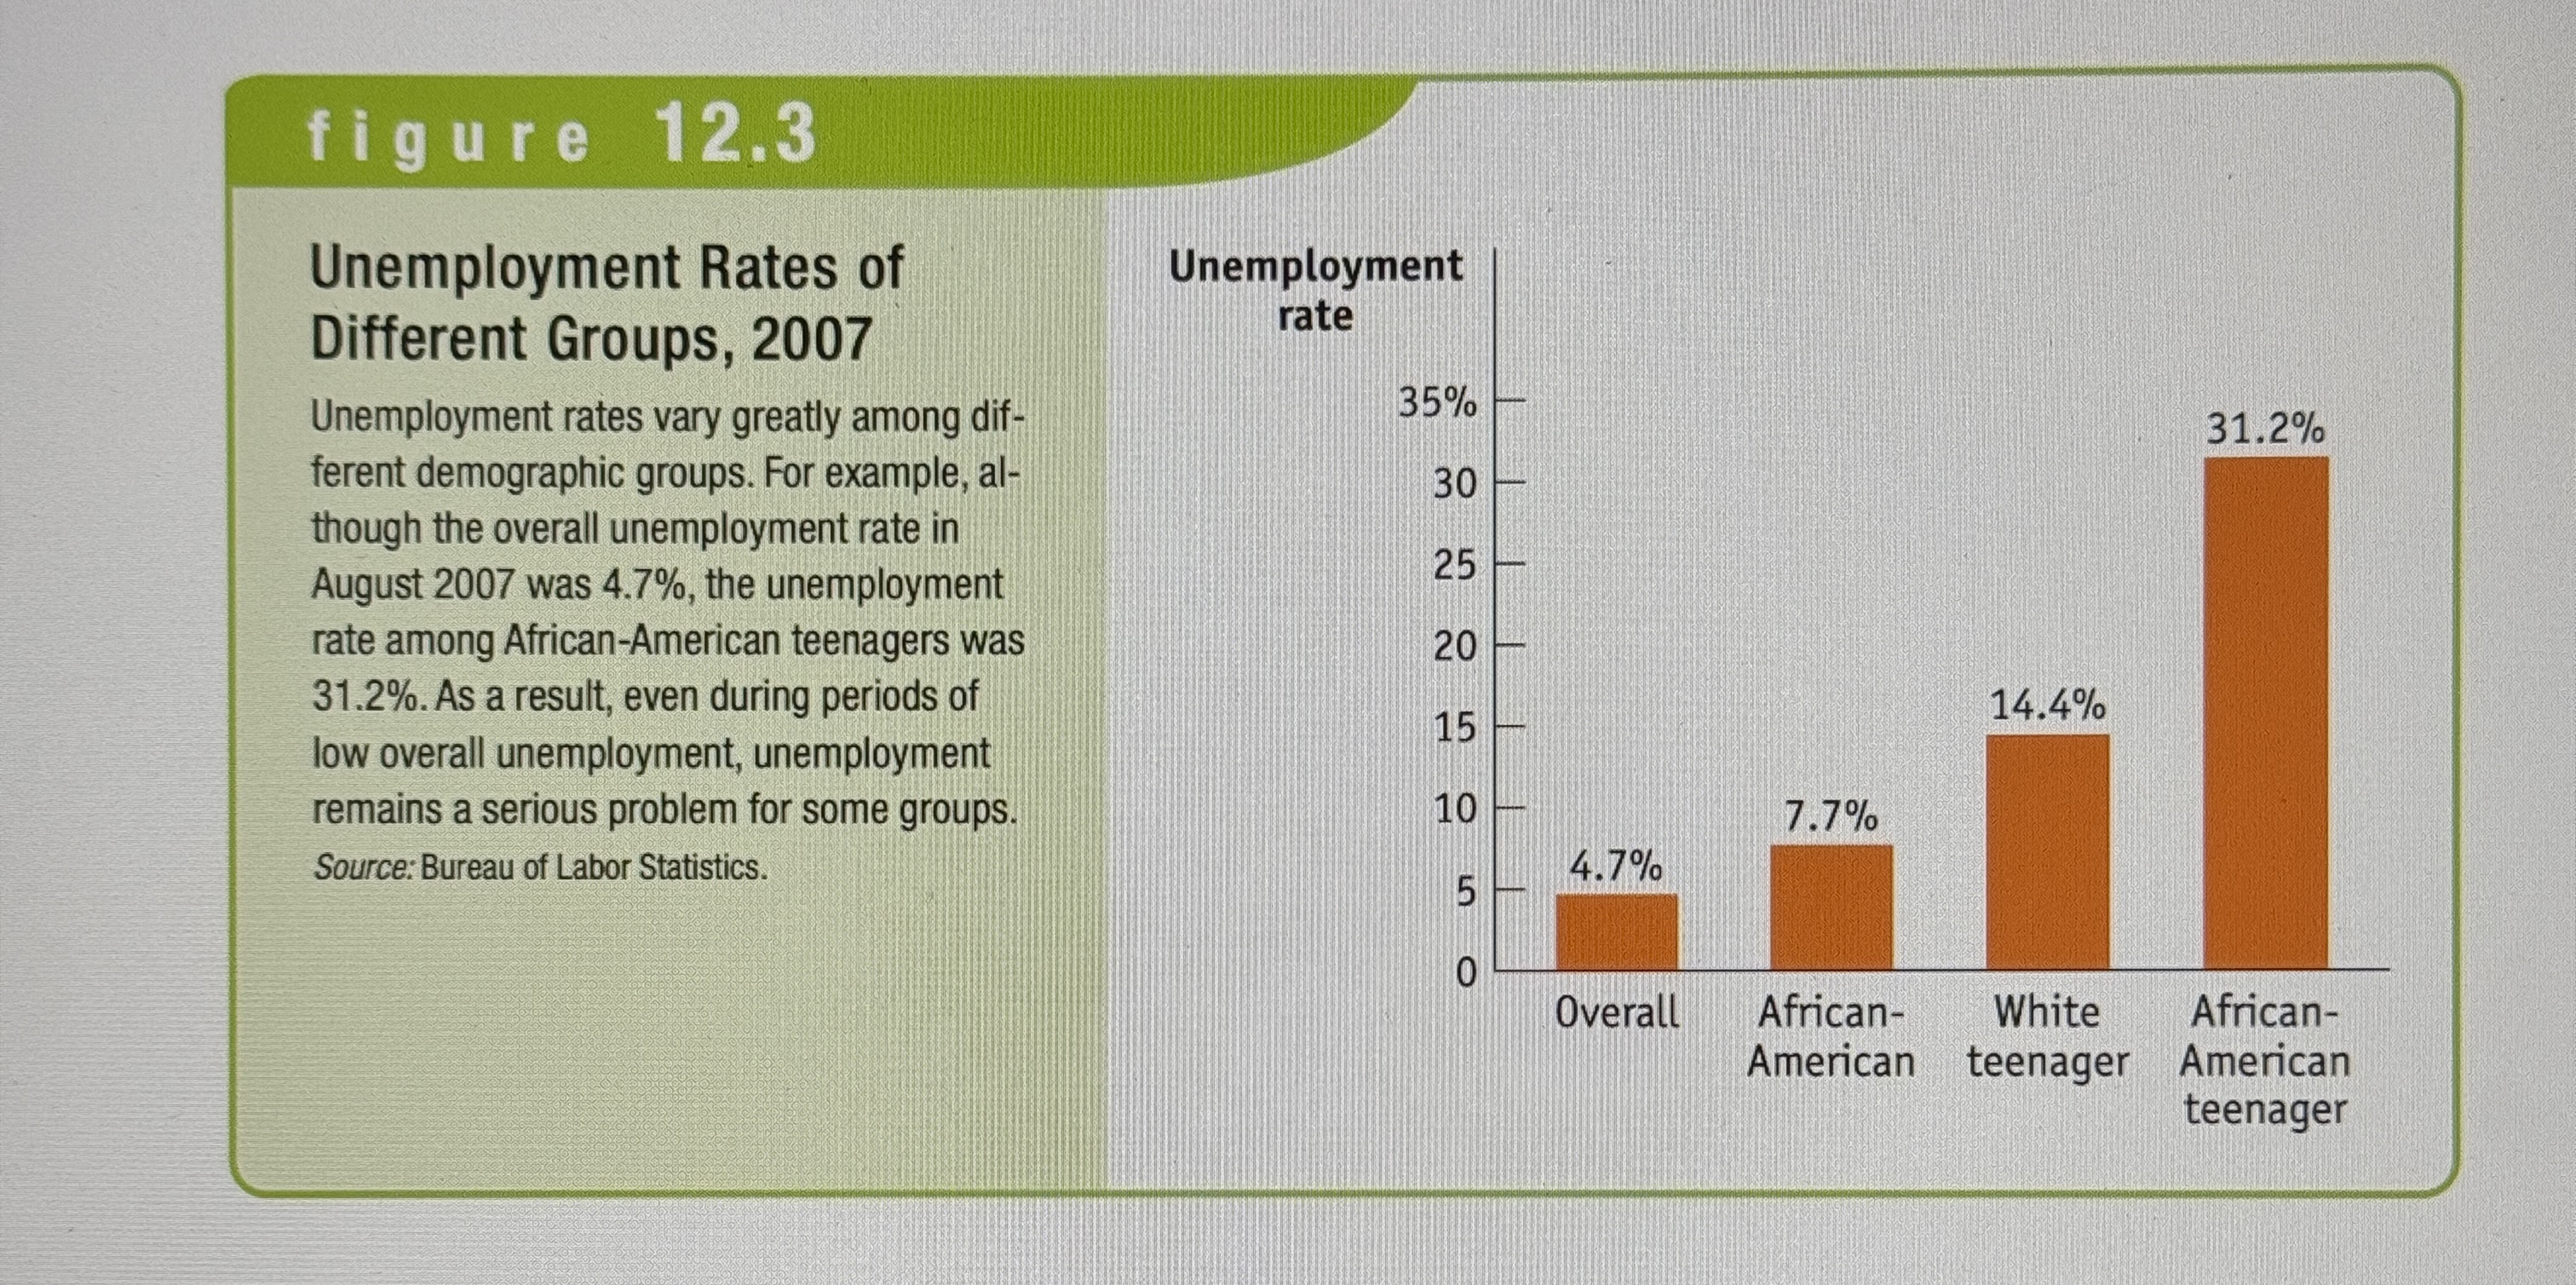
Unemployment in different Groups
Ex.
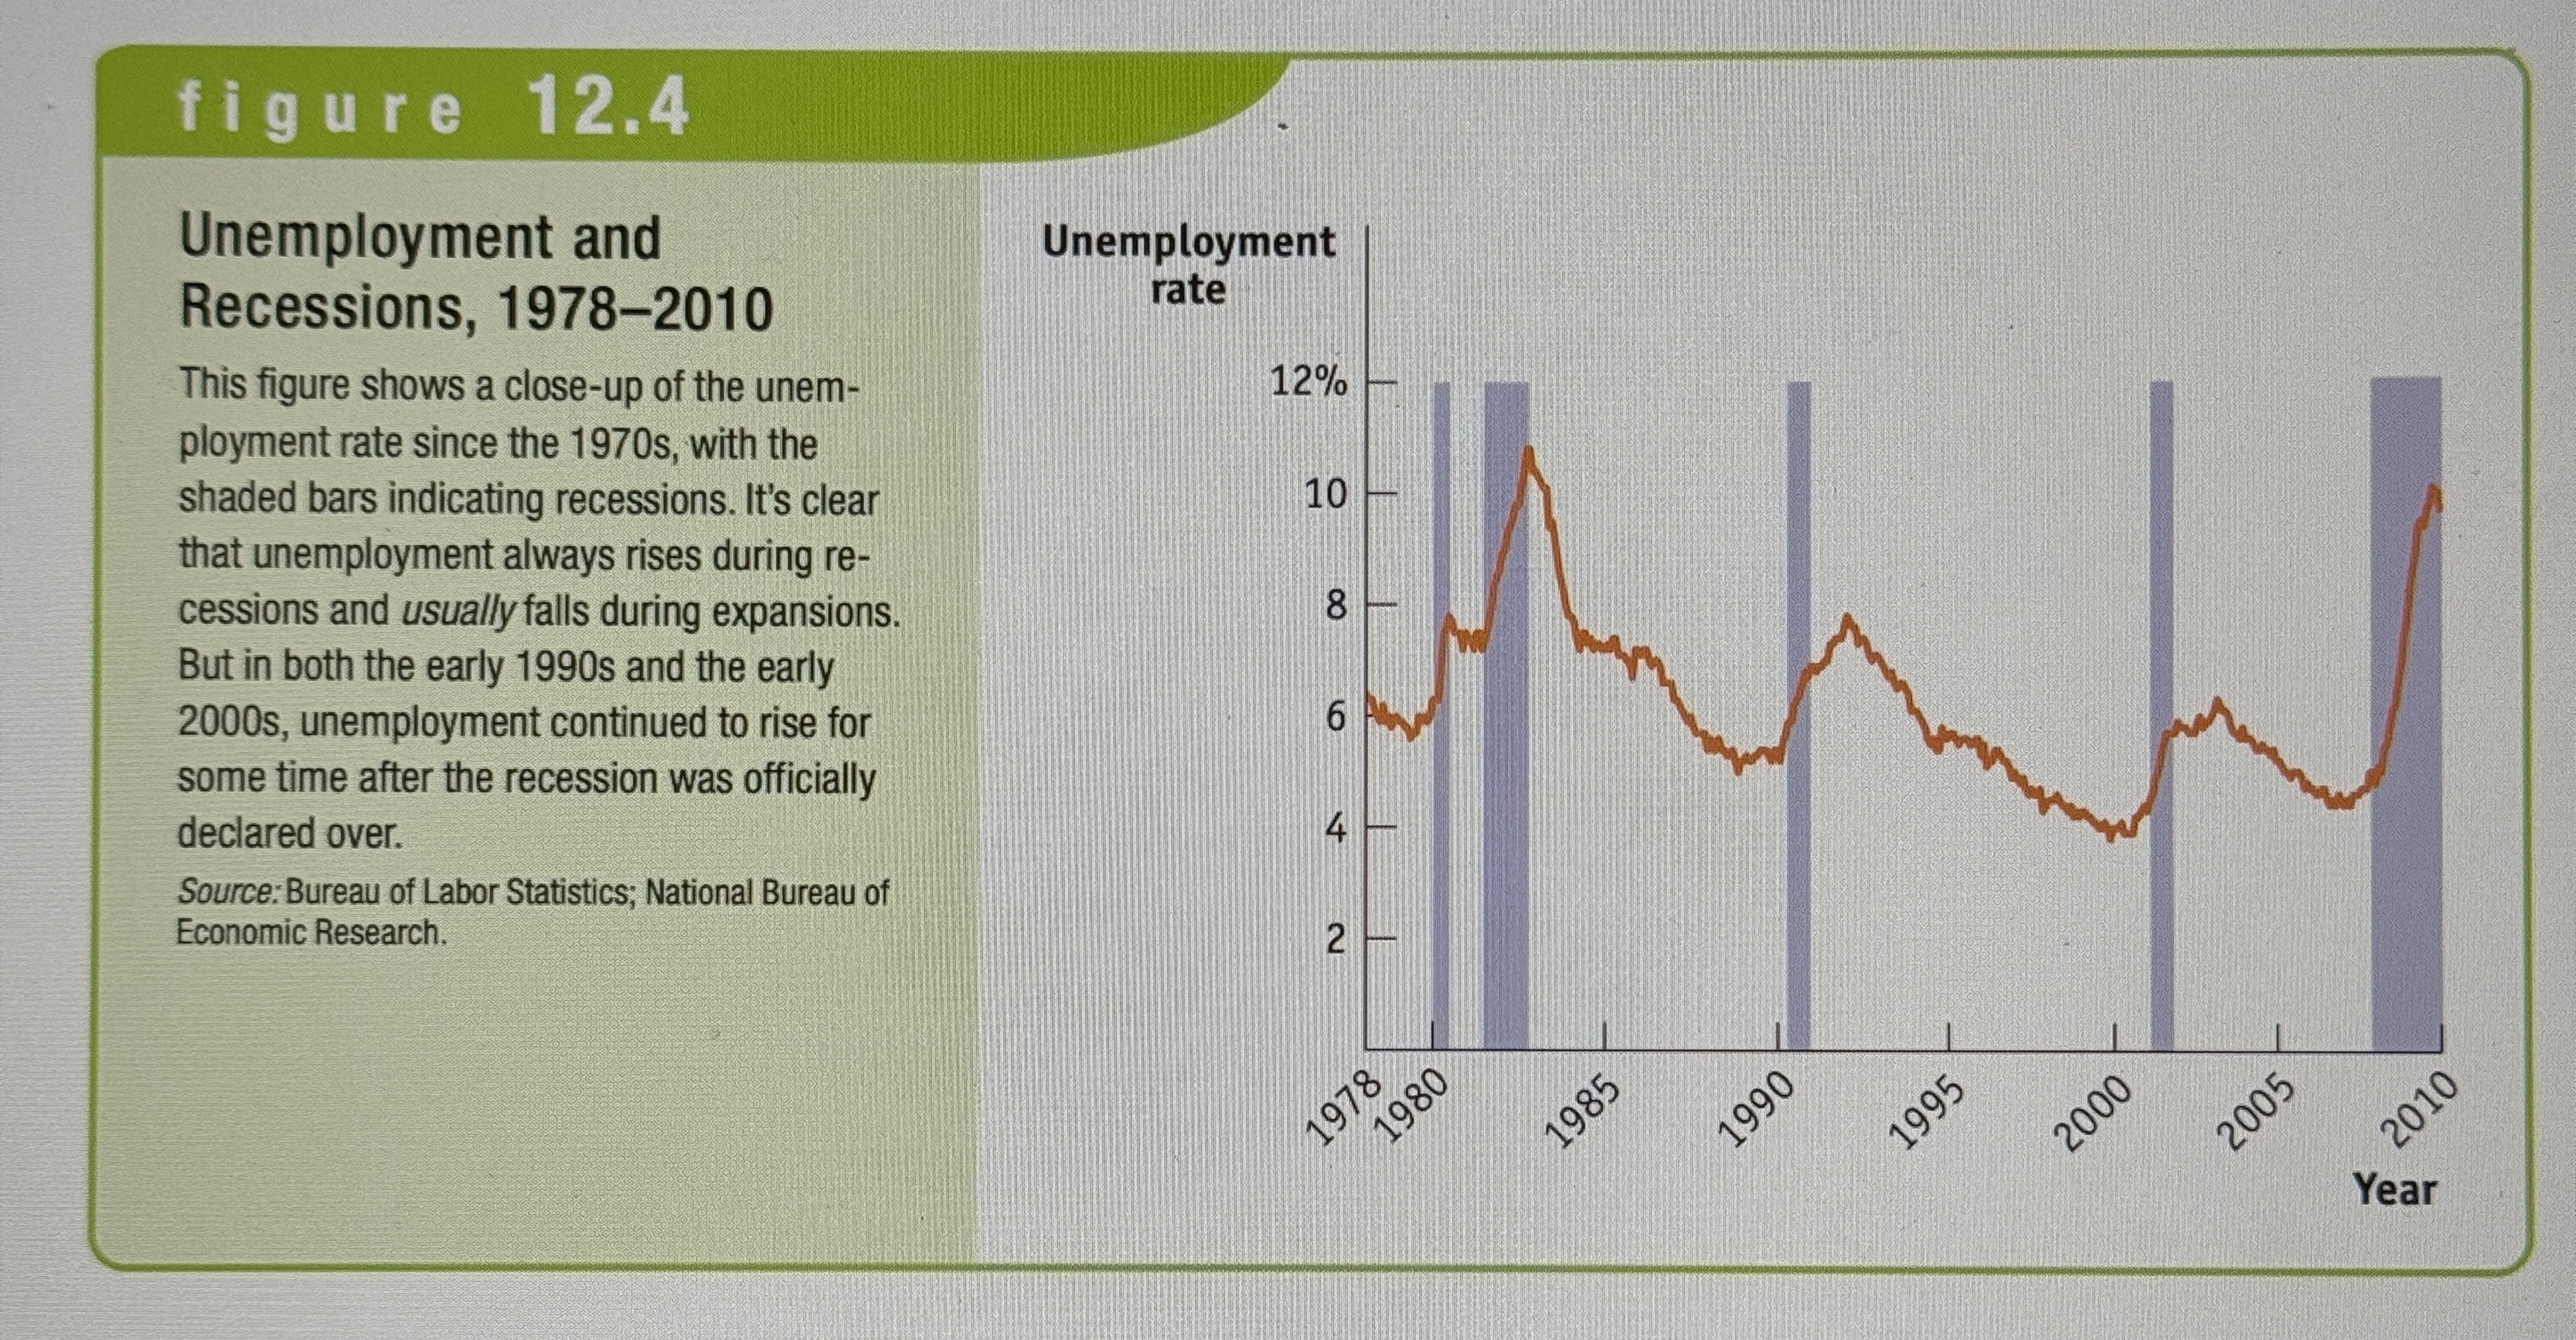
Unemployment and Recessions
Ex.
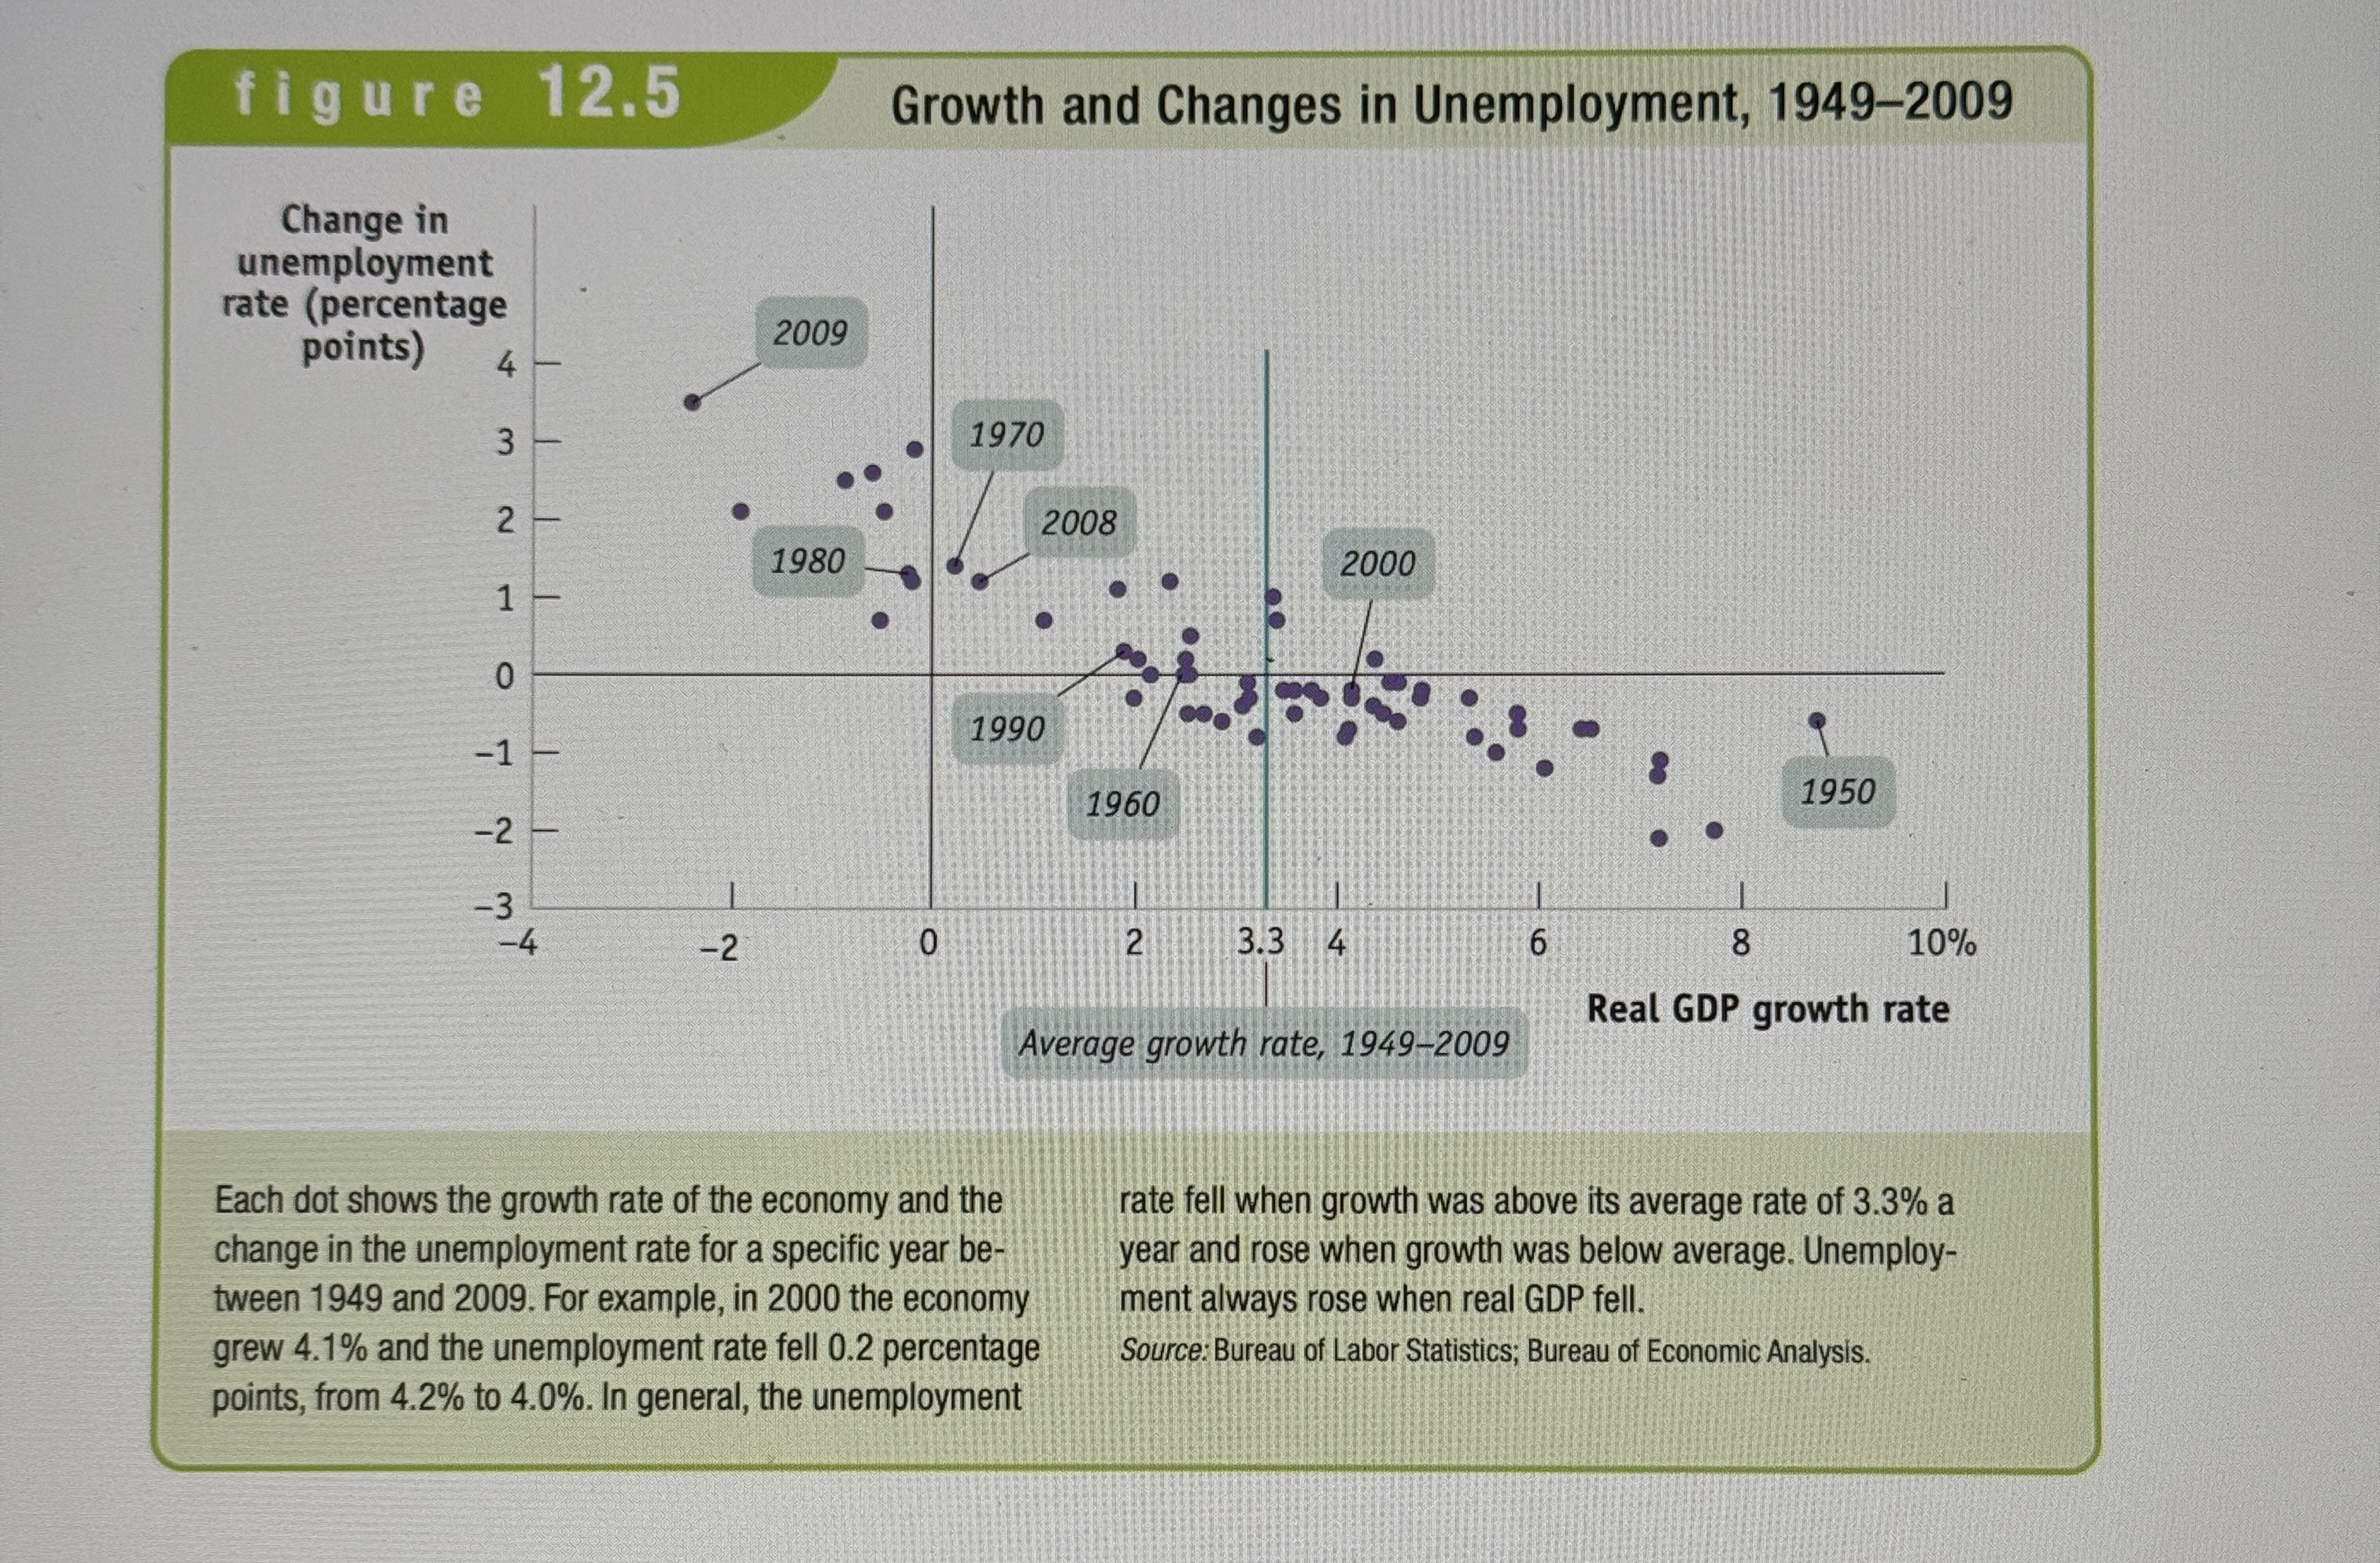
Growth and Changes in Unemployment
Ex.
Job Search
Workers who are looking for employment are engaged in job search.
Frictional Unemployment
Unemployment due to the time workers spend in job search.
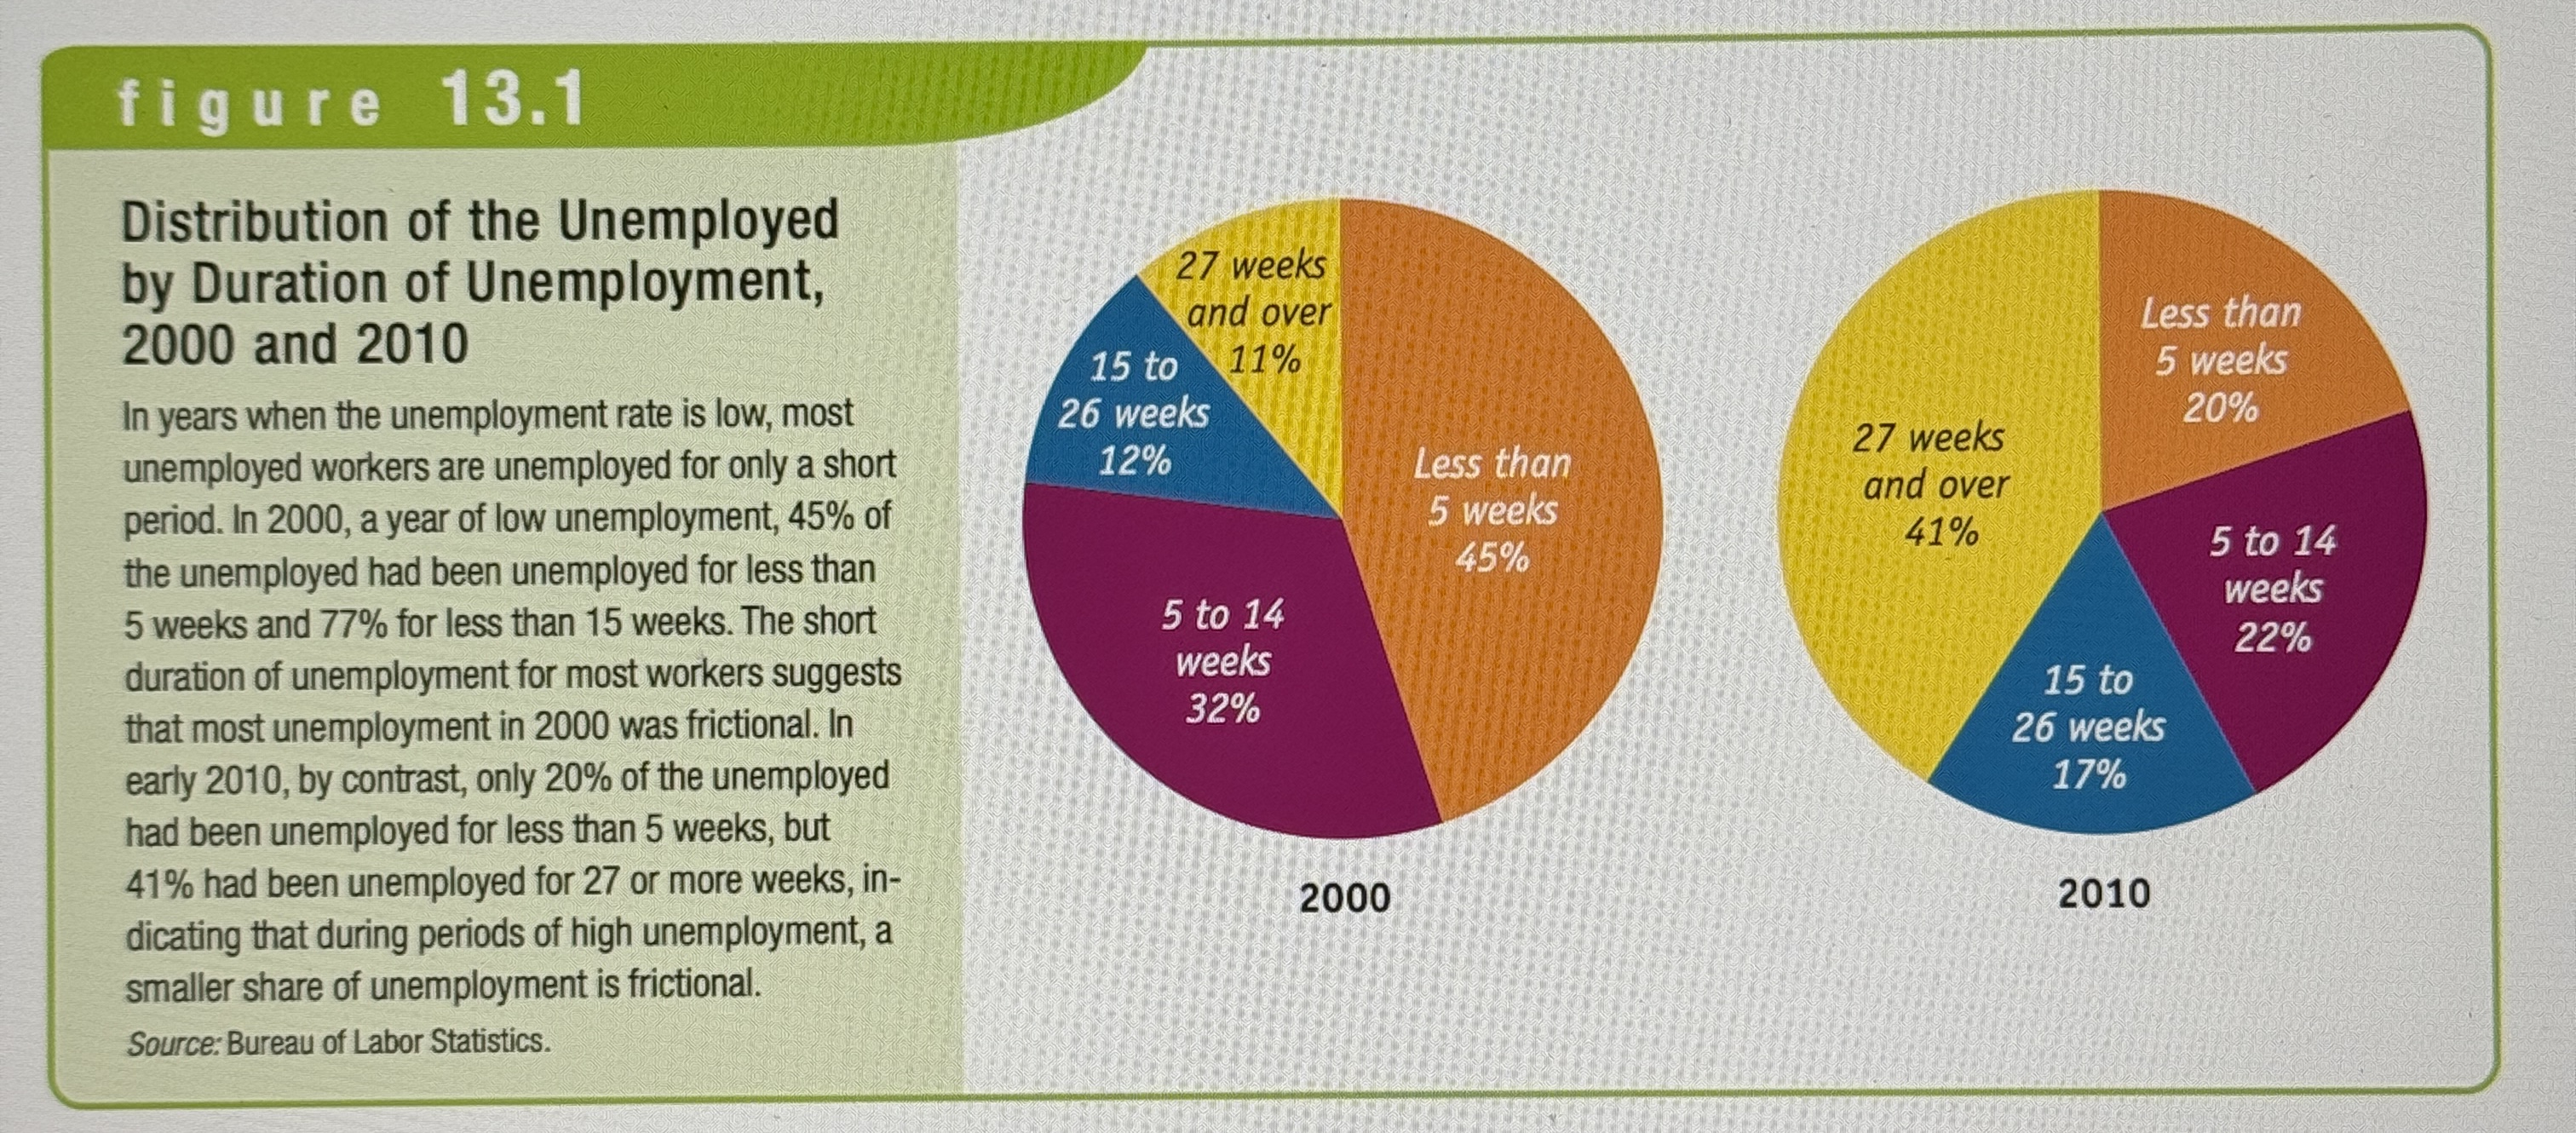
Distribution of the Unemployed by Duration
Ex.
Structural Unemployment
Unemployment that results when there are more people seeking jobs in the labor market than there are jobs available at the current wage rate.
The Effect of Minimum Wage on the Labor Market
Ex.
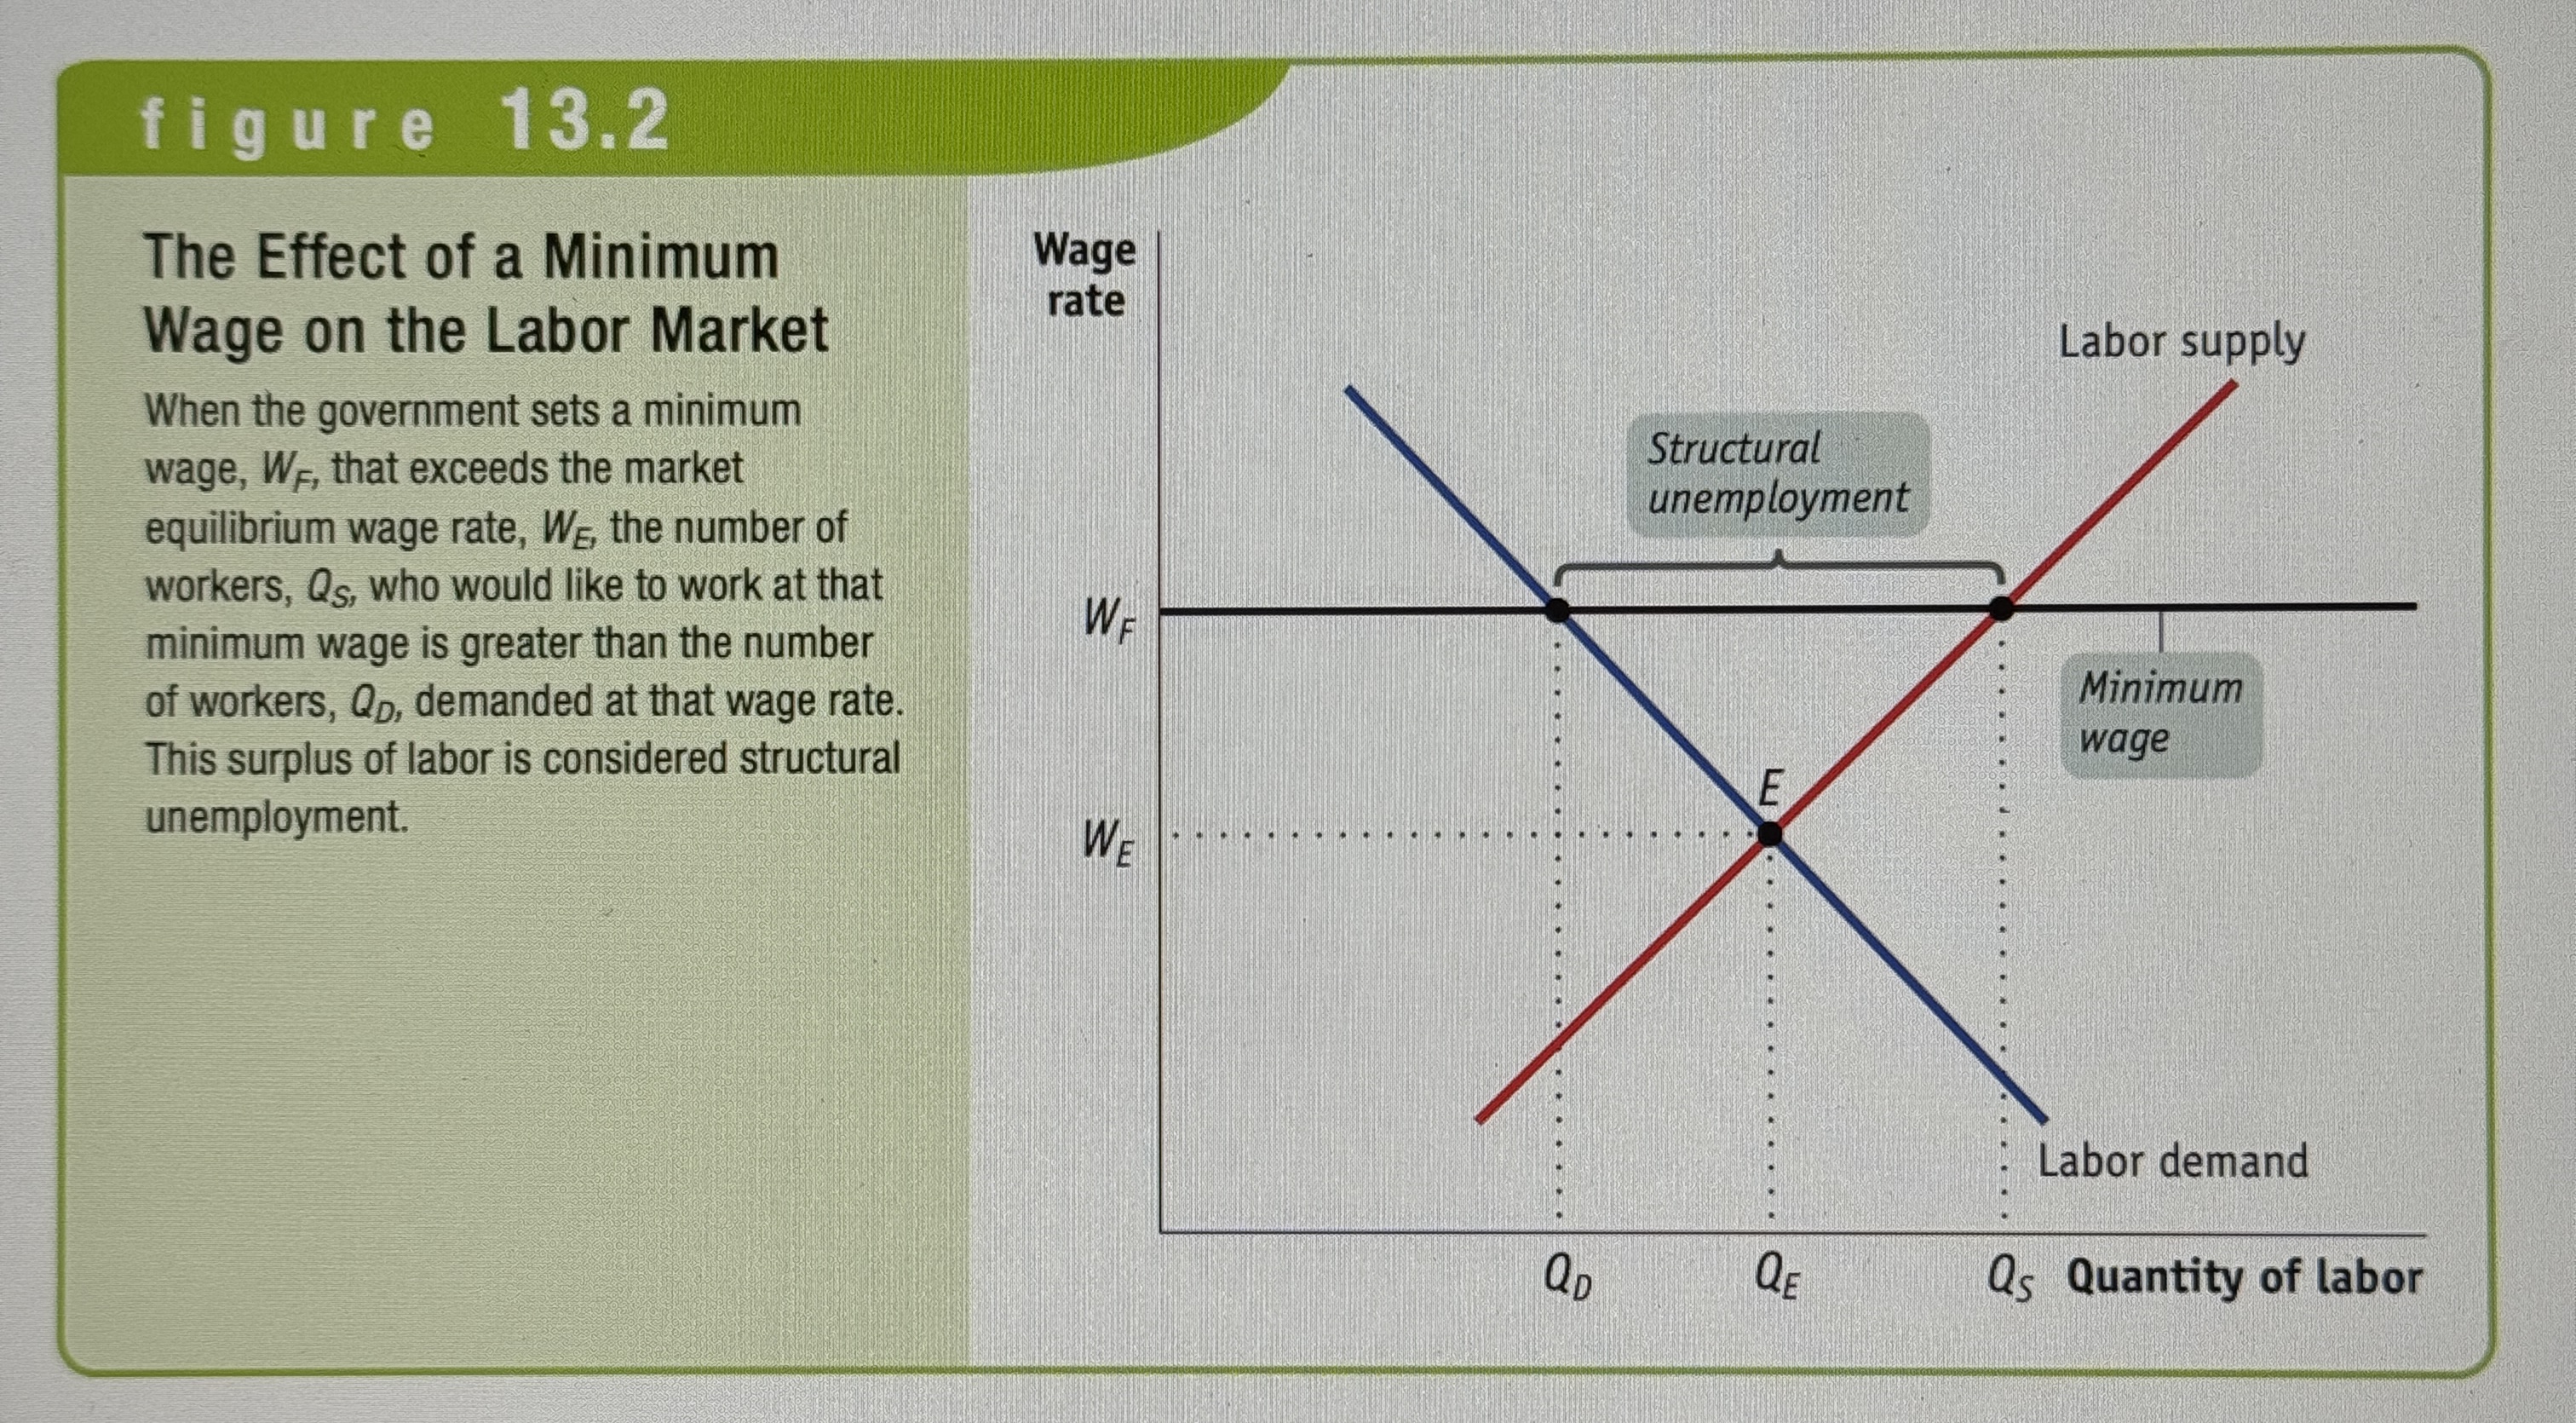
How does minimum wage effect unemployment?
It increases structural unemployment since there becomes more labor supply then actual labor demanded.
How do labor unions effect unemployment?
Labor unions also lead to more structural unemployment since often labor unions advocate for higher wages or benefits. This creates a higher labor supply then the demand creating the structural unemployment.
Efficiency Wages
Wages that employers set above the equilibrium wage rate as an incentive for better employee performance. These also often create structural unemployment.
How does public policy effect unemployment?
Public policy designed to help workers who lose their jobs can lead to structural unemployment as an unintended side effect.
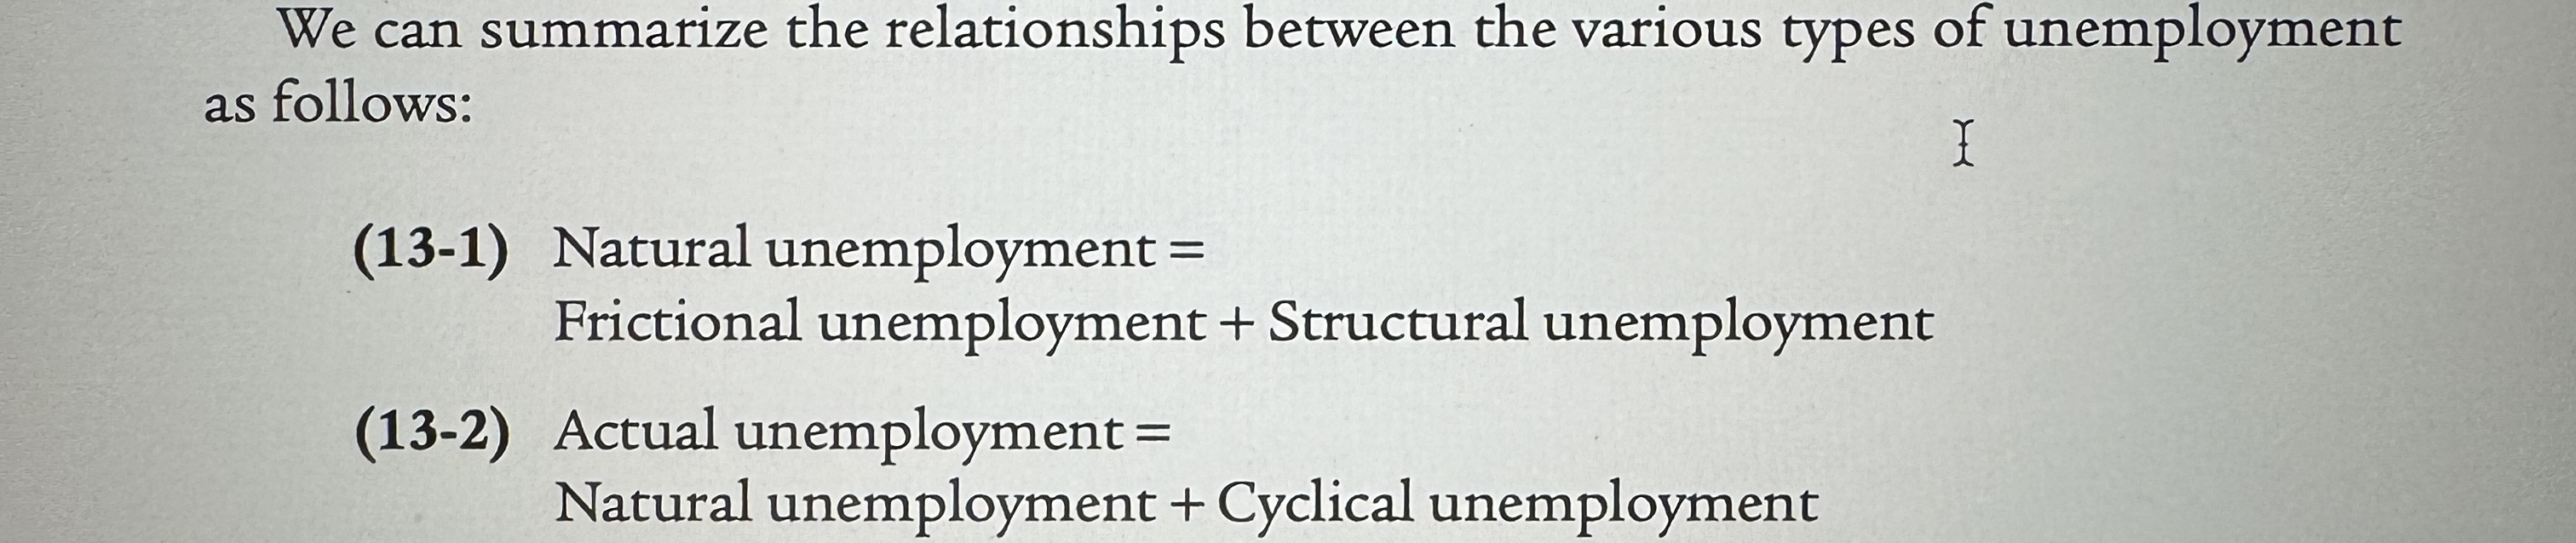
The Natural Rate of unemployment
The unemployment rate that arises from the effects of frictional plus structural unemployment.
Cyclical Unemployment
The deviation of the actual rate of unemployment from the natural rate. This is the share of unemployment that arises from the business cycle.
Natural and Actual Unemployment
Ex.
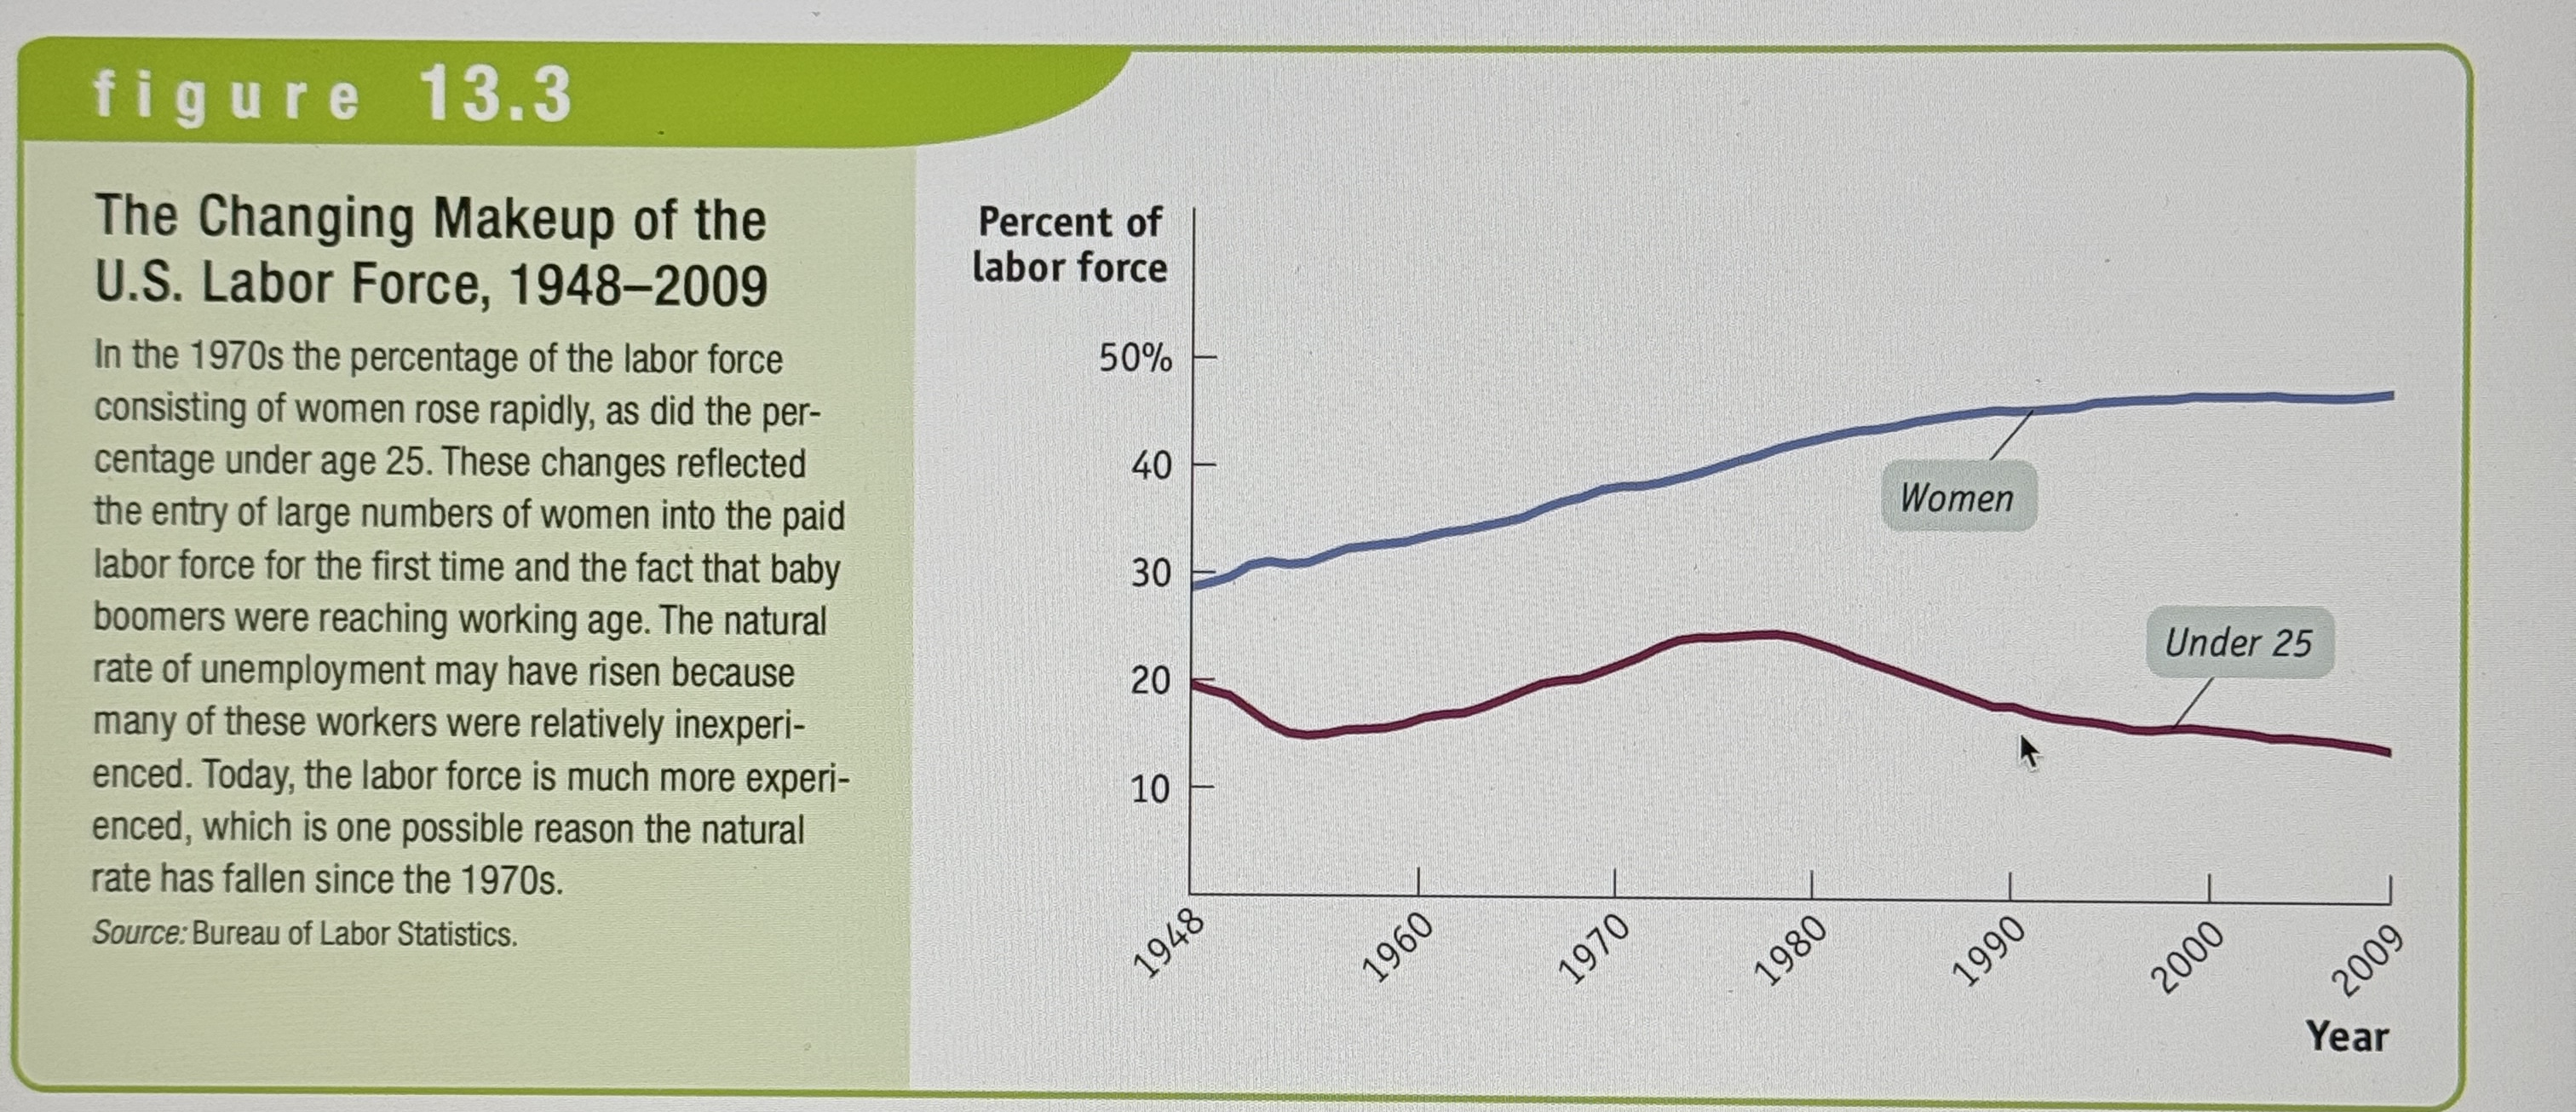
The Changing Makeup of the U.S. Labor Force
Ex.
Real Wage
The wage rate divided by the price level.
Real Income
Income divided by the price level.
Inflation Rate
The inflation rate is the percent change per year in a price index – typically the consumer price index.
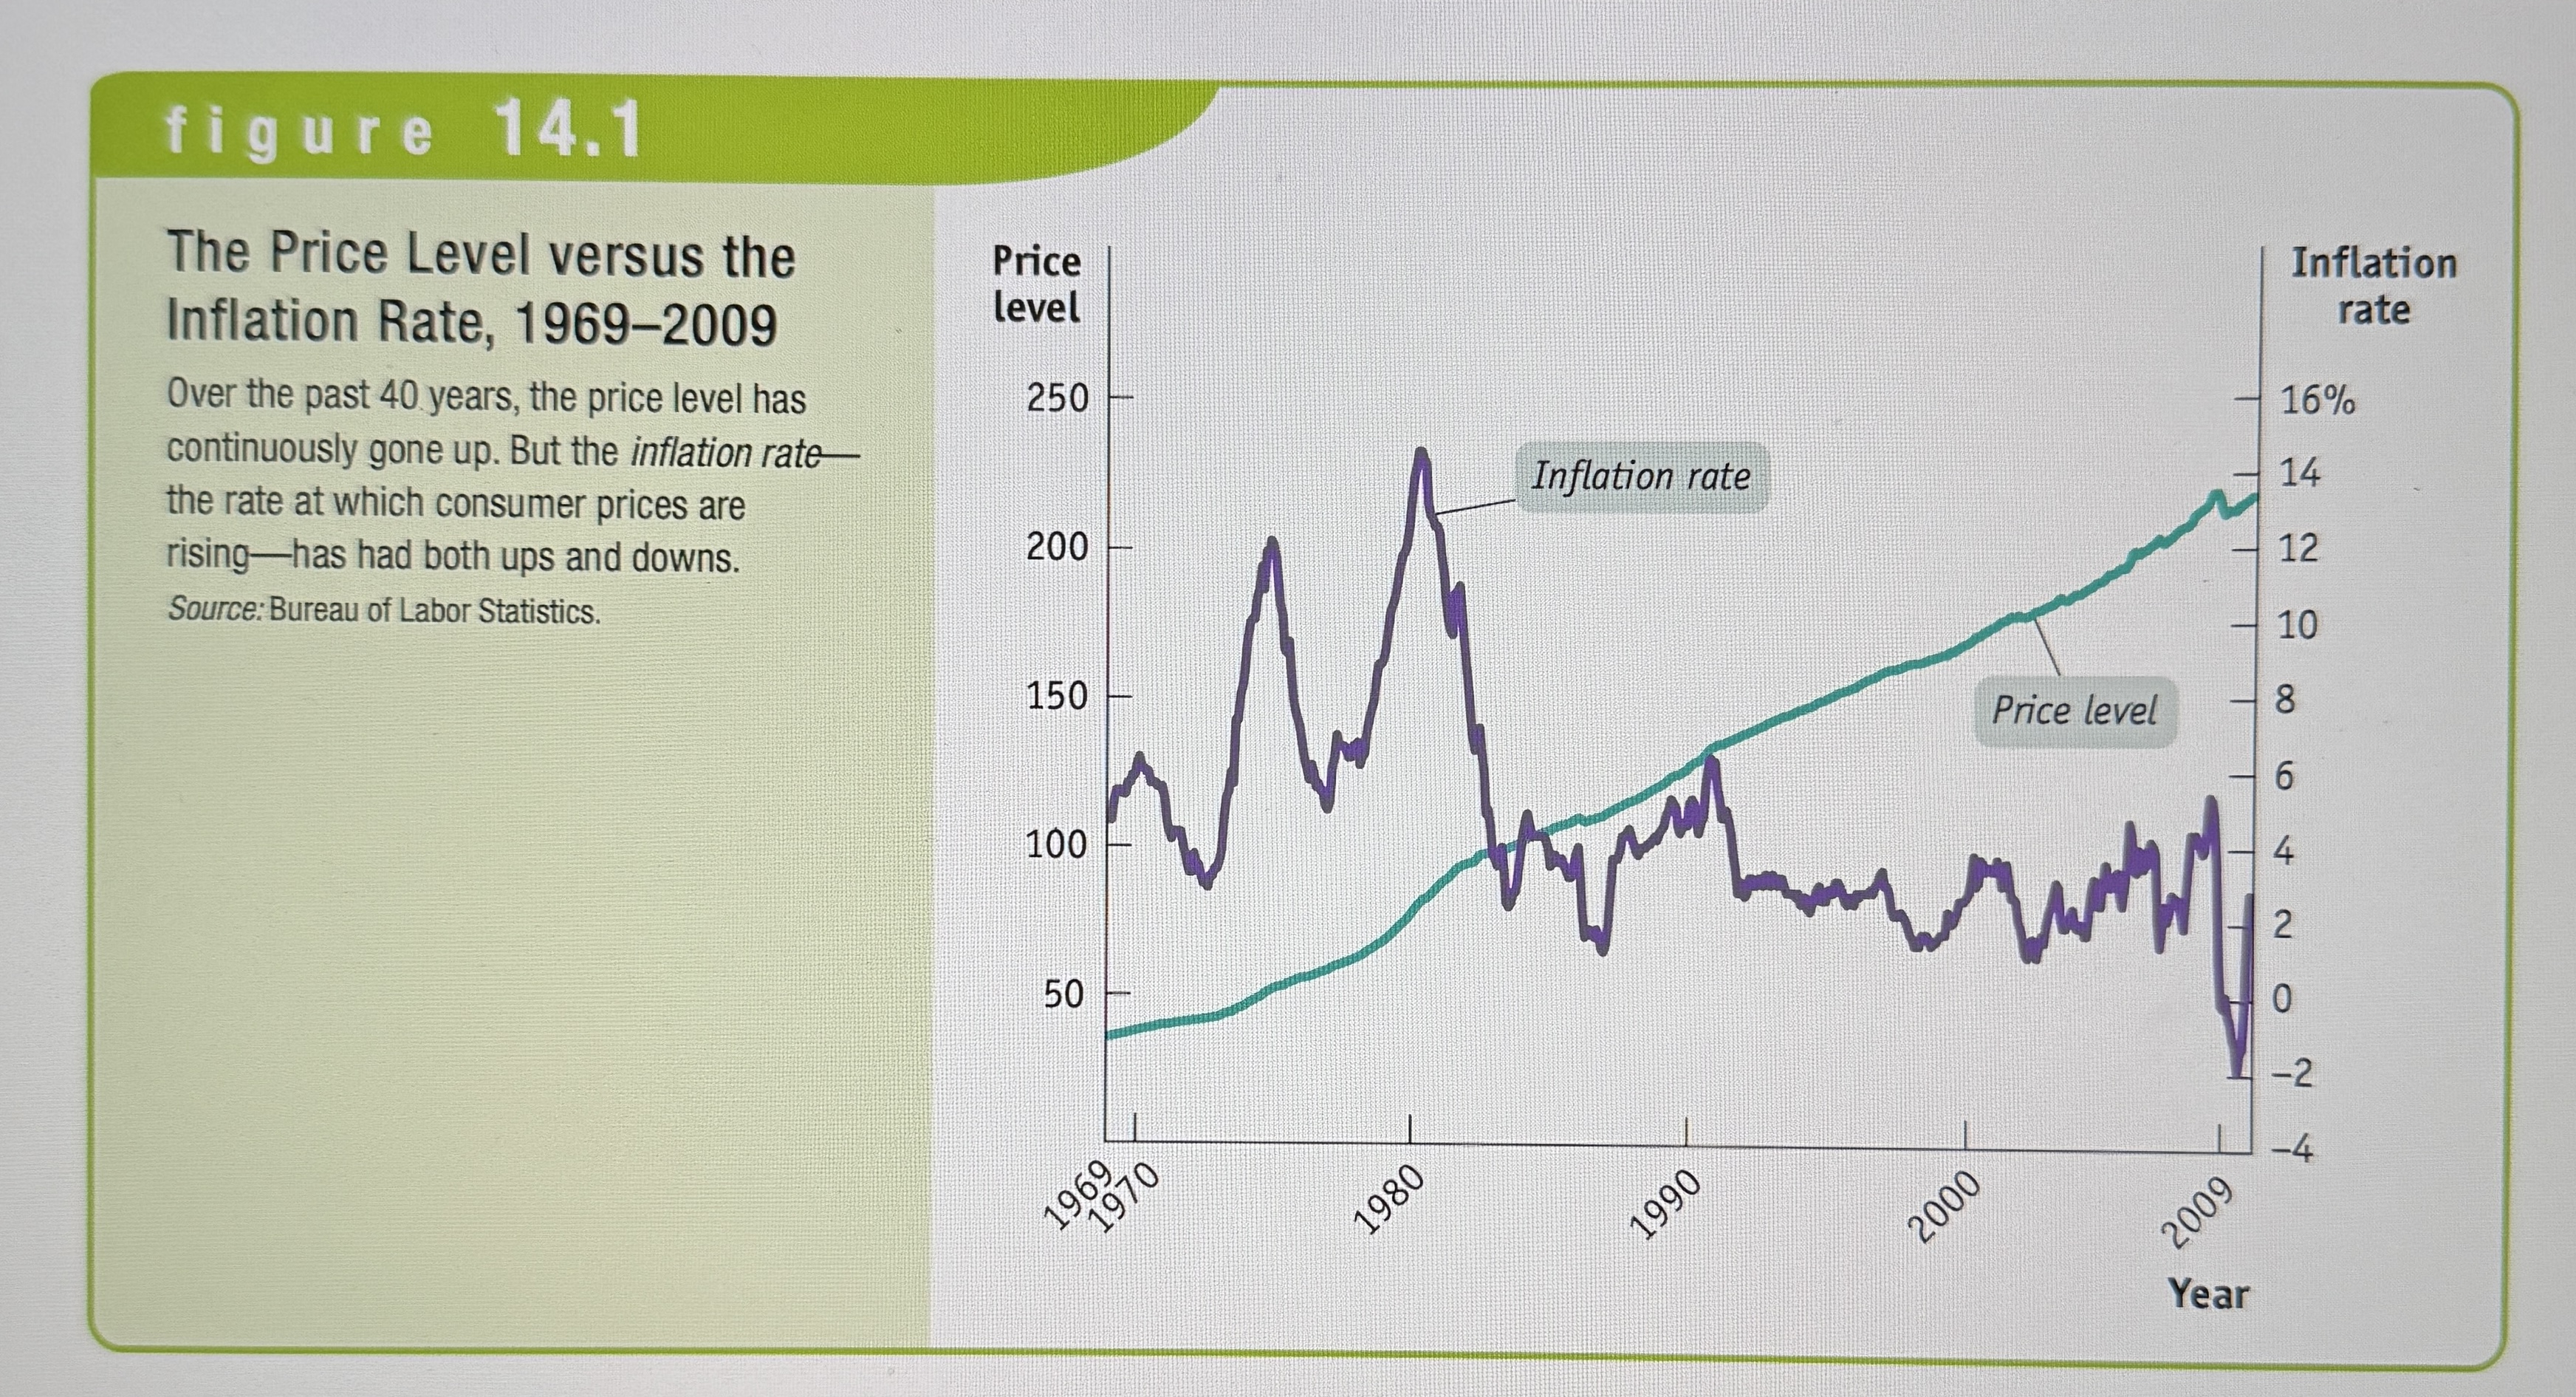
Price Level vs Inflation Rate
Ex.
Show-leather costs
The increased costs of transactions caused by inflation.
Menu Costs
The real cost of changing listed prices. If inflation is high, it requires more work to continually change prices. Labor and resources are thus drained more.
Unit - of - Account Costs
Costs that arise from the way, inflation makes money a less reliable unit of measure. The economy makes less efficient use of its resources if it’s weary about the decreasing value of its currency. We become more hesitant.
The nominal interest rate
The interest rate actually paid for a loan. What banks say will be gained from the loan, ex. 8%
The real interest rate
The nominal interest rate minus the rate of inflation. What interest will actually be gained from the loan accounting inflation. For example, the loan has an interest rate of 8% but the inflation rate is 5%, then the real interest rate is 3%.
Disinflation
The process of bringing the inflation rate down. It’s very difficult since it often leads to high unemployment and recession.
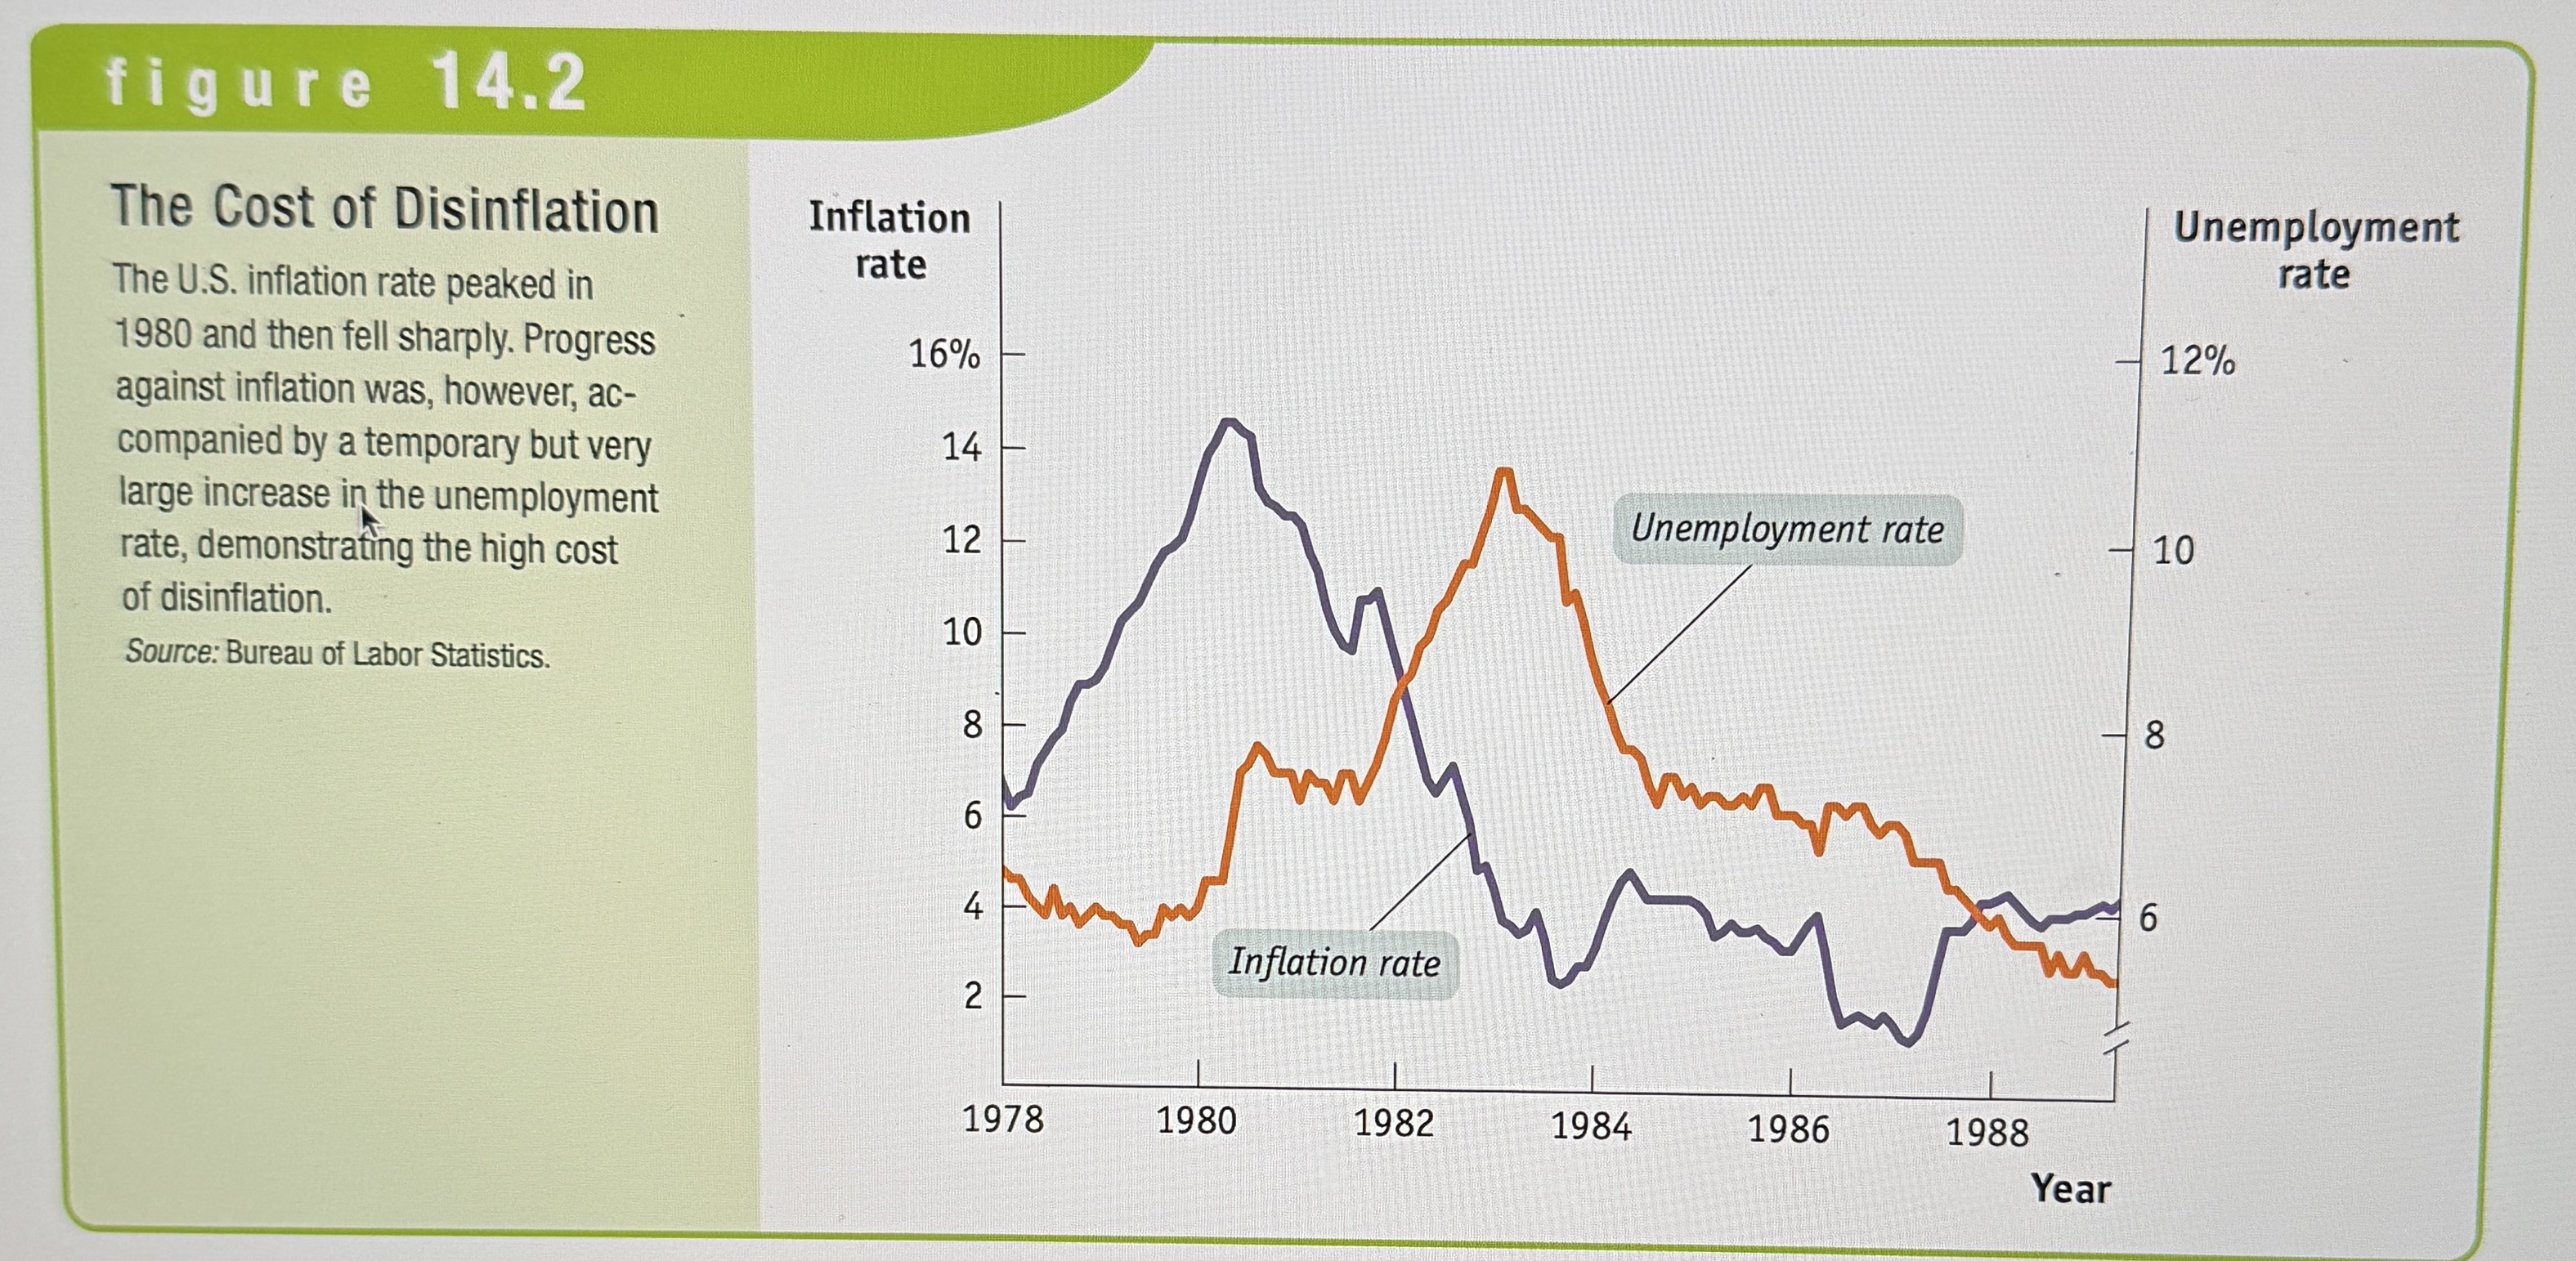
The Cost of Disinflation
Ex.
Aggregate Price Level
A measure of the overall level of prices in the economy.
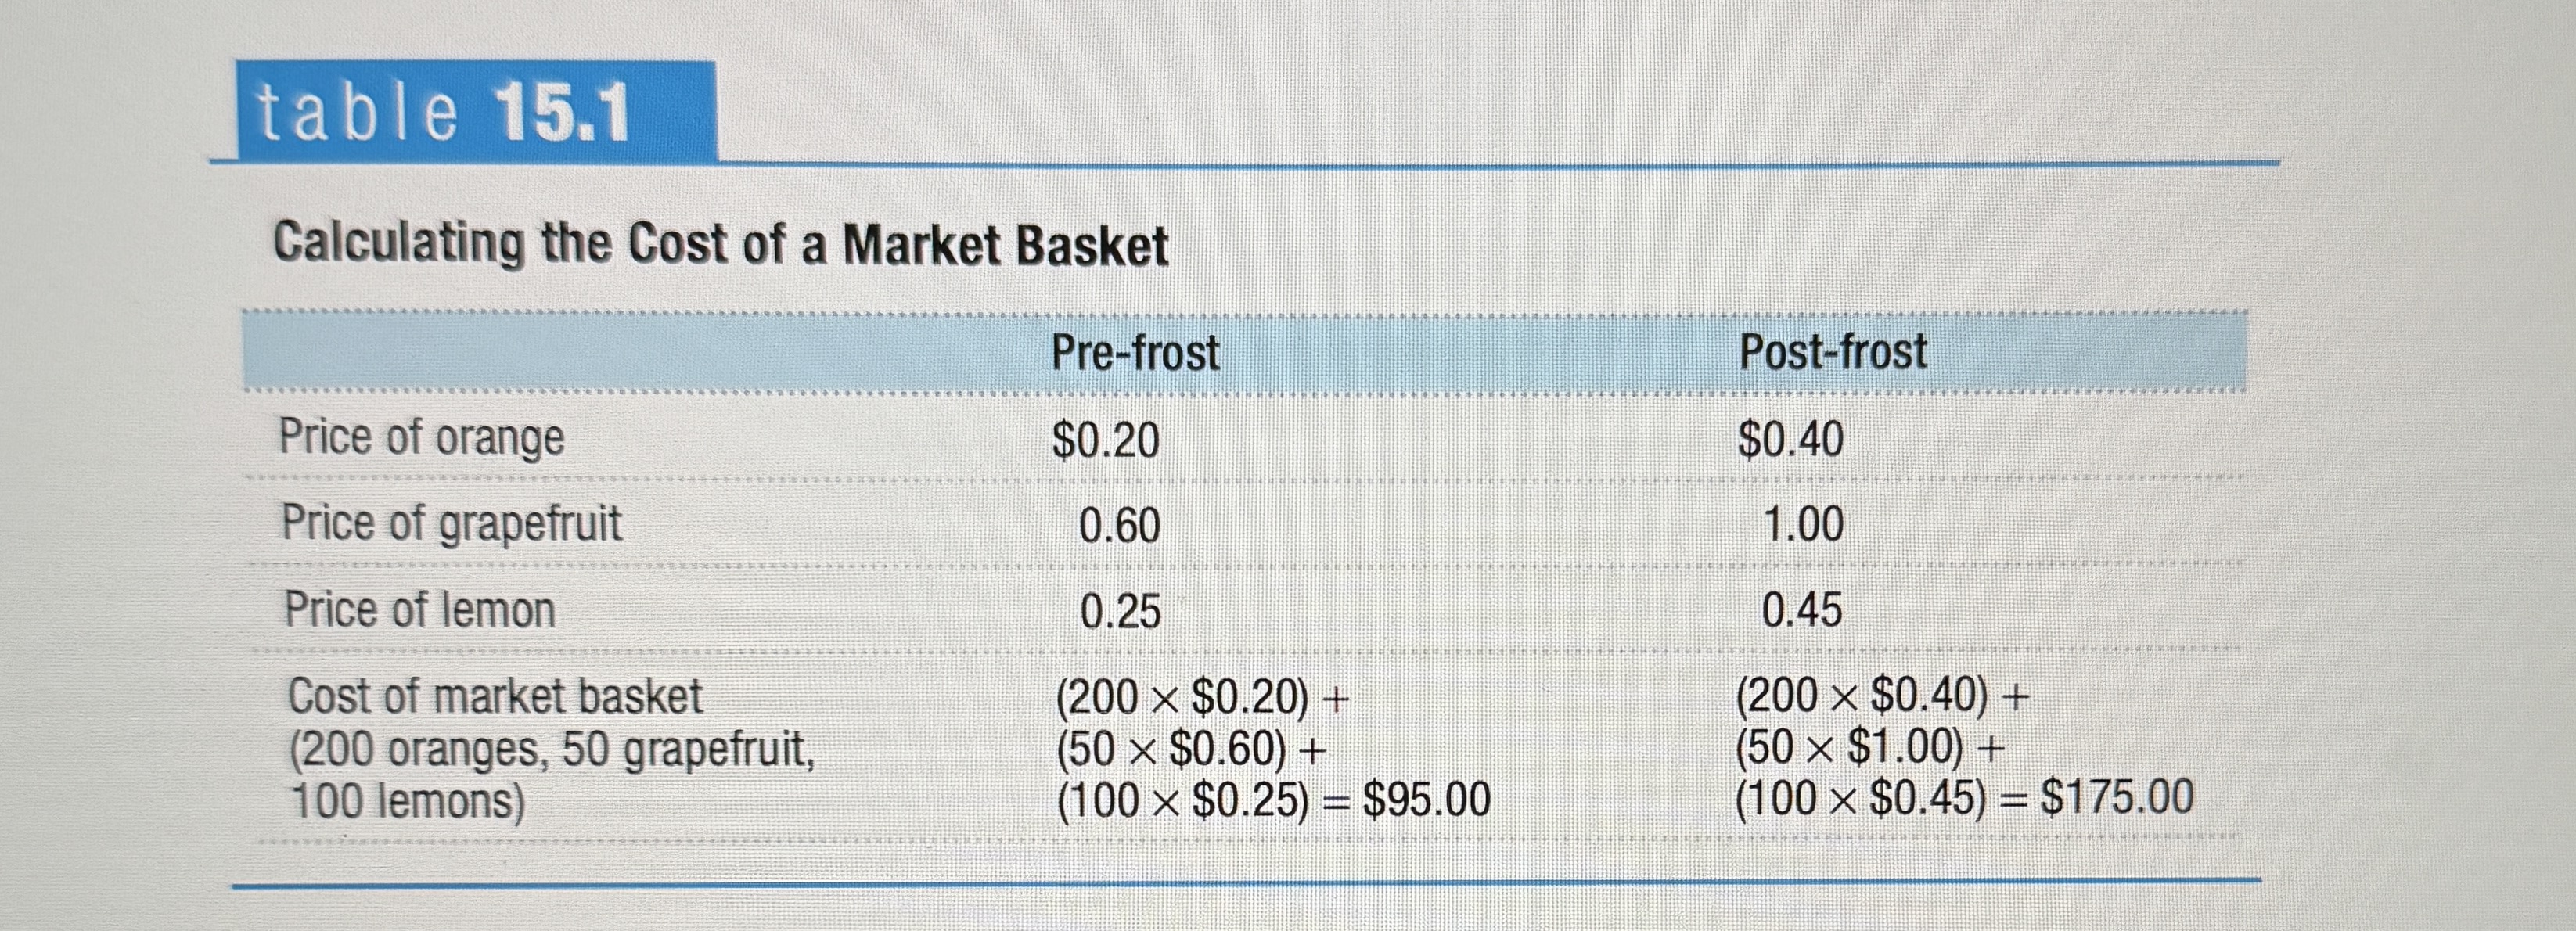
Market Basket
A hypothetical set of consumer purchases of goods and services. Used to measure changes in overall price levels.
Calculating the Cost of a Market Basket
Ex.
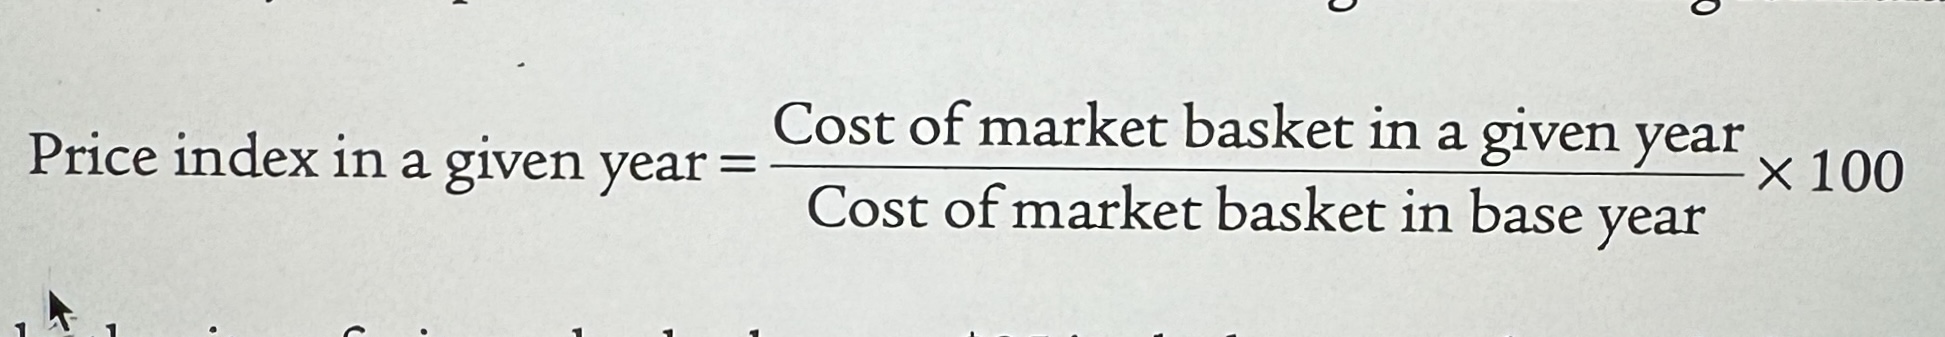
Price Index
Price index measures the cost of purchasing a given market basket in a given year. The index value is normalized so that is equal to 100 in the selected base year.
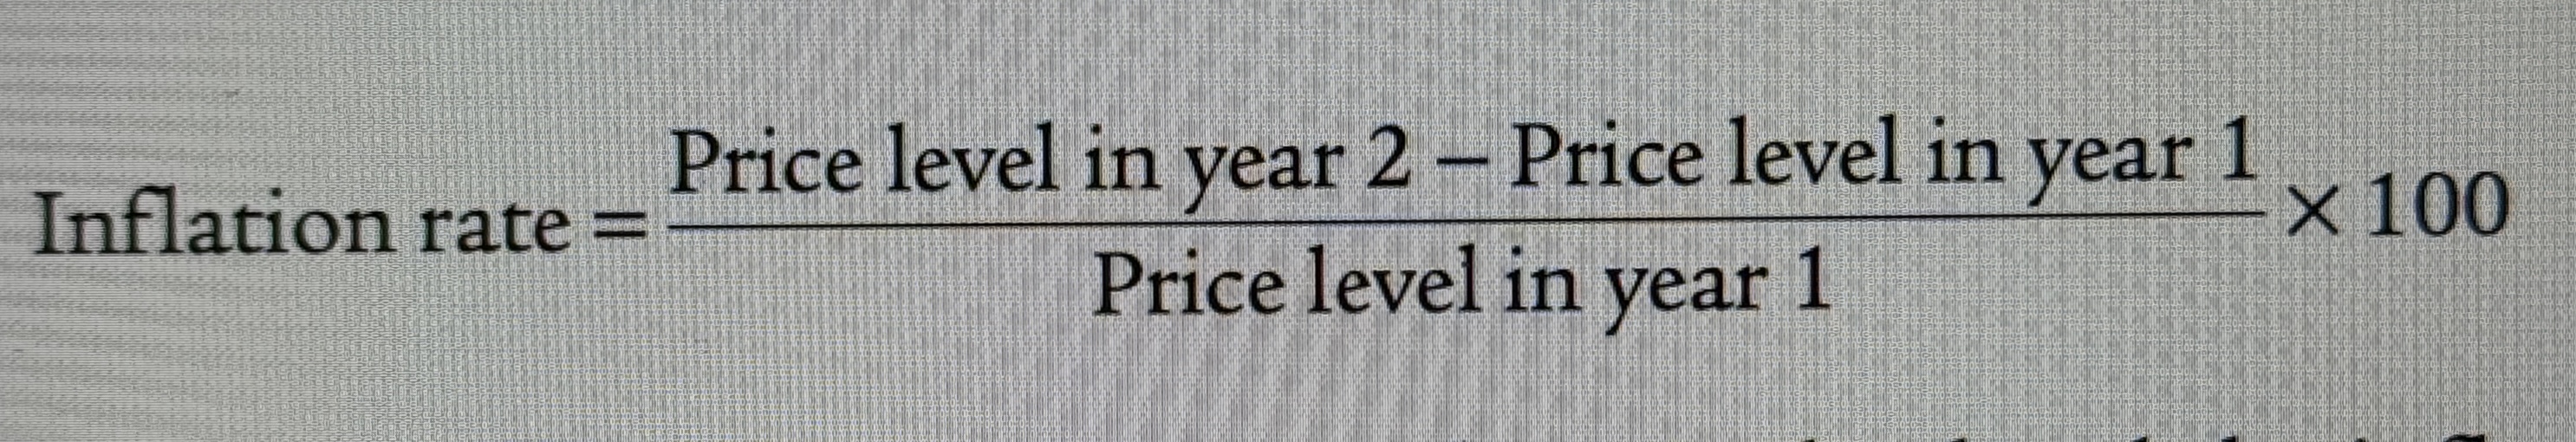
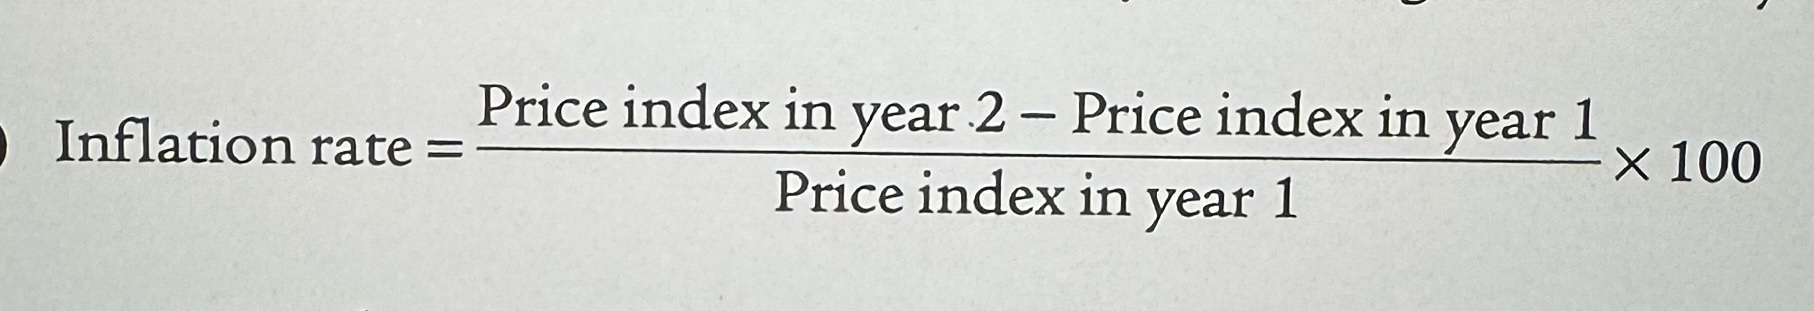
Inflation Rate Equation
The average percentage change in an official price index.
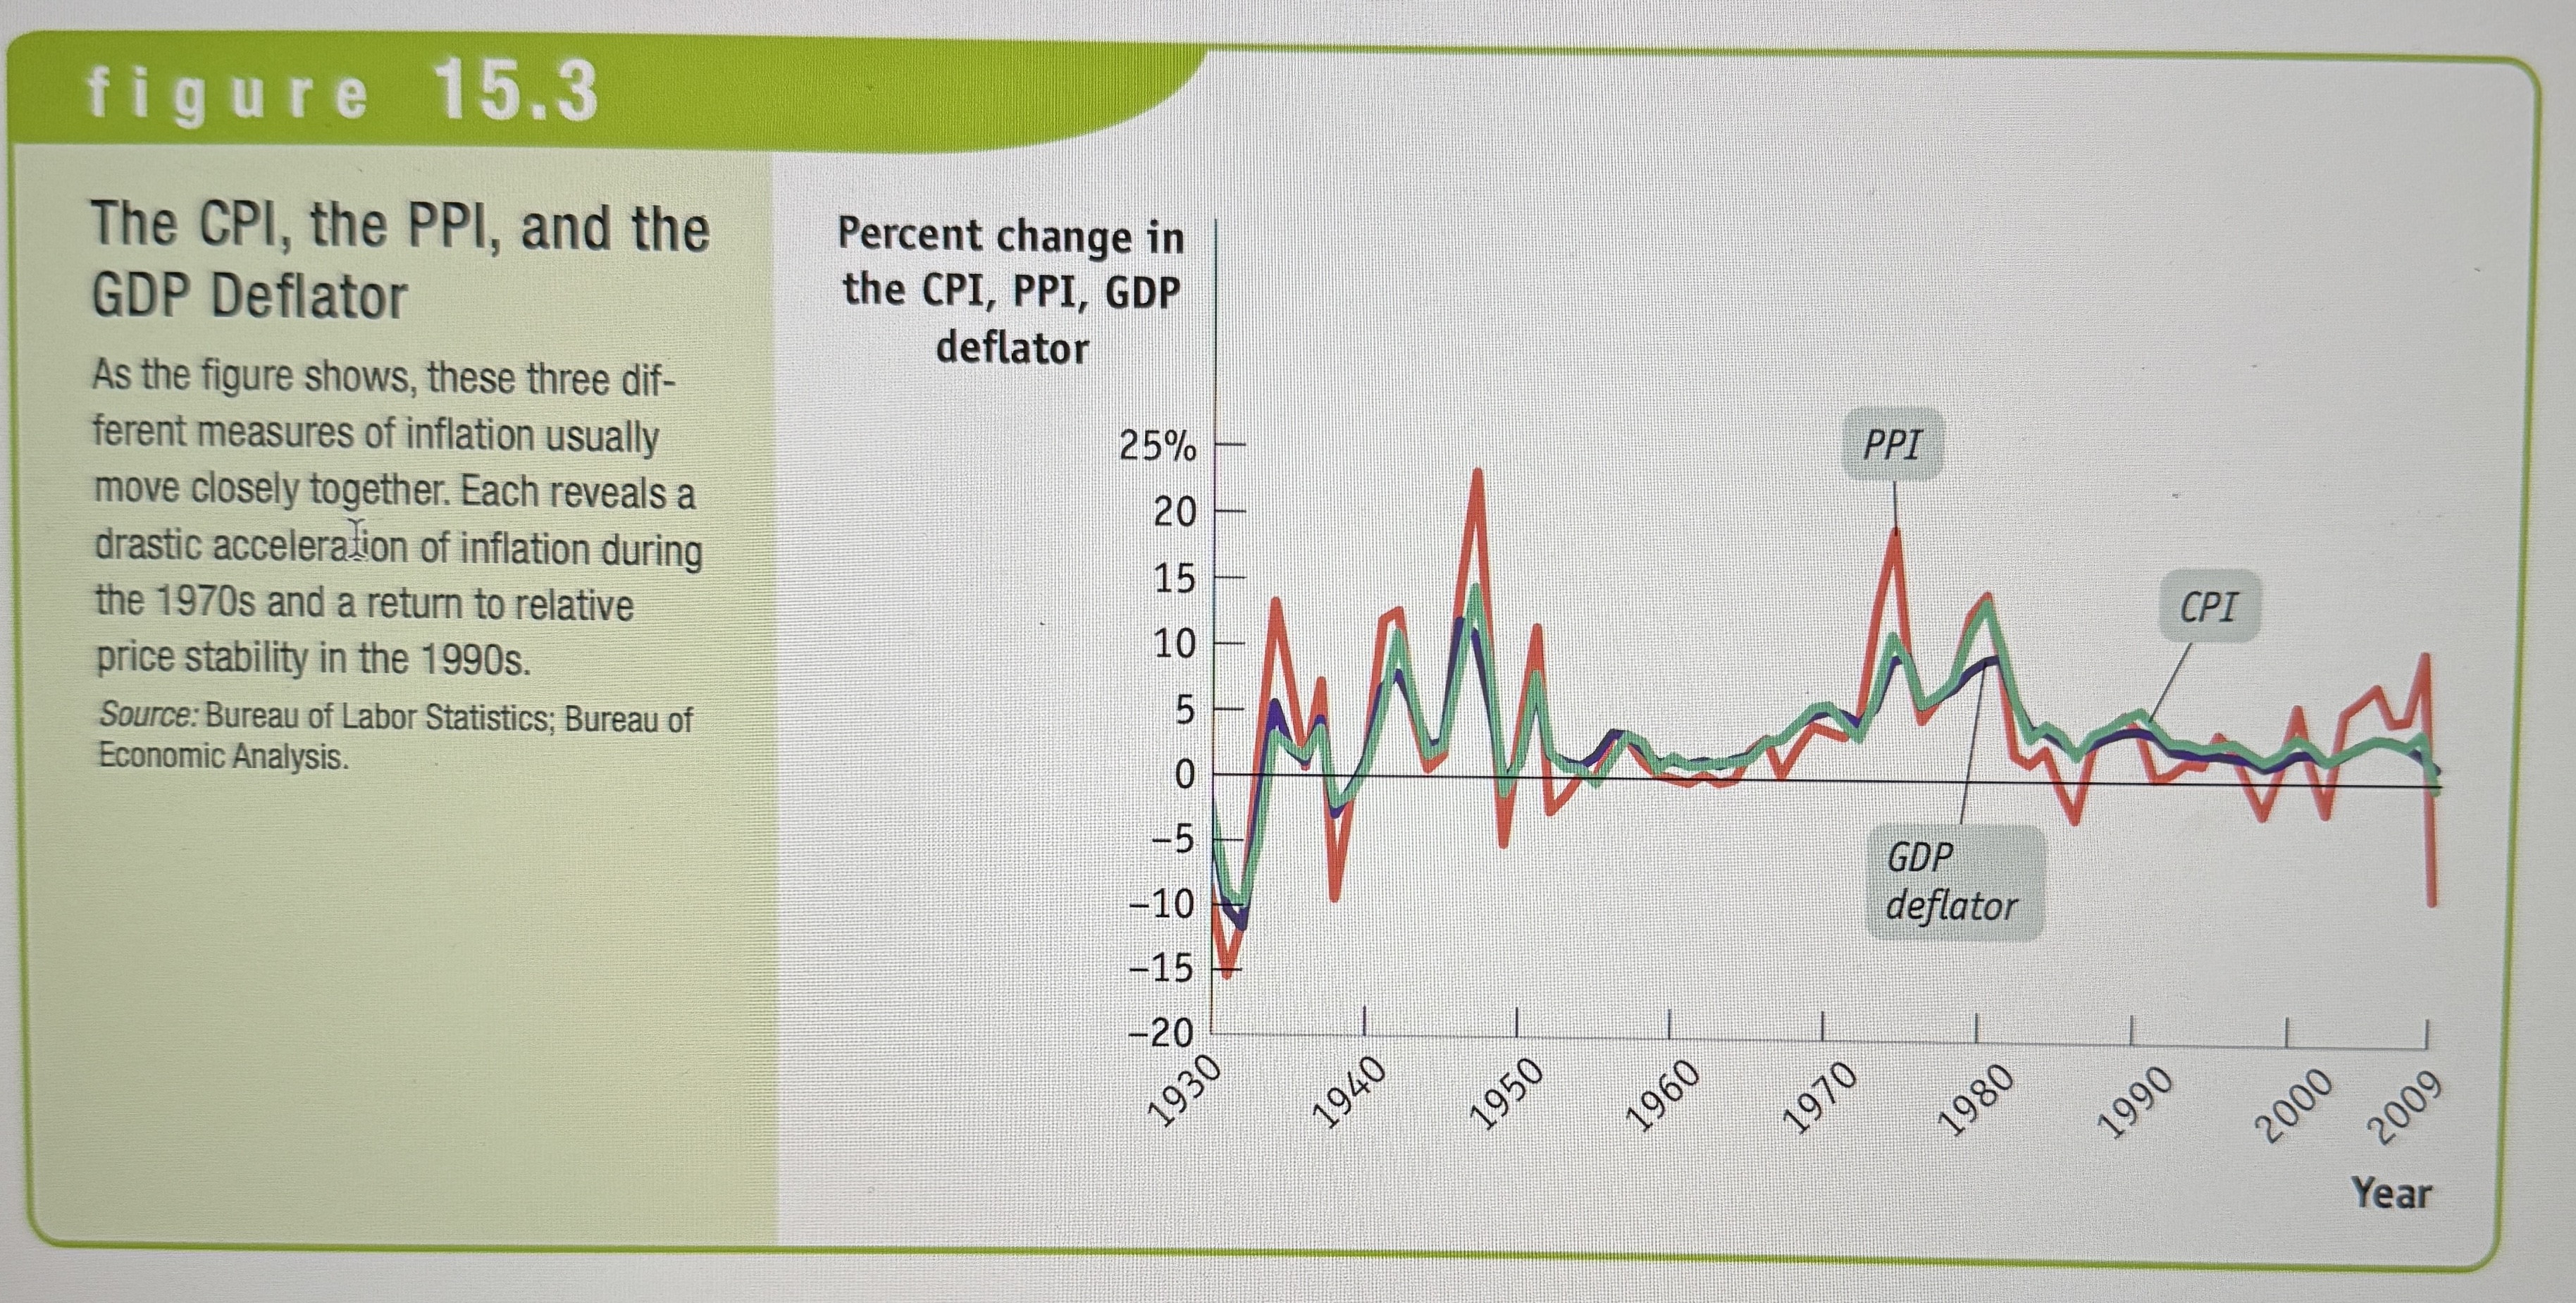
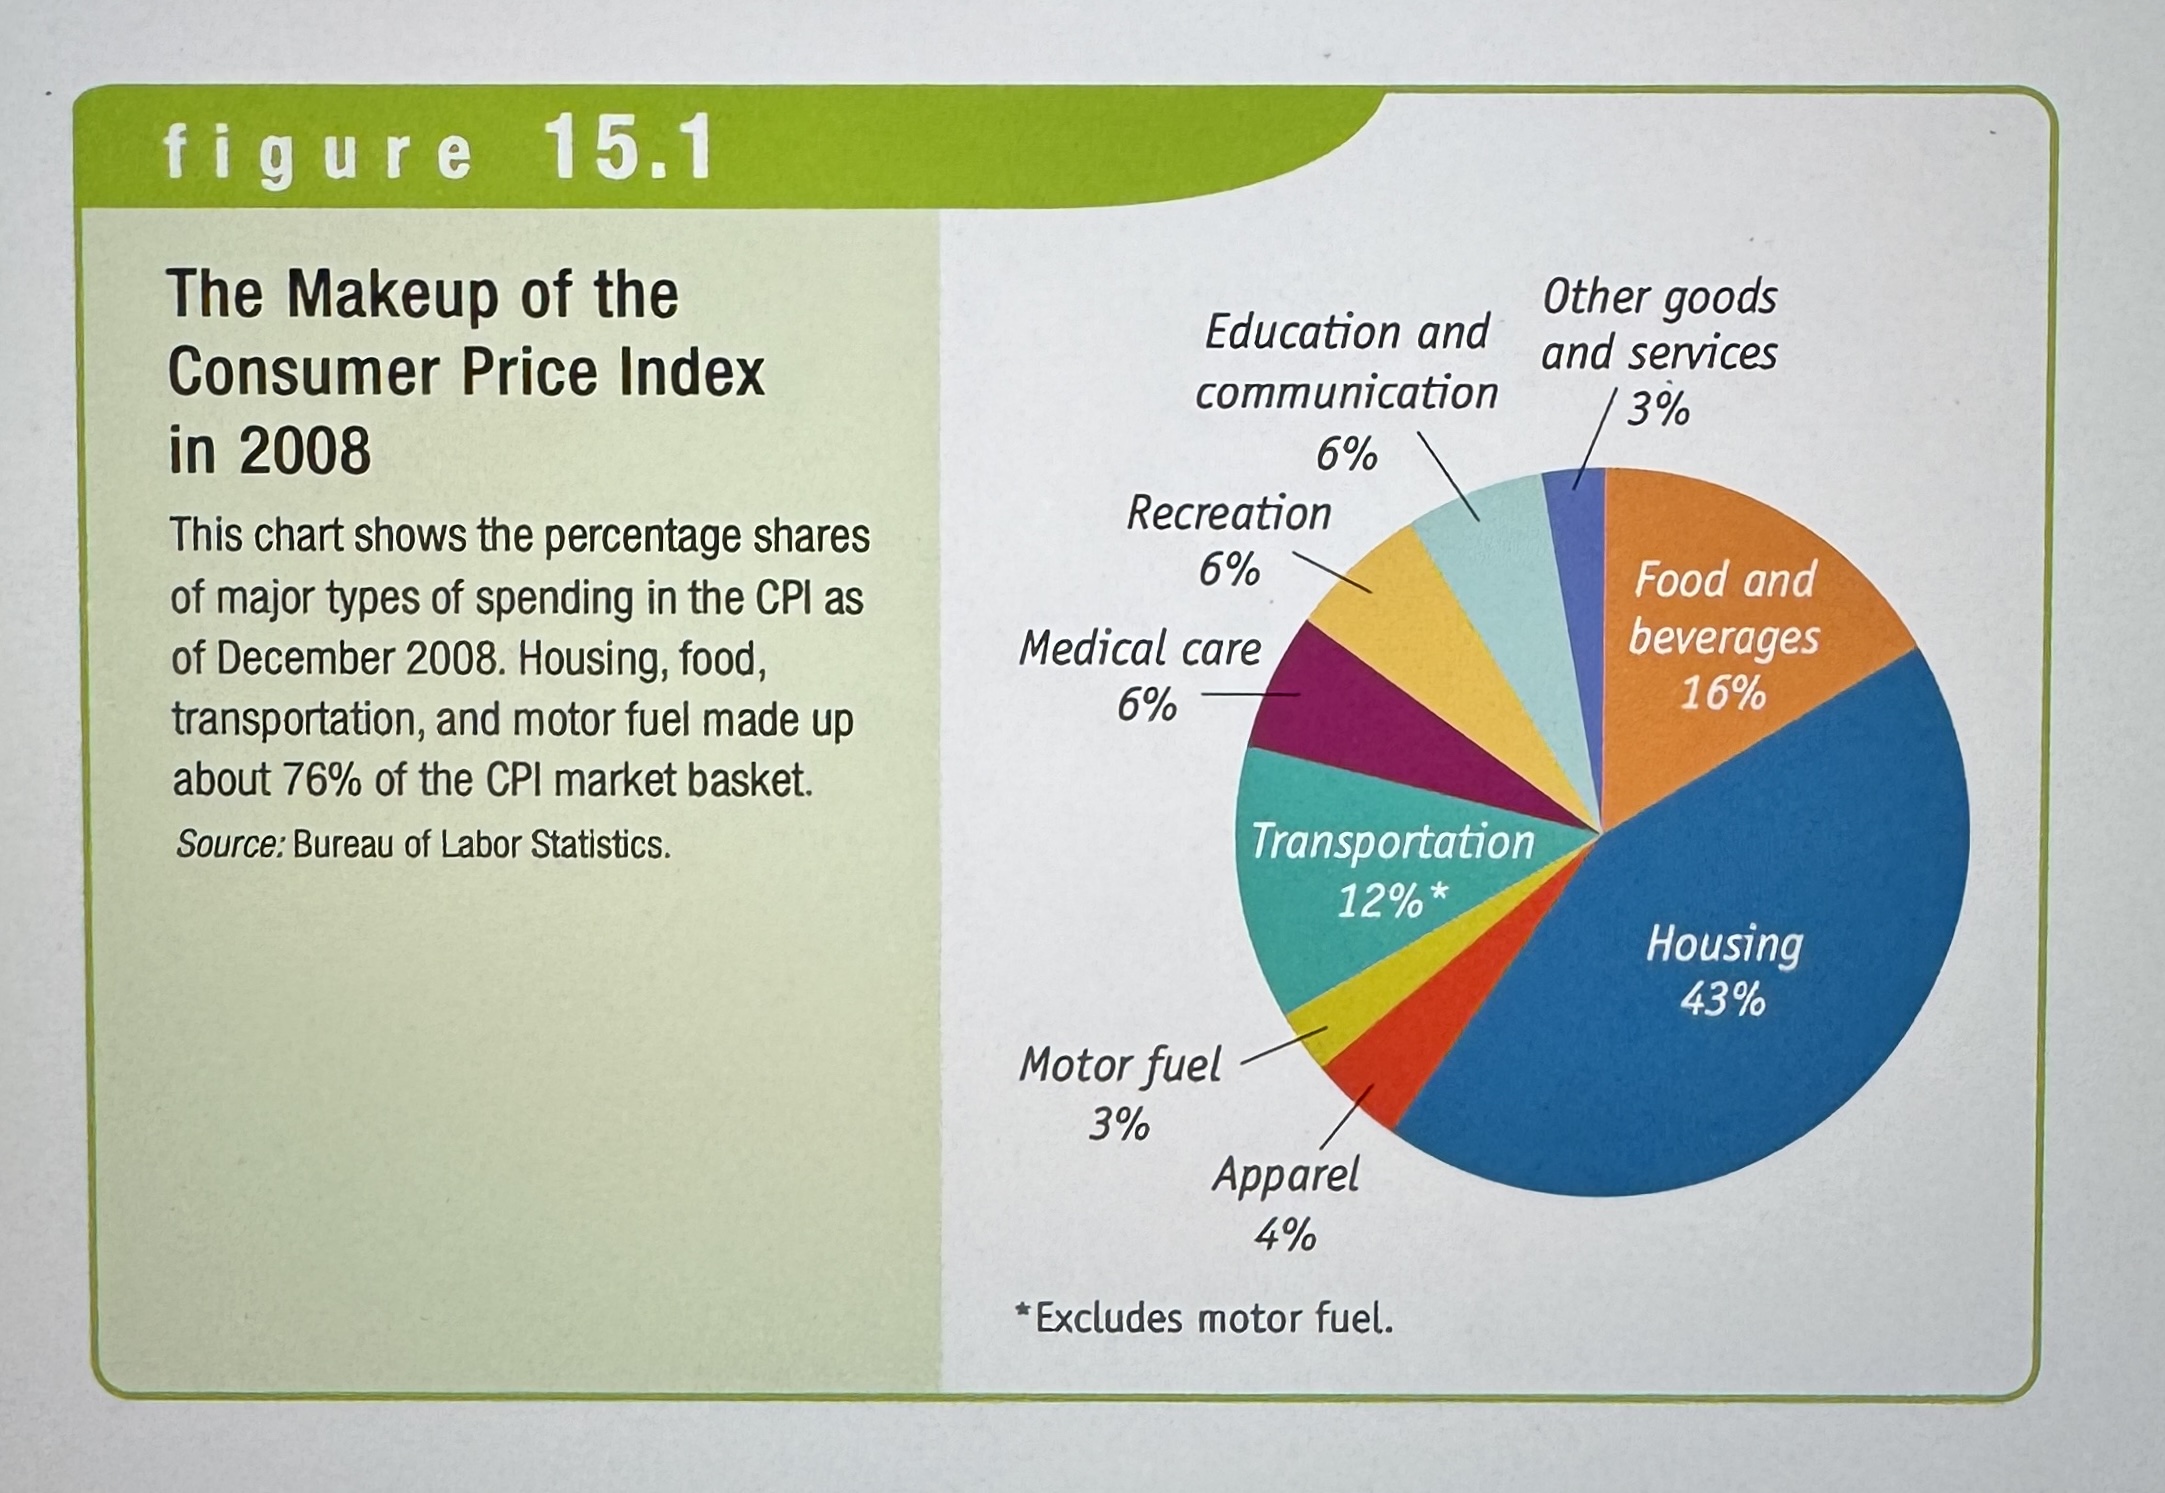
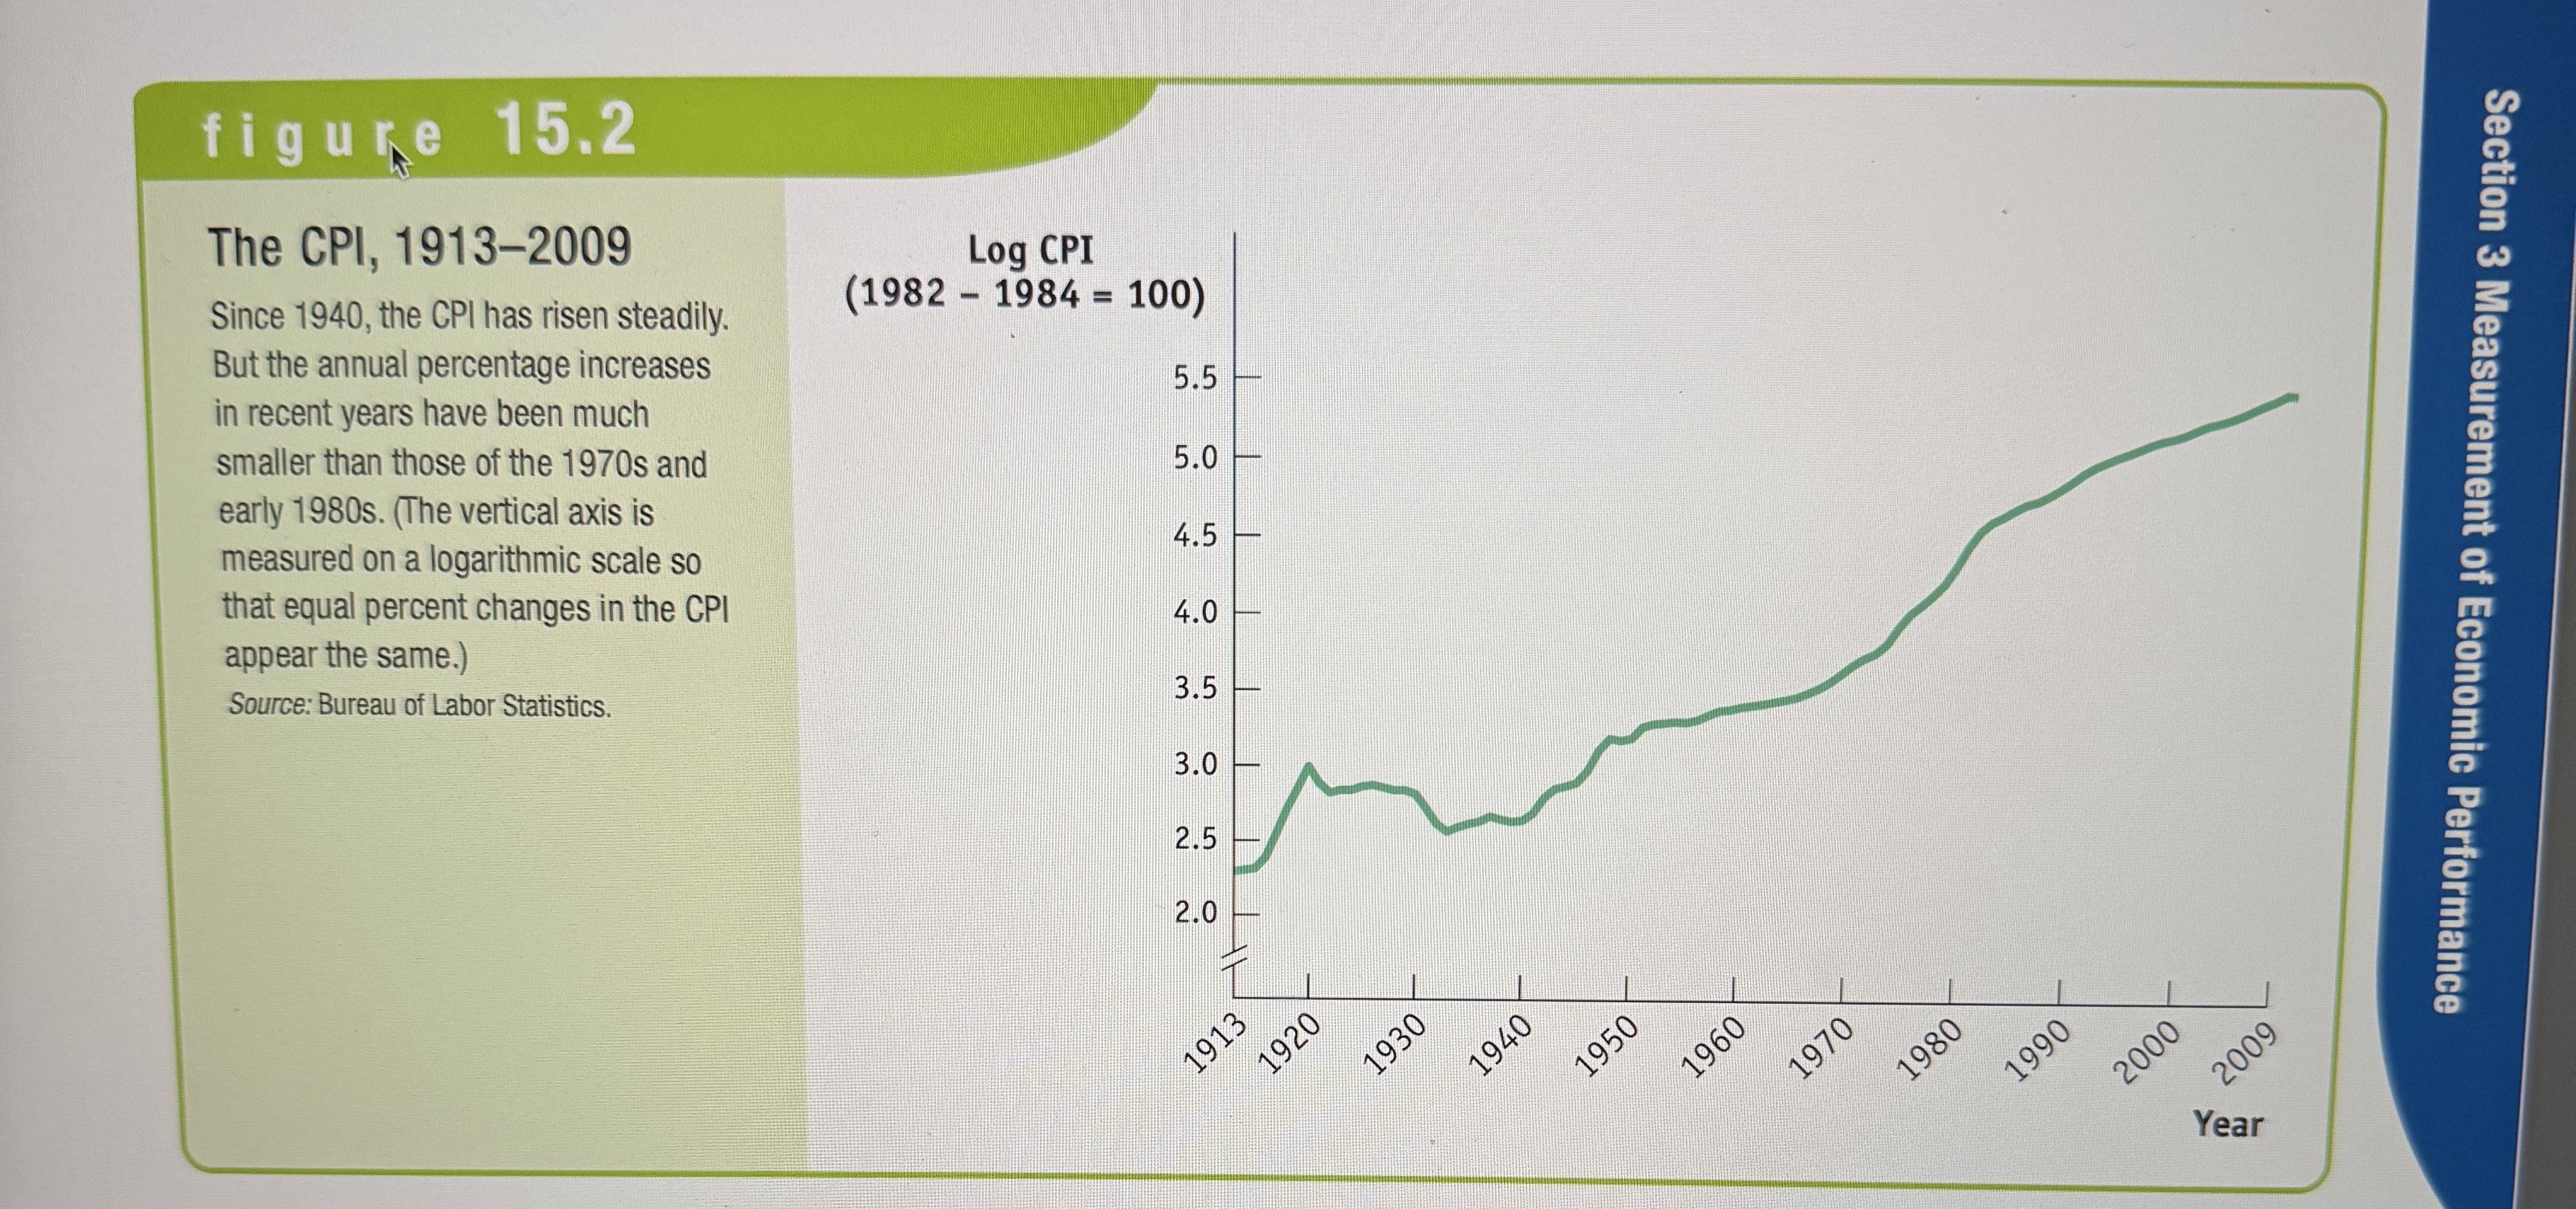
The Consumer Price Index (CPI)
Measures the cost of the Market Basket of a typical urban American family.
The CPI Graph
Ex.
The Producer Price Index (PPI)
Measures changes in the prices of goods and services purchased by producers.
The GDP deflator
The GDP deflator for a given year is 100 times the ratio of nominal GDP to real GDP in that year. Another indicator of aggregate price/inflation.
CPI, PPI, and the GDP Deflator
Ex.