Module 2 Sound and Hearing Mechanism
1/69
There's no tags or description
Looks like no tags are added yet.
Name | Mastery | Learn | Test | Matching | Spaced | Call with Kai |
|---|
No analytics yet
Send a link to your students to track their progress
70 Terms
What is sound?
Sound is a common type of energy that occurs as a result of pressure waves that emanate from some force being applied to a sound source.
How does sound form?
From the compression of molecules in the medium through which it is traveling.
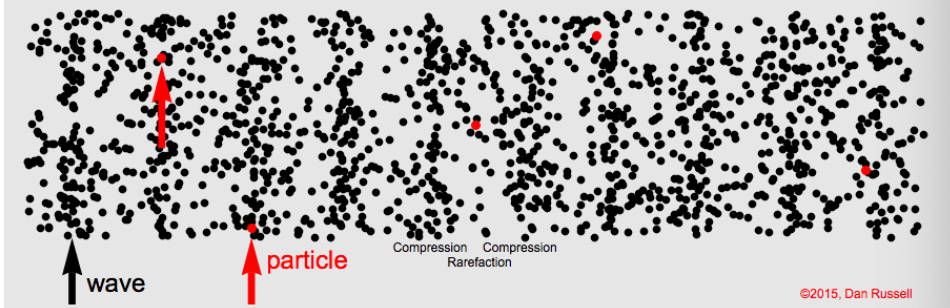
Groups of molecules are compressed which in turn
compress adjacent groups of molecules. This results in waves of pressure that emanate from the source
What are the requirements for sound?
source of vibratory energy and a medium that has mass and is elastic
Particle Motion
particles bump into each other transferring energy from one another
The magnitude of a sound is described as its
intensity
Intensity is related to the
perception of loudness
The higher the magnitude of the compression wave
the higher is the intensity of the signal
Wave form properties
The range of intensity of sound that is audible to humans is
quite large
The pressure level of a sound that is just barely audible is approximately
20 micro pascals
The pressure level of a sound that is so intense that it is painful is
200,000,000 micro pascals
Because this range is so large
a unit of measurement called the decibel is used
Intensity is described as
the logarithm of a measured pressure to a reference pressure
The unit of measure to describe intensity is called a
bel
Which person was bel named after?
Alexander Graham Bell
1 bel , 2 bels =
10 decibels 20 decibels
Intensity is most often expressed in
decibels (db) sound pressure level (db SPL)
db SPL Formula
db SPL =10 log
(pressure / reference pressure)²
db SPL = 2 × 10 log
(pressure / reference pressure)
db SPL = 20 log
(pressure/ reference pressure)
Important point 1 of db SPL visual
The logarithm idea is a way of reducing the range of pressure levels to a tractable one. By using this approach pressure that vary from 1:1 to a hundred million: 1 can be expressed as varying from 0 to 140 db.
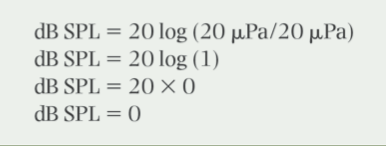
Important point #2 db SPL visual
decibels are expressed as a ratio of a measured pressure to a reference pressure. This means that 0 db does not mean no sound. it simply means that the measured pressure is equal to the reference pressure as follow:
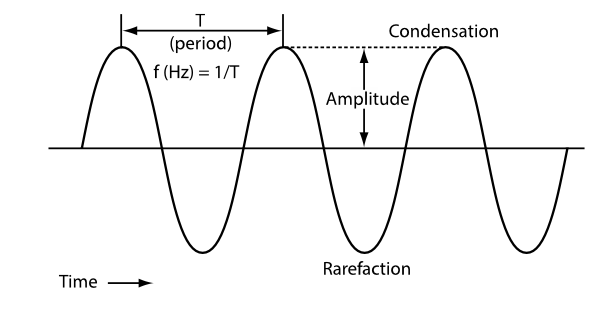
Frequency is the speed of
vibration
Frequency is related to the perception of
pitch
The higher the speed of vibration of the compression wave
the higher is the frequency of the signal
Frequency is usually expressed in
cycles per second or hertz
human hearing in young adults ranges from
20 to 20,000 hz
For audiometric purposes
frequency is not expressed in a linear form, rather it is partitioned into octave intervals
An octave
is simply twice the frequency of a given frequency
Phase
is the location at any point in time in the displacement of an air molecule during simple harmonic motion
Phase is expressed in degrees of a
circle
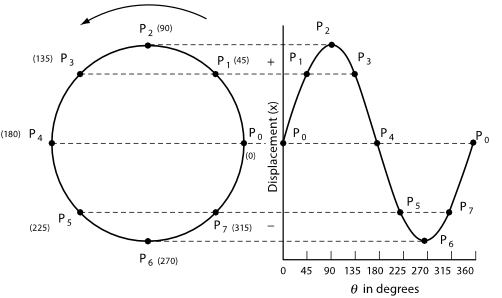
Sinusoidal motion
circular motion and the back and forth movement of an air molecule
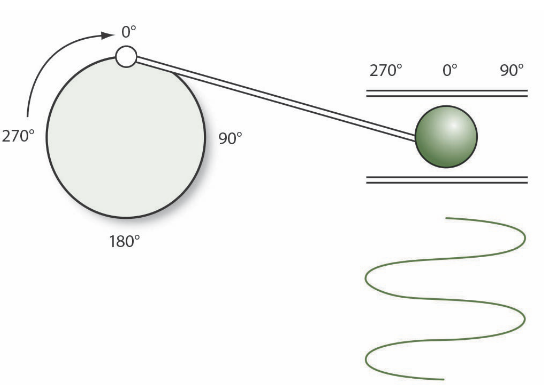
Sinusoid
is a periodic wave in that it repeats itself at regular intervals over time
Waves that are not sinusoidal are considered
complex as they are composed of more than one sinusoid that differ in amplitude, frequency, and or phase
Sounds in nature are usually complex
and they are rarely sufficiently described on the basis of the characteristics of a single frequency
For complex sounds
the interaction of intensity and frequency is referred to as the sounds spectrum.
single wave

complex wave

Sensitivity
is defined as the capacity of a sense organ to detect a stimulus
absolute sensitivity
pertains to the capacity of the auditory system to detect faint sound
differential sensitivity
pertains to the capacity of the auditory system to detect difference of changes in intensity, frequency, or some other dimension of a sound.
Hearing sensitivity
most commonly refers to absolute sensitivity to faint sound
hearing acuity
most accurately refers to the differential sensitivity usually to the ability to detect differences in signals in the frequency domain.
threshold
is the level at which a stimulus or change in stimulus is just sufficient to produce a sensation or an effect
In hearing absolute threshold
is the threshold of audibility or the lowest intensity level at which an acoustic signal can be detected
Threshold is usually defined as the level at which a sounf can be heard
50% of the times that it is presented
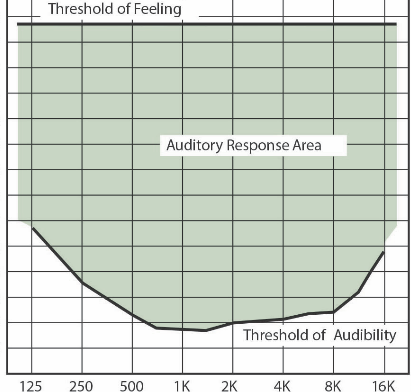
Auditory response area
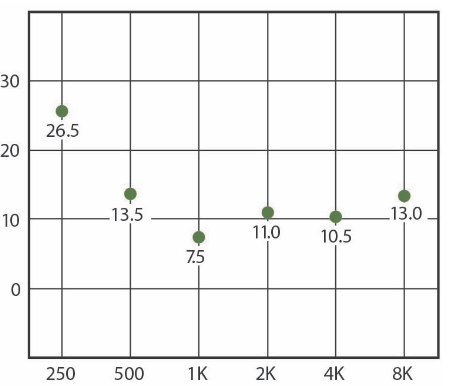
Audiometric Zero
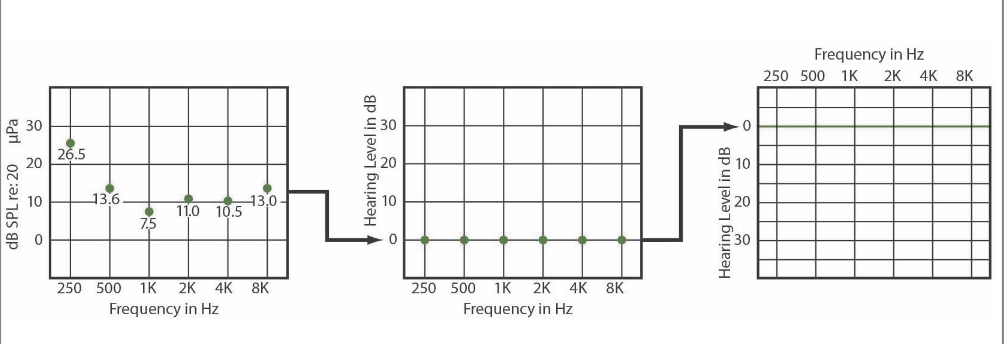
The conversion from sound pressure level to hearing level to an audiogram
Differential threshold
also called difference limen is the smallest difference that can be detected between two signals that vary in some physical dimension
HEaring acuity
most accurately refers to the differential sensitivity, usually to the ability to detect difference in signals in the frequency domain
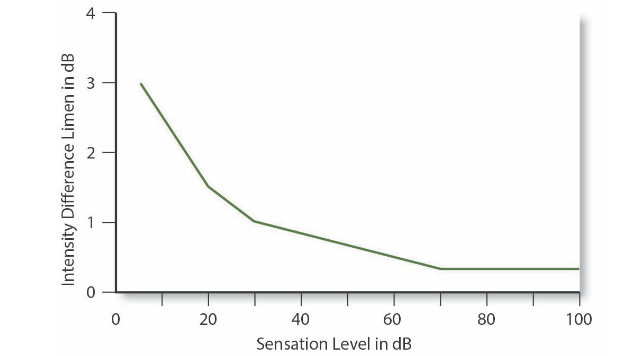
Intensity difference limen
Generalized drawing of the relationship between intensity of a signal and difference limen for intensity. The term sensation level refers to the number of decibels above a person hearing threshold.
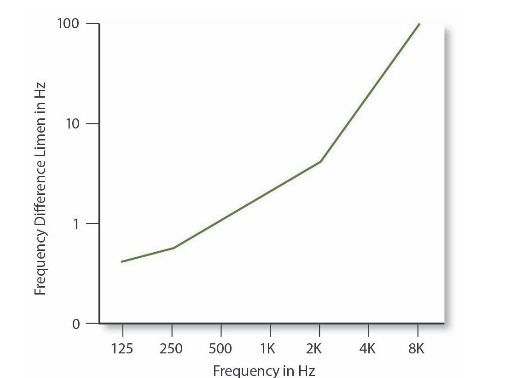
Frequency difference limen
Generalized drawing of the relationship between frequency of a signal and the difference limen of frequency
Threshold of hearing sensitivity
is just one way to describe hearing ability. It can also be described in terms of suprathreshold hearing perception
Loudness
refers to the perception that occurs at different sound intensities. Low intensity sounds are perceived as soft sounds, while high intensity sounds are perceived as loud sounds. As intensity increases, so too does the perception of loudness
Pitch
refers to the perception that occurs different sound frequency. Low frequency sounds are perceived as low in pitch, and high frequency sounds are high in pitch. As frequency increases so does the perception of pitch.
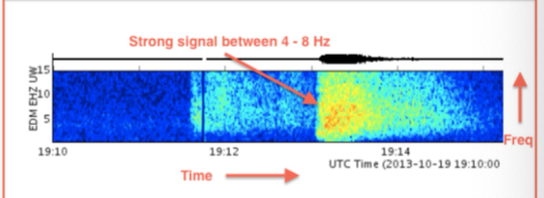
What is a spectrogram?
visually represents sound frequencies over time using color or brightness for amplitude
Axes and Dimensions
Time is horizontal frequency is vertical and amplitude is shown by brightness or color.
Applications of spectrograms
used in linguistics audiology and music technology to analyze pitch loudness and timbre.
Educational importance
spectrograms help students visualize sounds concepts making acoustic theour easier to understand.
Time axis representation
The horizontal axis of a spectrogram represents time, showing how sounds evolve moment by moment.
Frequency axis representation
the vertical axis depicts frequency, with low frequencies at the bottom and high frequencies at the top.
Color indicates loudness
color brightness in a spectrogram reflects loudness, with brighter colors indicating louder sounds
Complex sound patterns
complex sounds show multiple frequency bands simultaneously, revealing pitch changes and harmonic structures
Speech pattern analysis
spectrograms help linguistics study vowel formats and consonants transitions to understand the speech details.
Clinical Voice diagnosis
speech language pathologists and audiologists use spectrograms to diagnose voice disorders and asses auditory processing abilities respectively.
Music sound visualization
musicians use spectrograms to visualize harmonic content and itmbre in comples musical signals
Therapy and intervention support
spectrograms support monitoring therapy progress and designing personalized interventions for speech anomalies.
Speech Acoustic insights
spectrograms reveal detailed speech acoustics helping slps evaluate voice quality pitch and articulation effectively
Clinical applications
slp use spectrograms in voice therapy phonological assessments and auditory evaluations to track and diagnose speech issues.
Professional development
mastering spectrogram skills enhances research capabilities and supports evidence based clinical documentation and treatments