tectonics
1/53
Earn XP
Name | Mastery | Learn | Test | Matching | Spaced | Call with Kai |
|---|
No analytics yet
Send a link to your students to track their progress
54 Terms
hazard
a potential threat to human life and property - either hydro-meteorological hazards (caused by climate) or geophysical/tectonic hazards (caused by land processes)
tectonic hazards can occur due to:
near plate boundaries - earthquakes + volcanoes
intra-plate earthquakes - due to solid crust, which has weakened over time, cracking under pressure
volcanic hotspots - unusually high temperature due to the up-welling of hot molten material from the earth’s core e.g. pacific ring of fire - has an unusually high temperature due to the magma rising as plume (hot rock)
tectonic trends since 1960
number of recorded hazards - increased
total fatalities - decreased - except mega disasters
number of people affected - increased (population growth)
economic costs - increased due to better infrastructure development + increasing insurance/repairs cost
why is reporting disaster impacts difficult?
do you only consider direct deaths or also indirect deaths - such as spread of disease, days after the impact?
location - isolated areas + areas with a high population density may be hard to collect information from
differing methods of collection
number can be subject to bias - e.g. burmese government claimed 0 deaths during the 2004 boxing day tsunami - false
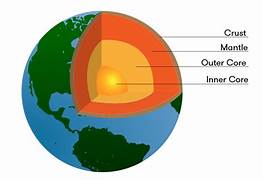
tectonic theory
crust/lithosphere - oceanic crust - 7km thick + continental crust - up to 70km thick
mantle/asthenosphere - mainly made up of silicate rocks - rich in iron and magnesium. the mantle is semi-molten + has a temperature gradient - resulting in convection currents 700-2890km below crust
outer core - semi-molten + dense - contains iron + nickel alloy, 2890-5150 km below crust
inner core - solid due to extreme pressure + high temperature (result of primordial heat left from earth’s formation + radiogenic heat from radioactive decay)
case study: montserrat/soufriere hills (1995-1999) - volcanic eruptions
stratovolcano (andesitic) was in constant eruption since dormancy (before 1995) - 2/3 population have left since then.
1995 - eruption of ash/steam up to 40,000 feet - lead to temporary flight ban, surge cloud of 100mph ash, 500 evacuated - was 1/3 of the population
1996 - south destroyed by pyroclastic flows + tephra which covered 1/2 of the island, so the remaining residents went into temporary shelter
1997 - 19 killed by pyroclastic flow due to poor management + the only airport was destroyed making aid difficult to receive - only available by sea
1998 - continued eruptions every 9 hours - environment suffers as ecosystems were suffocated by toxic gas + tephra
1999 - volcanic activity finally calms, but montserrat in total destruction as 17 settlements, major roads and airport destroyed
2025 - focusing on geothermal energy, sand-mining + tourism to continue rebuilding in “ash to cash” scheme
AID:
UK government set up modern tracking + seismology stations + pledged £41 million for survivors
£10 million - direct aid to help response of navy
however, there were riots/protests among population as “government was not engaged enough in what locals saw as the decimation of their island” - led to chief minister resigning due to allegations of being too “pro-british”
HMS liverpool evacuated over 7000 residents to neighboring islands e.g. antigua + barbuda
british government enacted a scheme that allowed citizens from montserrat to claim residence in uk
case study: boxing day tsunami - mega-disaster
9.0 magnitude earthquake under the ocean + pressure buildup of 2 oceanic plates = significant impacts across indian ocean:
landscape impacts: smaller islands, fishing villages + coastal infrastructure destroyed. communications + electricity power lines cut, roads + rail destroyed. fires broke out due to severed water pipes. water too fast + strong to swim against + coastal ecosystems (mangroves + coral reefs) destroyed + polluted by waste
population impacts: estimated 250,000 killed, outbreak of disease e.g. cholera due to lack of freshwater supplies. lack of food as fish died + farms destroyed. thousands made homeless, as well as many losing jobs (thailand’s tourist hotels + fishing vessels destroyed).
RESPONSE:
immediate response: fresh water, water purification tablets, food, sheets + tents provided. medical teams + forensic scientists arrived. uk government promised £75million + uk public donations of £100million followed
long-term response: 2005 - £372million donated by uk public but only £128million spent by disasters emergency committee - on rebuilding. spent £40million on sri lanka + indonesia, £190million on building 20,000 houses. 2006 - set up the Indian Ocean Tsunami Warning System, educating citizens + local authorities on how to act for future events - but many suffer from PTSReactivity due to loss of family members
case study: eyjafjallajokull 2010 - volcanic eruption - vei 4
local impacts: 700+ locals evacuated, communications + transport disrupted - cost £12million to reconstruct, affected tourism, years worth of crops damaged = food shortages
international impacts: 48% of air traffic grounded for 8 days across europe, due to ash (water + silica) = lack of imported parts + materials impacted industry (apple - japan, nissan - uk). fresh produce couldn’t be imported (kenya suffered - 3000 tonnes of flowers destroyed - meant for international trade). many stranded worldwide. total losses (for airline industry) were around £1.1 billion - due to grounded flights.
RESPONSES:
regularly updated information sent from the icelandic meteorological centre to affected locals, airlines, persons of influences, governments etc. - to continue spread of info + coordinated responses
government rebuilt destroyed roads + infrastructure in under 2 months
redcross offered supplies + resources to affected individuals
icelandic tourism industry has exponentially grown since 2010 - partly due increased awareness of its natural beauty + attraction - due to coverage of event + environment has since grown back more fertile than ever (ash deposits). GDP + social recovery in iceland beyond stage 5 of the park model.
fracture zones
oceanic: belt of activity through the oceans, along oceanic ridges through africa, red sea, dead sea
continental: belt of activity through mountain ranges, across spain, alps, middle east, himalayas,
convection currents (only occurs in the asthenosphere)
heat from the inner core convects through mantle into asthenosphere
hot magma rises from outer core as it becomes less dense with heat
magma is cooler at the top of the mantle (further away from heat sources) - becomes more dense + sinks to the bottom
cooler magma is reheated + begins to rise again = convection current (loop)

crust
oceanic - thin, new, high density of rock, mainly basalt
continental - thick, old, low density of rock, mainly granite
denser plate subducts while the other is forced upwards
constructive plate boundaries ← →
oceanic + oceanic - magma rises in the gap left, forming new land = SEAFLOOR SPREADING - proves plate movement. as magma rises, less explosive underwater volcanoes are formed + ocean ridges. e.g. mid-atlantic ridge
continental + continental - any land caught in the separation forced apart = RIFT VALLEY (volcanoes forming where magma rises in the gap) this gap eventually fills with water + separates from main island. lifted areas = horst, valley = graben e.g. african rift valley
destructive plate boundaries → ←
oceanic + oceanic - heavier oceanic plate subducts, creating OCEAN TRENCHES, built up pressure leads to underwater volcanoes - bursting through the plate. this lava cools, forming ISLAND ARCS. e.g. alaska
continental + oceanic - denser oceanic plate subducts = deep OCEAN TRENCH, oceanic crust melts as it subducts into asthenosphere. extra magma, pressure builds forcing magma through weak areas. explosive, high pressure volcanoes erupt through the continental plate = COMPOSITE VOLCANOES. FOLD MOUNTAINS occur when sediment is pushed upwards during subduction e.g. andes
continental + continental - plates aren’t dense like oceanic, so pressure builds + no subduction occurs = pile up of continental crust on top of lithosphere = forming fold mountains e.g. himilayas, alps
conservative plate boundaries ↗↗ or ↗↙
no plates destroyed so no landforms are created. when plates move = pressure builds → oceanic crust displaces water + continental crust creates faultlines where movement occurs = earthquakes
examples include san francisco, san andreas fault
what proves plate movement?
seafloor spreading (magma rising between the gaps made by 2 oceanic, constructive plate boundaries) = as new rock forms + cools. the magnetic grains in the rock align with the poles (N+S) + switch periodically. when they switch, new rocks align opposite to the old rock - found by geologists.
ridge push
slope created when gravity acts on constructive plates at a higher elevation. gravity pushes plates further away, widening the gap = GRAVITATIONAL SLIDING
slap pull
when a plate subducts, the plate (older + denser) sinking into the mantle pulls the rest of the plate with it = causing further subduction
mechanisms that could cause plate movement
mantle convection - radioactive elements (from earth’s core) decay, producing thermal energy + convection currents
slap pull
however, tectonic movement isn’t fully understood - previously convection currents considered the primary cause, now slap pull is
key points of earthquakes
plates don’t fit perfectly - motions are not fluid so at all boundaries plates can become stuck due to friction
when these plates get stuck, convection currents in the mantle continue to push, building pressure = eventually, plates give way + released with sudden movement = JOLTING MOTION = seismic movement + shockwaves
focus/hypocentre is where earthquakes originates from - epicentre is directly above this
intensity decreases as you move further from the epicentre as waves lose energy, however impacts felt/damage will still vary
seismic waves - primary
travels through solids + liquids
compressional - waves vibrate in the direction in which they travel
vibrates in the direction of movement
travels at 4-8 km/s
shakes backwards + forwards, and through the interior of the earth alongside secondary
seismic waves - secondary
cannot travel through liquids
vibrate perpendicular to direction of travel
travels at 2.5-4 km/hr
one of the most destructive due to its large amplitude
seismic waves - love
near to ground surface
rolling motion - producing vertical ground movement + side to side
travels at 2-6km/hr
one of the most destructive due to its large amplitude
seismic waves - raleigh
vertical + horizontal displacement
travels 1-5 km/hr
compressional - waves vibrate in the direction in which they travel
case study: tohoku 2011 (9.1) - mega-disaster
context: japan is a highly developed with advanced tech, infrastructure + thriving economy + a multi-hazard zone. main cause was due to friction built up on a destructive plate margin = megathrust earthquake
primary impacts: groundshaking (damage to buildings) + landfall (beachfront dropped by >50cm)
secondary impacts: tsunami, 16,000 reported dead, power plant damage, $235 billion lost, 340,000 displaced, 300 hospitals damaged + roads/trains destroyed
immediate response: warned about tsunami 3 mins post earthquake, scientists PREDICTED, search + rescue workers + 100,000 japanese self defense force dispatched within hours + sniffer dogs. international aid, evacuation zone was declared around the damaged powerplant - those nearby given iodine to reduce radiation risk = PROTECTION. restricted access to muddy/debris areas + many checked for radiation levels
long-term responses: budget of £190 billion to recover over 10 years, coastal protection, prioritised rebuilding + improving the economy, restored all water + electricity - end of 2011.
were they prepared? yes, with aseismic building codes, early warning systems, and education + drills for schools, offices + public areas = saved lives + reduced damages
why did they struggle? large elderly population - so slower at running/swimming/evacuating, with many “set in their ways” and unprepared for tsunami + the nuclear crisis
case study: kiribati - sea level rising
context: in danger of becoming uninhabitable due to climate change - requiring global solutions to fix (have joined Paris Agreement + COP26). LIC (average citizen makes £3000 a year) - can’t fund projects. highest point is only 81m above sea level. 110,000 residents about to become climate refugees - primarily to new zealand, but first to the capital tarawa.
challenges they face:
global warming = sea level rising as glaciers melt, severe coral bleaching due to ^ = damage to delicate biodiversity,
warmer oceans lead to violent + regular tropical storms = socioenvironmental consequences + hinders further development.
mass migration to south tarawa = overpopulation, spread of disease, pollution + poor sanitation
deforestation of coastal mangroves increases vulnerability BUT allows fishing.
locals rely on subsistence farming - so both incomes + livelihoods destroyed.
how are they managing? they are evacuating, local government are dredging islands + considering elevated roads to adapt to flooding + accessibility
now, kiribati has become allies with china to help develop + manage climate change - using chinese funding to build large-scale infrastructure e.g.the elevated roads to work against sea level. however, some argue they may fall into “debt traps”, unable to pay off loans - giving up kiribati’s control 3.5 million km of ocean.
waves
as all waves move at differing speeds, they hit a location at different times - felt by survivors like aftershocks.
secondary hazards of earthquakes
soil liquefaction - impacts poorly compacted sand + silt as moisture separates from soil + rises as water to surface = soil behaves like a liquid = building subsidence + gradual sinking. e.g. japan 2011, christchurch 2010
landslides - earthquakes’ shaking can weaken or damage cliff faces, hills + snow = unconsolidated material collapses. landslides can travel several miles + accumulate material on the way. risk varies with topography, land use, soil, rainfall. e.g. haiti 2010, nepal
tsunamis - ocean crust jolted during earthquakes = water is displaced upwards + pulled back down by gravity = energy transfers to water + travels through like a wave. water travels fast with a low amplitude, as it reaches the coast, sea level decreases so friction between seabed + waves = waves slow down while gaining height creating a wall of water (average 10ft - can reach 100ft). usually found in subduction zones at a destructive plate margin + felt most by asia + australia. e.g. boxing day tsunami 2004, tohoku
shockwaves - low level earthquakes follow e.g. japan 2011, haiti
primary hazards of volcanoes - all fast speed of onset
lava flows - streams of lava erupt onto earth’s surface - can be fast flowing = dangerous (based on viscosity) e.g. hawaii, DRC
pyroclastic flows - mix of hot dense rock, lava, ash, gases = move very quickly across surface, high speed = dangerous + can cause asphyxiation e.g. montserrat 1997, mt. st helens
tephra + ash flows - when volcanic rock + ash blasted into air = damages buildings, which can collapse under weight of this material e.g. iceland 2010, pinatubo 1991
volcanic gases - such as sulphur dioxide + carbon monoxide, released into atmosphere - can travel long distances due to potency e.g. DRC, lake nygos (cameroon) - 1986
secondary hazards of volcanoes
lahars - mix of rock, mud + water = travels quickly down the side of a volcano - occurs when heat of eruption causes snow/ice to melt OR when eruption occurs during heavy rainfall e.g. nevada del ruiz, mount pinatubo 1991, japan - mt. fuji, mt. st helens
jokulhaups - snow/ice in glaciers melt after an eruption - causing sudden floods - can be dangerous e.g. iceland 2010
acid rain - when gases (e.g. sulfur dioxide) are released into the atmosphere, harming plants + structures
tectonic classification theory
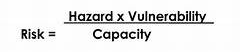
disaster = serious disruption of the community/society involving human, material, economic or environmental loss that exceeds the affected’s ability to cope with its own resources
disaster risk is calculated using this equation. a place is high risk if:
capacity to cope is low
vulnerable to hazards
hazard - large/high intensity
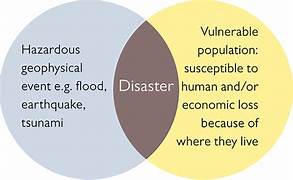
degg’s model
hazard ≠ natural disaster - instead, disasters only occur when a vulnerable population (one that’ll be disrupted/damaged) is exposed to a hazard. therefore, if an invulnerable population experiences a hazard, it is not a disaster.
definition of hazards/disasters are not agreed upon
different organisation define hazards/disasters differently e.g.UN office for Disaster Risk Reduction (UNISDR) defines disasters as a serious disruption of a community involving widespread loss which exceeds their ability to cope alone. whereas, some classify hazards based on:
volume of people affected (international disaster database- 100+ affected or 10+ dead)
economic cost of the disaster - jobs lost, cost of repairs etc. UN sendai framework aims to reduce economic losses of disasters (established after huge economic losses in tohoku 2011)
comparing tectonic disasters to previous events with predictions based on averages for the location - not reliable due to megadisasters
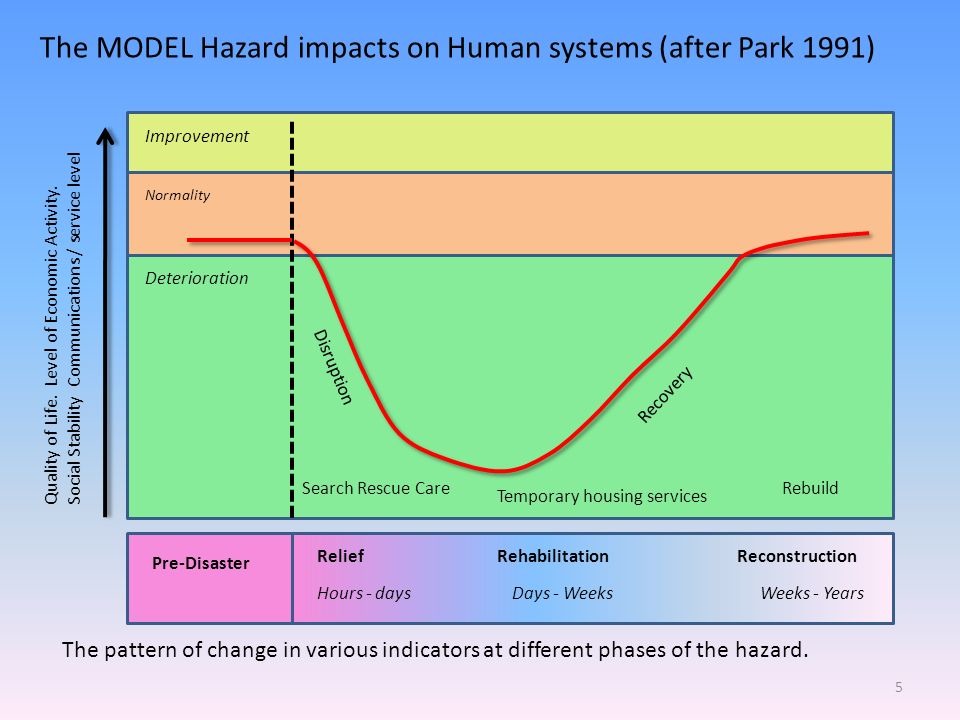
park model - depicts human responses to hazards
park model works as a control line to compare hazards, where:
steepness of the curve - how quick an area recovers/deteriorates
depth of the curve - shows the scale of the disaster
stage 1 - relief (hours-days): immediate local response - aid and search + rescue and immediate appeal for foreign aid
stage 2 - rehabilitation (days-weeks): services restored, temporary shelters open + hospitals, food + water distributed, coordinated foreign aid
stage 3 - reconstruction (weeks-years): restore area’s crops, ecosystem, infrastructure to the same quality or better + develop mitigation plans for future
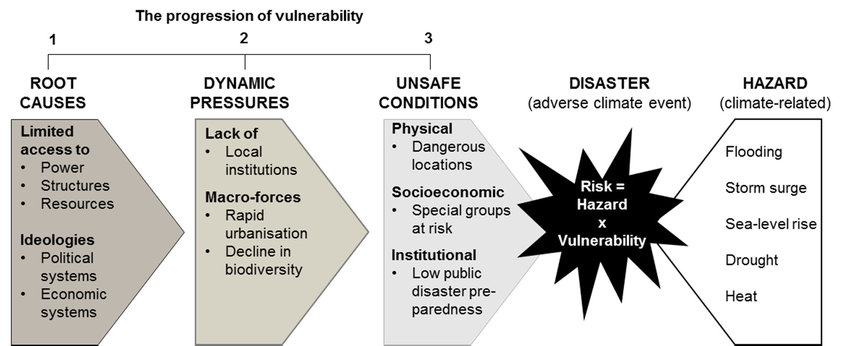
pressure + release (PAR) model
PAR model is used to analyse factors which cause a population to be vulnerable to a hazard. PAR model is complex, as factors are interconnected + hard to measure. the idea is that if we can reduce the social factors, there is a reduction of pressure + vulnerability (whether physical, economic, social, environmental or knowledge-based)
root causes - often caused by economic, demographic or political processes - impacting populations. examples include weak governance, mismanagement by industry, NGOs/IGOs, high reliance on products impacted by hazards e.g. local agriculture or imports near volcanoes
dynamic pressures - local economic or political factors - affecting a community or organisation. examples include lack of training/knowledge within locals, rapid urbanisation, poor communication between government + locals, degradation of natural environment (mangroves), lack of basic services (health, education, police)
unsafe conditions - physical conditions that affect an individual. examples include lack of infrastructure, dangerous location of settlements, no warning system for locals, disease/fires - spreading through households
PAR model suggests that a series of these factors lead to a population’s vulnerability.
characteristics of a tectonic hazard profile - help decision-makers decide where to place human + financial resources
frequency
magnitude
duration
speed of onset (warning time)
fatalities
economic loss
spatial predictability
hazards are very unpredictable, making models inaccurate in representing human responses to hazards.
questions to consider when evaluating these models:
does this apply to every hazard?
what is the timeframe?
is it up-to-date?
should models be more complex or more vague?
tectonic events can be measured by:
volcanic explosivity index - measures the relative explosiveness of a volcano, based on height + duration, using a logarithmic scale of 1-8
modified mercalli scale - measures the destructiveness of an earthquake, relative scale + subjective - based on movement felt (I-XII), does not consider social, economic or environmental impacts
moment magnitude scale - measures energy released by an earthquake (0-9), simple system + social/economic/environmental impacts can be inferred
richter scale - measures the amplitude of the waves, most used scale - ABSOLUTE. social/economic/environmental impacts can be inferred, logarithmic - but highest reading ≠ worst disaster
response to volcanic hazards
prevention - tectonic hazards cannot directly be prevented, instead prevent the RISK e.g. stop building near volcanoes
preparedness - monitoring, educating locals, evacuation plans, training response teams
mitigation - direct intervention e.g. diverting lava, or strengthening at-risk buildings, evacuation zones, emergency aid + rescue
adaptation - relocate, capitalise on opportunity e.g. tourism (eyjafjallajokull 2010), change profession
prediction of hazards
earthquakes - cannot accurately predict, instead forecast the risk based on statistics - global seismic monitoring + historical records + feeling tremors
volcanoes - somewhat predictable + accurate - monitor volcanoes by noticing changes to the tilt + top surface as this changes as magma builds
hazard management cycle - for all hazards
preparedness - ready for an event to occur - public awareness, education, training, developing warning systems + preparation plans, stockpiling aid, food + water
response - the immediate action after a hazards has taken place - evacuation, medical assistance, rescues, restoring water + electricity, restoring healthcare services
recovery - long-term responses - restoring services, reconstruction of homes + infrastructure, reopening schools + businesses
mitigation - strategies to lessen the impact of future hazards - barriers, warning signs, observatories, land use zoning, building codes + regulation, protective defenses (tsunami wall)
management approaches: modify the event
cannot control seismic activity, instead control buildings - e.g. aseismic infrastructure for earthquakes
micro: strengthening individual buildings
macro: large-scale + protective measure to protect communities
land use zoning - preventing building in high-risk areas = low cost + reduces vulnerability BUT stops economic development on high value land + strict enforcement required
resistant buildings - deep foundations, sloped roofs, springs help prevent collapsing - protecting people + property BUT high costs so low income citizens cannot afford
tsunami wall - stops waves from travelling inland - reducing damage + provides security BUT very high costs, can be overtopped + deemed unattractive
lava diversion - barriers + water cooling to divert and slow down lava, low cost BUT only works for low VEI lava
management approaches: modify the vulnerability
high-tech scientific monitoring - monitors volcanic behaviour + can predict eruptions sometimes = warning + education saves lives BUT costly so LICs don’t monitor + this method does not prevent property damage
community education - low cost +implemented by NGOs + saves lives BUT doesn’t prevent property damage + hard to implement in isolated/rural areas
adaptation - relocating - saves lives + property BUT cannot be done with high population densities + disrupts lives
management approaches: modify the loss
short term aid - reduces death toll + keeps people alive until long-term aid arrives BUT high costs + difficult in rural areas, emergency services are limited + poorly equipped in LICs
long term aid - reconstruction improves resilience through future land use planning BUT high costs + forgotten by media quickly
insurance - compensation for loss - allowing people to recover economically BUT does'n’t save lives + many don’t have insurance
importance of stakeholders
the role of communities - local recovery operations, clear debris, set up temporary shelters = importance
the role of NGOs - provide funds, coordinating rescue efforts, develop reconstruction plans. TNCs may work with NGOs for charity events
development + governance
some government may choose to invest in development + economic growth instead of hazard mitigation - making population more vulnerable to hazards
risk poverty nexus
poverty is a factor + consequence of natural hazards as low income populations are more affected by natural hazards.
communities can face inequalities such as:
asset inequality - housing, security of tenure + agricultural productivity
political inequality - certain people hold more influence + power - usually the wealthy + elite
social status inequality - linked to space but links to regular income + access to services
entitlement inequality - unequal access of public services, welfare + rule of law
factors that can contribute to an area’s vulnerability
unstable political governance - impacts preparedness + recovery efforts
population density - harder to control as it increases + aging population
isolation/accessibility - poor transport links which impacts rescue efforts
level of urbanisation - higher population density + infrastructure so impacted more + urban sprawl
environmental degradation
aging infrastructure
presence of warnings + emergency response systems + government disaster assistance programs
insurance, or lack thereof
economic wealth
role of governance
meeting basic needs - when met, population is less vulnerable to secondary hazards e.g. disease
planning - reduces risk
education - raising awareness = prepared population
corruption - vulnerability increases with a corrupted government as important investment in services/hazard mitigation is being used elsewhere
mega-disasters
affects a large population or large area
hazard management is made less effective
scale of the impact - requires international support + aid
low in probability
often interrupts international business e.g. tohoku 2011 - TNCs e.g. Toyota + BMW operate/source products in japan - lost potential revenue OR 2011 eyjafjalljokull - ash clouds cause significant disruption of air travel - halt of goods + trade into the EU e.g. flowers from kenya could not be transported
case study: haiti 2010 earthquake - “one of the worst disasters of our time” (7.1)
context: haiti is an LIC, with a history of national debt, prejudicial trade policies, corrupt governance + foreign intervention into national affairs = pre-existing poverty (77% live on less than $2/day) + poor housing conditions, healthcare + sanitation = increased the death toll. haiti is also located on a plate margin, with limited accessibility (hilly topography), = experiences extreme weather conditions often = multi-hazard zone
primary impacts:
deaths toll between 100,000-160,000, yet government claims 220,000-316,000 - corruption/deceit
250,000 residencies destroyed essential services + communication cut out
$8.5 billion in damages - 90% of gdp
2 million displaced
secondary impacts:
rivers became polluted + toxic
cholera outbreak in 2010 - due to unsanitary conditions
prison was damaged - outbreak of >4000 criminals = widespread violence + crime
immediate responses:
many responded to aid appeals - 4 million received food, 1.5 million received emergency shelter materials + most-watched telethon “hope for haiti now” - received $58 million
search + rescue teams, medical aid + engineers
long-term responses:
environmental clear up + regeneration of ecosystem
$13.5 billion pledged - yet some went missing (corrupt)
2020 - new strategic framework for disaster management - supported by UN
haiti is the poorest country in the western hemisphere - so it relied on this aid for years to come - still not fully recovered
case study: christchurch earthquake 2011 (6.3)
the earthquake was caused by a 15km long fault rupture along the southern edge of the city + fault slopes southward beneath the port hills + new zealand lies along a destructive plate boundary (australian + pacific) + was 10km from CBD
short term impacts: 185 killed, 6654 with major injuries, heritage sites damaged, soil liquefaction on eastern part of the city (built on a swamp) → buried property + sewage floods
long term impacts: power outages, port + roads damaged so vehicles stranded, schools closed, the city centre was rubble
prior to the earthquake, the canterbury plates hadn’t experienced a major earthquake in thousands of years → unprepared as a previously unknown fault ruptured = no prior management
response: government activated national crisis management immediately + declared a national state of emergency. 75% of the electricity was restored within 3 days. the CBD remained closed for 2 years. water + sewage took years to restore in liquefied areas. support subsidies helped companies to operate + paid for staff’s wages.
governance: declared a national state of emergency + the first time since the civil defence emergency management act 2002. local, national + regional government came together to provide a single unified response.
other factors that influenced vulnerability: prior earthquake in 2010 weakened buildings + many central buildings are old, earthquake happened at lunchtime in a densely populated area → increases impact. however, nz is a developed country, so they could afford to rebuild
case study: mount merapi, indonesia 2010 - volcanic eruption
located on a destructive plate boundary → subduction occurred
composite volcano with VEI 4
impacts: 353 deaths, 500 injuries, 350,000 evacuated prior to eruption, $0.6billion in losses, rice harvest loss → food insecurity, pyroclastic flows
case study: nepal (gorkha) earthquake 2015 (7.8)
context: nepal sits on a destructive plate boundary → lies in a highly active seismic region. human and property impacts were reduced as it occurred at 11:56am (many people were working outside). however, it is a mountainous region - so avalanches occurred.
short-term impacts: 8964 deaths, 21,952 injured, 3.5mil made homeless, historic sites destroyed - impacting tourism, damaged roads + communications
long-term impacts: earthquakes lead to an increase in human trafficking, labour costs, + availability, reduced tourism, spread of disease
prior management: had a low standard of living - generally poor + minimum development. recent high population growth = unprepared, no aseismic infrastructure, no evacuation plans+ largely relied on international aid
responses: nepalese army sent to stricken areas, international aid sent via red cross + medecins sans frontieres to medically evacuate citizens. emergency workers dug out those trapped in rubble. $230million raised internationally + $1bil from india
governance - was this worsened by poor management?: international conflicts for development + peace, political instability, corruption, lawlessness, lack of accountability. quick response + large-scale relief operation with support from humanitarian partners
other factors impacting the area’s vulnerability: nepal is very poor + politically paralyzed, with heavy monsoons + steep terrain + many remote areas, experiences low standards of living, relies on aid, poor infrastructure = collapsed
factors that contribute to a country’s resilience to hazards
increasing resilience:
low doctor to patient ratio, positive attitude of people, wealth of a nation, preparations, emergency procedures, medical services + supplies available, good communications, open political regime
decreasing resilience:
lack of revenue. large-scale rural-urban migration, unrealistic perception of the disaster (sometimes thought as an act of god), unequal trade agreements, lack of skills, rapid population growth, environmental degradation, foreign debt repayment
world risk index
defines the relationship between a natural hazard + vulnerability.
japan is considered one of the most exposed countries to earthquakes → but it isn’t the most vulnerable, as japan is a developed country with earthquake drills + management systems e.g. aseismic infrastructure
whereas, haiti is less exposed but more vulnerable as a low income country that experiences corruption = reliant on aid = DISASTER RISK POVERTY NEXUS (strong link between poverty + the impact of a hazard)