Unsupervised Learning
1/57
Earn XP
Description and Tags
Complete for lecture slides, does not include reading material on association rule mining
Name | Mastery | Learn | Test | Matching | Spaced | Call with Kai |
|---|
No analytics yet
Send a link to your students to track their progress
58 Terms
what is machine learning
the ability to simulate human learning - learning from past behaviours, past historical data
what are the types of machine learning
supervised learning
unsupervised learning
reinforcement learning
what is unsupervised learning
data is unlabelled and the algorithm tries to find patterns and relationships in the data
what is reinforcement learning
the algorithm interacts with the environment by taking actions to maximise rewards and minimise punishment signals (not labelled output)
what are the types of unsupervised learning methods
clustering
dimensionality reduction
association rules
what is dimensionality reduction
(e.g. PCA) - reduce the number of inputs to a smaller number for a system
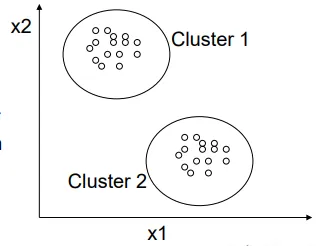
what is clustering
to partition a data set into subsets (clusters), so that the data in each cluster share some common trait - often similarity or proximity for some defined distance measure.
most commonly used unsupervised learning method
what is a cluster
a collection of objects similar between them, and dissimilar to objects belonging to another cluster
what are patterns
a physical object, or a data point
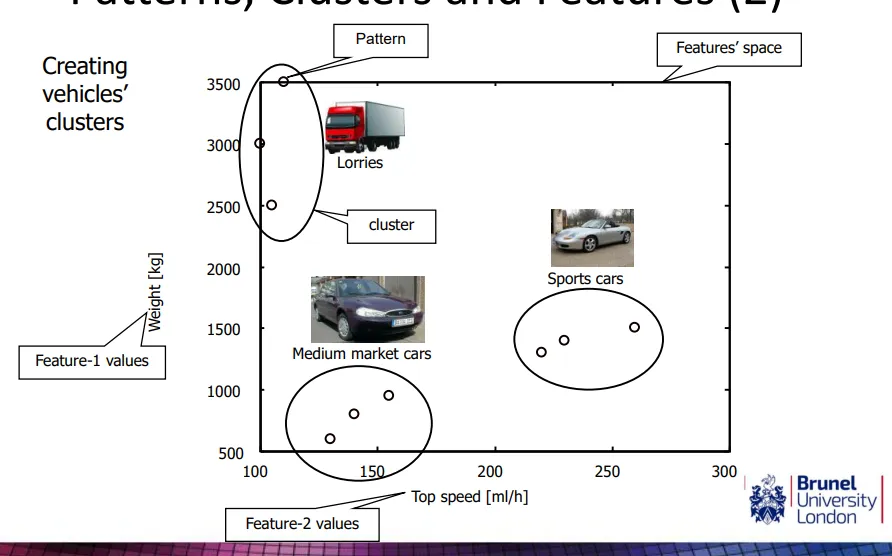
how are patterns represented
as feature vectors: a d-dimensional array where each dimension/element in the array is a feature
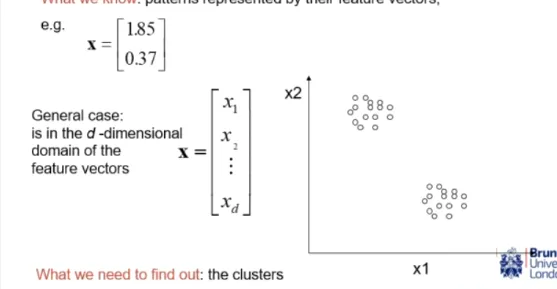
what are features
an attribute of an object

what are the uses of clustering
social networks - Facebook friends for who communicates the most for marketing, terror networks, allocation of company resources
customer segmentation - clustering supermarket customers to target ads
gene network - understanding gene interactions, identifying genes linked to disease | human genome project in 90s causing clustering boom
how does clustering work
an algorithm is used to group data points together based on pattern similarity
how can we calculate pattern similarity
distance metrics (most common)
what are the different distance metrics
Euclidean
Manhattan
Correlation
Minkowski
Mahalanobis
what is Euclidean distance
the shortest distance between two points. all features have the same weight, but IRL one feature may be more relevant
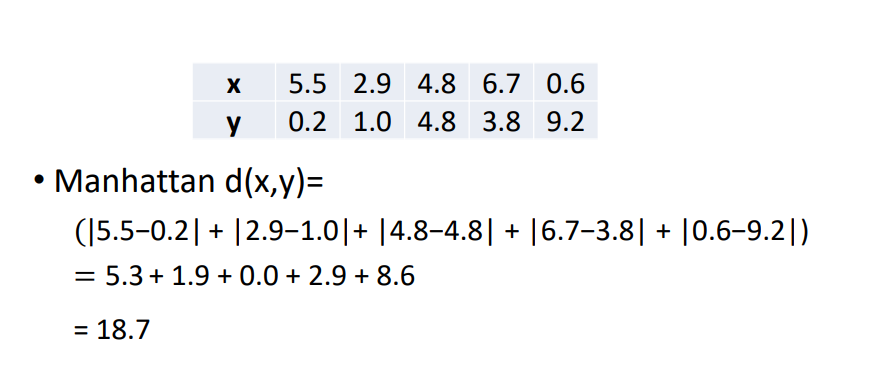
what is Manhattan distance
the sum of the absolute differences between points across all dimensions
what is correlation
metric using categorical data (not relying on numeric data e.g. if X bought this, will they buy that)
what is Minkowski distance
a generalisation of Euclidean distance, takes into account different weighting of features
what is Mahalanobis distance
used in finance / fraud detection, accounts for outliers in the data and anomaly detection
how do you calculate Euclidean distance
Pythagoras theorem - when given a matrix, each row is a pattern, and each column is an attribute. to get the distance between 2 points, need to look at 2 rows at a time only.

how do you calculate Manhattan distance
calculate the difference between each feature and sum them together
how do we choose a similarity metric
application dependant
determine whether shape / distance / scale as more important metric
what are the different clustering algorithms
k means clustering
hierarchical clustering
fuzzy clustering
DBSCAN
how does k-means clustering work
Place K points into the feature space. These points represent initial cluster centroids.
Assign each pattern to the closest cluster centroid.
When all objects have been assigned, recalculate the positions of the K centroids.
Repeat Steps 2 and 3 until the assignments do not change.
what are the pros of k-means clustering
if K is small, computationally faster than hierarchical clustering
may produce tighter clusters than hierarchical, especially if clusters are globular (naturally round globs in the data space)
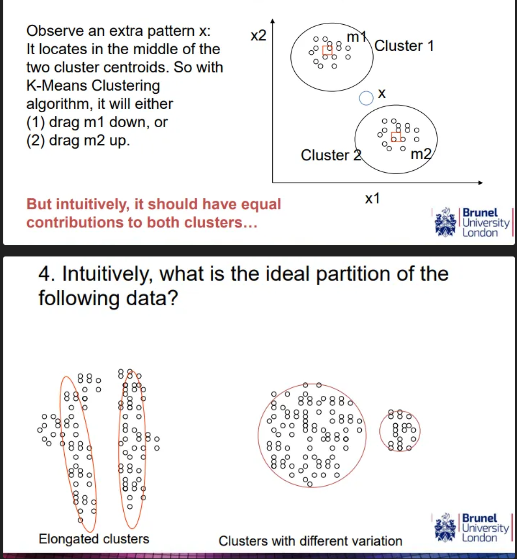
what are the cons of k-means clustering
requires k to be known - hard to determine what K should be
the randomly selected start centroids has impact meaning different initial partitions can result in different final clusters
Does the algorithm converge to the same results with different selections of initial cluster centroids? If not, what should we do in practice?
for real world dataset - usually not
potential to create empty clusters (not always bad)
hard assignment - data points can only be assigned to 1 cluster
in real life applications might not always have sharp boundary between clusters
does not work well with elongated or different variation clusters that are non-globular
what is hierarchical clustering (Agglomerative)
Agglomerative = bottom-up approach
creates a hierarchy of clusters where each pattern is originally in its own cluster, and intermediate clusters are created before finally merging into 1 cluster - producing a dendrogram as the output. It doesn’t need k to be defined.
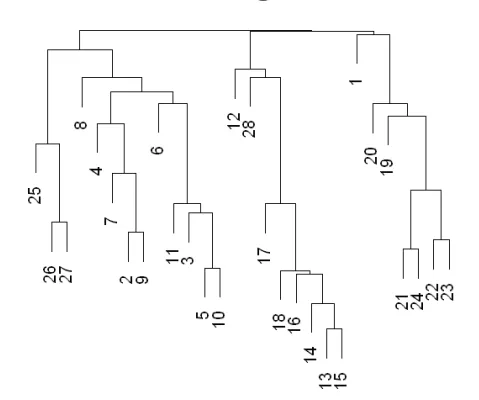
what is a dendrogram
a tree structure that shows the hierarchical relationship between objects
how is a dendrogram used
shows us all the possible clusters as opposed to a specific set of clusters
cutting the tree creates clusters (any number of clusters, just filter the output to however many clusters is needed, no need to rerun outcome)
cutting higher up - less clusters
cutting lower - more clusters
how does the hierarchical clustering algorithm work?
*requires computing the distance between every cluster and every other cluster
Each item is assigned to its own cluster (n clusters of size one)
Let the distances between the clusters equal the distances between the objects they contain
Find the closest pair of clusters and merge them into a single cluster (one less cluster)
Re-compute the distances between the new cluster and each of the old clusters
Repeat steps 3 and 4 until there is only one cluster left
how do we re-compute distances between clusters
when a cluster contain only 1 initial data point
use Euclidean distance for initial data points
when a cluster contain more than 1 data point
single / complete / average linkage
Ward, McQuitty, Median, Centroid metrics
what is single linkage
The smallest distance between any pairs from the two clusters (one from each) being compared/measured

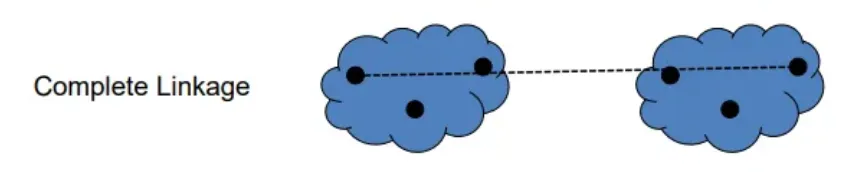
what is complete linkage
the largest distance between two pairs from the two clusters (one from each) being measured
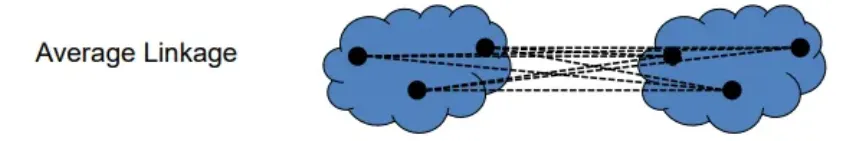
what is average linkage
the average distance between pairs
what are the pros of HC
Can produce an ordering of the objects, which may be informative for data display.
Smaller clusters are generated, which may be helpful for discovery.
what are the cons of HC
No provision can be made for a relocation of objects that may have been 'incorrectly' grouped at an early stage because unlike k-means, clusters do not change (local greedy search)
Use of different distance metrics for measuring distances between clusters may generate different results.
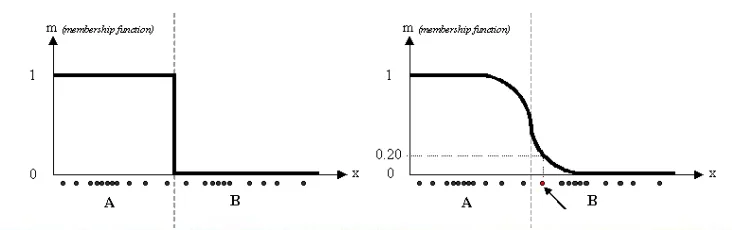
what is fuzzy c-means clustering
fuzzification of k-means where data points do not have a hard assignment / sharp boundary between clusters
how does fuzzy clustering work
an item’s cluster membership is a weight between 0 and 1 (instead of 1 or 0 to show membership or non-member)
distance to a centroid is multiplied by membership weight
what is DBSCAN
a density based clustering algorithm
divides the data set into dense regions (considered clusters) separated by sparse regions
what parameters are needed for DBSCAN
MinPts - specifies the minimum number of points required to form a dense region
Epsilon - defines the radius of the neighbourhood around a given core point, the maximum distance between two points for them to be considered part of the same neighbourhood/impacts size of the circle searching for points
density - number of points within a specific radius
core point - the interior of a cluster
what is DBSCAN used for
clustering regions in an image
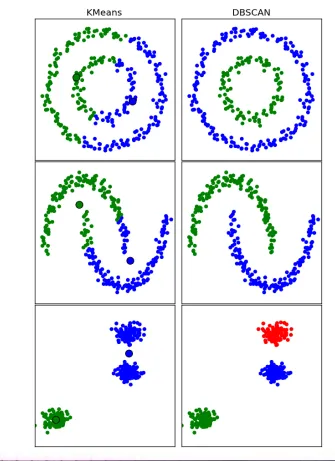
how does DBSCAN work
randomly picks a point in the space as center
draws the circle around the center point and checks num of points within (density)
If data points were found, use boarder point as center and redraw radius to neighbouring points
when it can no longer expand, choose a new starting point at an unclustered data point
Clusters can only be created if they have > minPts
how can we evaluate cluster quality
using different metrics for different methods
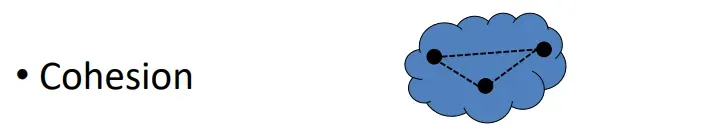
cohesion
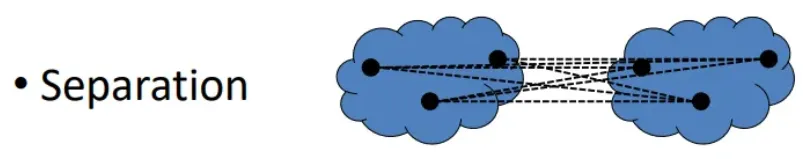
separation
using a supervised approach
what is cohesion
similarity within a cluster
what is separation
distance between clusters
how can we use a supervised approach
when we know something about the ‘true’ clusters, we compare the clustering arrangement to the true clustering arrangement to determine how good the output clusters are.
used when developing and testing new clustering algorithms
how can we compare clustering arrangements
do human verification of clusters for low dimensional data using guesses or expert knowledge
using metrics like weighted-kappa
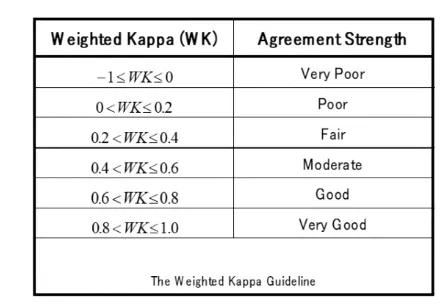
what is weighted-kappa
using 2 different clustering algorithms and seeing how similar they both are, good kappa score means more similar algorithms
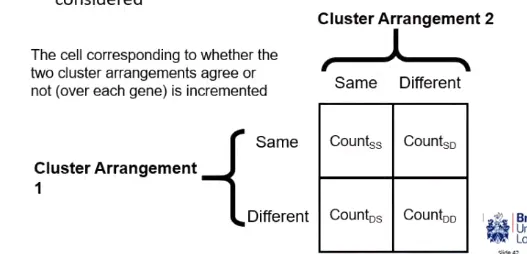
how does weighted-kappa work
uses a 2x2 contingency table where all unique pairs of genes are compared and considered (n(n-1)2 comparisons)
for each pair, have they been clusters in 1 arrangement, and have the same pair been clustered in the 2nd arrangement (we want pairs clustered in the expert arrangement to also be clustered in the new arrangement and vice versa)
can convert the contingency table to a number - agreement strength
what is the outcome of comparing clusters
similar clustering arrangements = more consistent clustering method
what is association rule mining
methodology to discover relationships between large data sets in the form of association rules, developed for shopping basket data
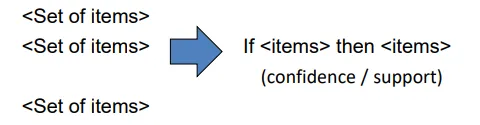
what are association rules
the if-then statements that shows the probability of a relationship between items in a large data set e.g. relationship between different items being bought in a single transaction
what are the association rule mining parameters
support
confidence
lift
don’t need to know formula - just understand how it works
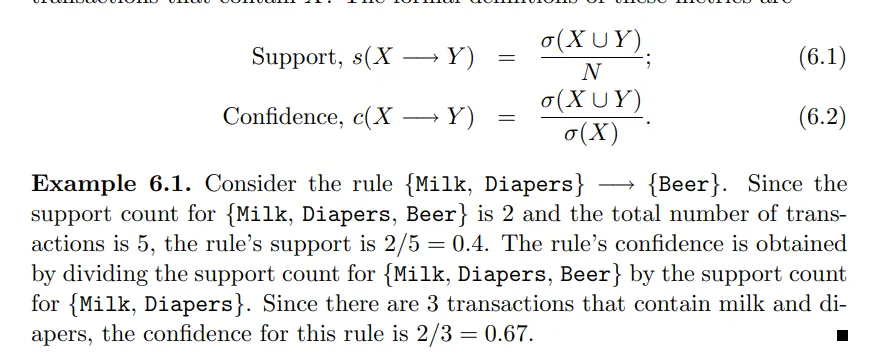
what is support
how often a rule is applicable to a given data set
Freq(x,y) / N

what is confidence
determines how frequently items Y appear in transactions that contain X
measures reliability of the inference made by a rule, estimate of conditional probability
Freq(x,y) / freq(x)
Freq = support
what is lift
How much more frequency the Y item is found in transactions with X compared to transactions with Y only
Confidence(x,y) / support(y)
E.g. people that buy X are Z times more likely to buy Y
what are the applications of association rule mining
relates easy interpretation and actionable insights
e.g. Spotify - users that listened to X songs might also enjoy Y songs
e.g. placing items in a certain way in a store to maximise the rules placing items closer together
middle rules - surprising rules like nappies + beer
recommender systems for Netflix or amazon