ECON 2301 Final Exam Flashcards
1/127
Earn XP
Description and Tags
Name | Mastery | Learn | Test | Matching | Spaced | Call with Kai |
|---|
No analytics yet
Send a link to your students to track their progress
128 Terms
Economics may best be defined as the
social science concerned with how individuals, institutions, and society make optimal choices under conditions of scarcity.
A recurring theme in economics is that people
have unlimited economic wants but limited resources.
The division of labor means that
workers specialize in various production tasks.
Macroeconomics approaches the study of economics from the viewpoint of
the entire economy.
Which of the following is NOT a factor of production?
money
In the circular flow model of the market system, households' major role is to
buy products and sell resources.
The opportunity cost of constructing a new public highway is the
value of other goods and services that are sacrificed in order to construct the new highway.
The alternative combinations of two goods that a consumer can purchase with a specific money income is shown by
a budget line.
A point or product-combination to the left of (or inside) a budget line
is attainable, but a combination or point to the right of the line is unattainable.
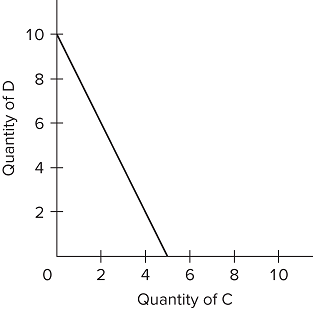
Refer to the budget line shown in the diagram. The value of the slope of the budget line is negative
two
Assume that a consumer has a given budget or income of $12 and that she can buy only two goods, apples or bananas. The price of an apple is $1.50 and the price of a banana is $0.75. If the consumer decides to buy 4 apples, how many bananas can she also buy with the remainder of her budget, assuming she exhausts her income?
8 bananas
A production possibilities curve shows
the maximum amounts of two goods that can be produced, assuming the full use of available resources.
A point inside the production possibilities curve is __________, while a point outside the curve is __________.
attainable; unattainable
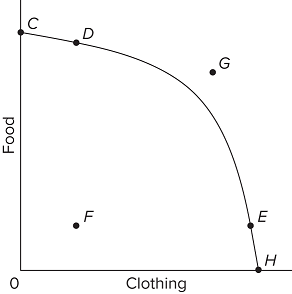
Refer to the provided graph. Which of the following statements about combination G is true?
The nation may not be able to produce combination G, but it can consume that combination if it specializes and trades with other nations.
Refer to the table above. Suppose that the amount and quality of resources are the same in both countries. We can conclude that
Herbania has absolute advantage in the production of civilian goods.
Which of the following will shift the production possibilities curve to the right?
a technological advance that allows farmers to produce more output from given inputs
If Japan has a comparative advantage over Canada in the production of computers, which of the following must be true?
Japan has a lower opportunity cost in the production of computers.
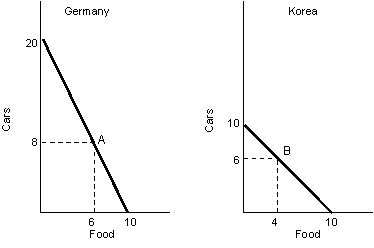
The figure given below represents the PPC in two nations - Germany and Korea, producing only two goods, cars and food. Identify the correct statement.
Germany has comparative advantage in the production of cars.
Suppose France can produce 90 tons of potatoes or 30 tons of lemons per day, and that Italy can produce 30 tons of potatoes or 30 tons of lemons per day. Which of the following statements in this context is true?
Italy would be willing to trade one ton of lemons for anything greater than one ton of potatoes.
Which of the following is a normative economic statement?
The government needs to revamp the Social Security program to make it sustainable.
The law of demand states that, other things equal,
price and quantity demanded are inversely related.
The law of supply indicates that, other things equal,
producers will offer more of a product at high prices than at low prices.
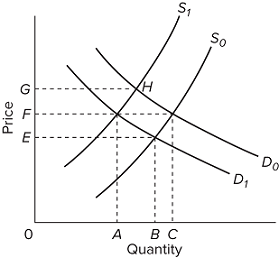
Refer to the diagram, which shows demand and supply conditions in the competitive market for product X. If the initial demand and supply curves are D0 and S0, equilibrium price and quantity will be
F and C, respectively.
At the current price, there is a shortage of a product. We would expect price to
increase, quantity demanded to decrease, and quantity supplied to increase.
An effective price floor will
result in a product surplus.
If the market price is above the equilibrium price,
a surplus will occur and producers will produce less and lower prices.
All of the following statements describe a market economy EXCEPT
government prescribes the market prices for goods and services.
If products C and D are close substitutes, an increase in the price of C will
shift the demand curve for D to the right.
If the price of gasoline increases significantly, then we'd expect the demand curve for large trucks and SUVs to
shift to the left.
An improvement in production technology will
shift the supply curve to the right.
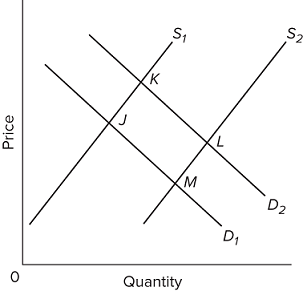
Refer to the diagram, in which S1 and D1 represent the original supply and demand curves and S2 and D2 the new curves. In this market
demand has increased and equilibrium price has decreased.
If the supply and demand curves for a product both decrease, then equilibrium
quantity must decline, but equilibrium price may rise, fall, or remain unchanged.
Economists calculating a country's GDP can avoid multiple counting by
only counting final goods.
GDP tends to underestimate the productive activity in the economy because it excludes the value of output from
the underground economy.
Which of the following best measures improvements in the standard of living of a nation?
growth of real GDP per capita
Which of the following is NOT a component of GDP in the expenditures approach?
workers' wages and other compensation
Net exports is a positive number when
a nation's exports of goods and services exceed its imports.
The expenditure approach to calculating GDP measures it by summing up
the total spending for consumption, investment, net exports, and government purchases.
Refer to the accompanying data (all figures in billions of dollars). GDP is
$121.
Value added can be determined by
subtracting the purchase of intermediate products from the value of the sales of final products.
Refer to the table. Between years 1 and 2, real GDP grew by __________ percent in Alta.
5
Nominal GDP is adjusted for changes in the price level using
a price index, called the GDP deflator.
In the economy described in the table, real GDP for year 3 is
$480.
The base year of the price index given in the accompanying table is
Year 1.
Refer to the table. GDP figures are in billions of dollars. What was real GDP in Year 2 (rounded to the nearest dollar)?
$4,911 billion
Human capital refers to the
education, training, and skills of workers.
A nation's real GDP will increase by increasing the following, except
average price level.
Economic growth can best be portrayed as a
rightward shift of the production possibilities curve.
Growth-promoting institutions include the following, EXCEPT
protection of domestic firms from foreign competitors.
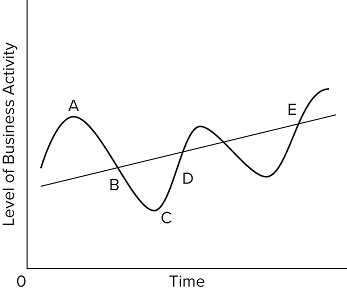
In the accompanying diagram, the phases of the business cycle from points A to D are
peak, recession, trough, expansion, respectively.
In the United States, business cycles have occurred against a backdrop of a long-run trend of
rising real GDP.
A recession is a decline in
real GDP that lasts six months or longer.
In which phase of the business cycle will the economy most likely experience rising real output and falling unemployment rates?
expansion
The labor force includes
employed workers and unemployed persons who are actively looking for work.
The table contains labor market data from a hypothetical country. All figures are in millions. Calculate the unemployment rate (rounded to the nearest tenth of a percent).
6.9 percent.
Which of the following constitute the types of unemployment occurring at the natural rate of unemployment?
structural and frictional unemployment
Unemployment involving a mismatch of the skills of unemployed workers and the skills required for available jobs is called
structural unemployment.
Assume that Kyle is temporarily unemployed because he has voluntarily quit his job with company A and will begin a better job in two weeks with company B. Kyle will be considered as
frictionally unemployed.
The type of unemployment associated with recessions is called
cyclical unemployment.
The fact that there are discouraged workers
may cause the official unemployment rate to understate the true amount of unemployment.
Inflation means that
prices on average are rising, although some particular prices may be falling.
If the Consumer Price Index for a certain year is 120, this means that the average price of consumer items in that year was
20 percent higher than the average price in the base period 1982–84.
Core inflation measures
underlying increases in the CPI after removing volatile food and energy prices.
Suppose that lenders want to receive a real rate of interest of 5 percent and that they expect inflation to remain steady at 2 percent in the coming years. Based on this, lenders should charge a nominal interest rate of
7 percent.
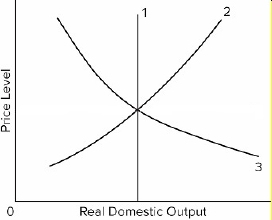
The labels for the numbered curves in the diagram above, in the correct order, are:
LRAS, SRAS, AD.
The short-run aggregate supply curve shows the
direct relationship between the price level and real GDP produced.
The intersection of the aggregate demand and the aggregate supply curve defines the equilibrium level of _____ and the price level.
real GDP
Equilibrium in the long run occurs when
AD intersects the short-run and the long-run AS curves at the same point.
The economy enters the long-run once
sufficient time has elapsed for wage contracts to expire and nominal wages to adjust to price level changes.
Which of the following would result in a decrease in aggregate demand?
Higher income tax rates
A decrease in aggregate demand in the short run will reduce
both real output and the price level.
A decrease in the price level will result in a(n)
movement down the AD curve.
Which of the following would NOT shift the aggregate supply curve?
an increase in the price level
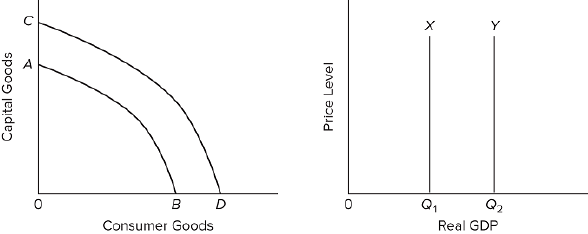
Refer to the graphs. An increase in an economy's labor productivity would shift curve
AB to CD and shift curve X to Y.
A fall in the prices of inputs will shift the aggregate
supply curve rightward
In the short-run, an increase in the average price level in the economy will cause:
profits to rise and thus, total production to increase.
A decrease in aggregate supply means
the real domestic output will decrease and the price level will rise
Business cycles are linked to the interaction between:
the aggregate demand and aggregate supply curves.
Inflation in the short run is most likely to result from a(n)
increase in aggregate demand or a decrease in aggregate supply.
In an effort to avoid recession, the government implements a tax rebate program, effectively cutting taxes for households. We would expect this to
increase aggregate demand.
The effect of expansionary fiscal policy is shown as a
rightward shift in the economy's aggregate demand curve.
A decrease in government spending will cause a(n)
decrease in aggregate demand.
If personal income taxes and business taxes increase, then this will
decrease aggregate demand and aggregate supply
If Congress passed new laws significantly increasing the regulation of business, this action would tend to
increase per-unit production costs and shift the aggregate supply curve to the left.
If the marginal propensity to consume is 0.9, then the marginal propensity to save must be
0.1.
The practical significance of the multiplier is that it
magnifies initial changes in spending into larger changes in GDP.
Assume the marginal propensity to consume is 0.8. If government spending increases by $20 billion, then real GDP will
increase by $100 billion
If the MPC in an economy is 0.8, government could shift the aggregate demand curve rightward by $100 billion by
decreasing taxes by $25 billion.
Demand-pull inflation is illustrated in the AD/AS model as a shift of aggregate
demand to the right
Graphically, cost-push inflation is shown as a
leftward shift of the AS curve
Stagflation refers to
an increase in inflation accompanied by decreases in real output and employment.
A negative supply shock
can cause stagflation.
The Phillips Curve suggests a trade-off between
the level of unemployment and inflation
The short-run Phillips Curve intersects the long-run Phillips Curve at the
natural rate of unemployment
In the short run, a decline in aggregate demand would be associated with:
a downward movement along the Phillips curve
The long-run aggregate supply curve at the full employment output level is analogous to:
the long-run Phillips curve at the natural rate of unemployment
Fiscal policy refers to
changes in government spending and taxes intended to promote economic growth, full employment, and price level stability.
An appropriate fiscal policy for a severe recession is
a decrease in tax rates.
The U.S. national debt
consists of the historical accumulation of all past federal deficits and surpluses.
A federal budget deficit exists when
federal government spending exceeds tax revenues in a given year.