PMI-PBA Final Version
1/99
There's no tags or description
Looks like no tags are added yet.
Name | Mastery | Learn | Test | Matching | Spaced |
|---|
No study sessions yet.
100 Terms
Acceptance criteria
The conditions that must be met for a solution to be considered acceptable to key stakeholders.
Active listening
Intense, focused listening to both verbal and nonverbal communications, paraphrasing back to confirm understanding.
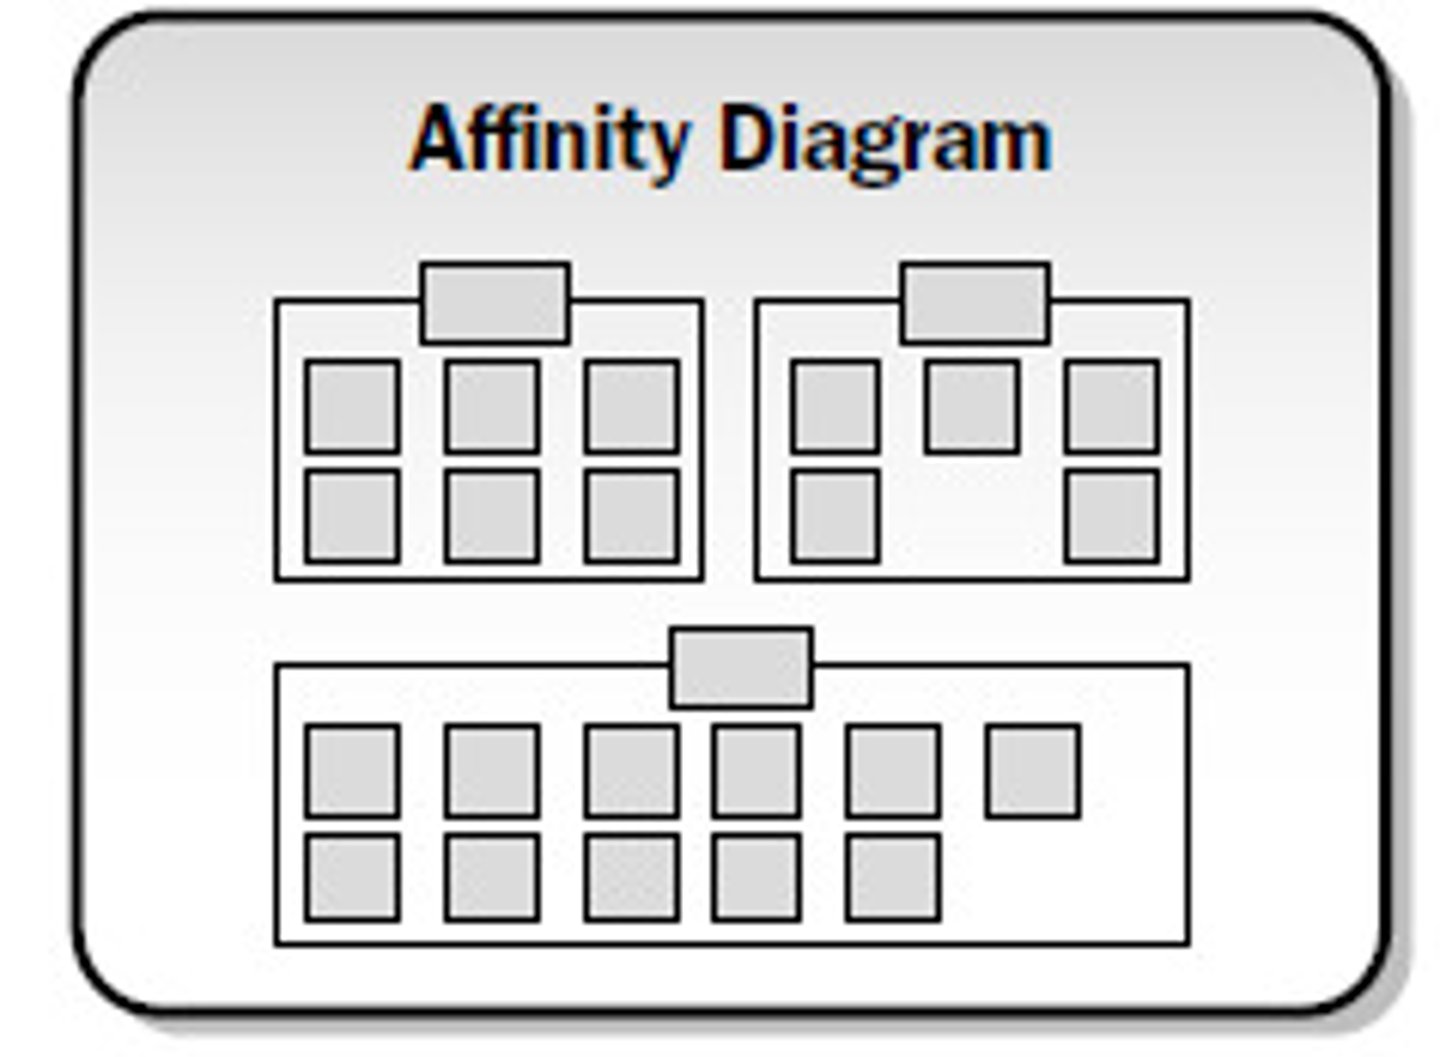
Affinity diagram
A group creativity technique where ideas from other requirements gathering techniques are organized by similarities.
Allocate requirements
Assigning requirements to specific solution components to verify they are included; or assigning requirements to releases or phases (aka tracing requirements)
Alternative analysis
Generating and evaluating options or alternatives; in PM alternative analysis is used to evaluate ideas about how to conduct the project; in BA this is used to evaluate solution options.
Backlog management
Maintaining a list of requests on an adaptive life cycle project.
Baselining
Documenting or freezing requirements at a particular point in time so you can refer back to them later.
Benchmarking
Comparing metrics or processes of two similar organizations (within the same company or competitors) looking for potential improvements.
Brainstorming
Creative idea generation that focuses on thinking outside of traditional solutions.
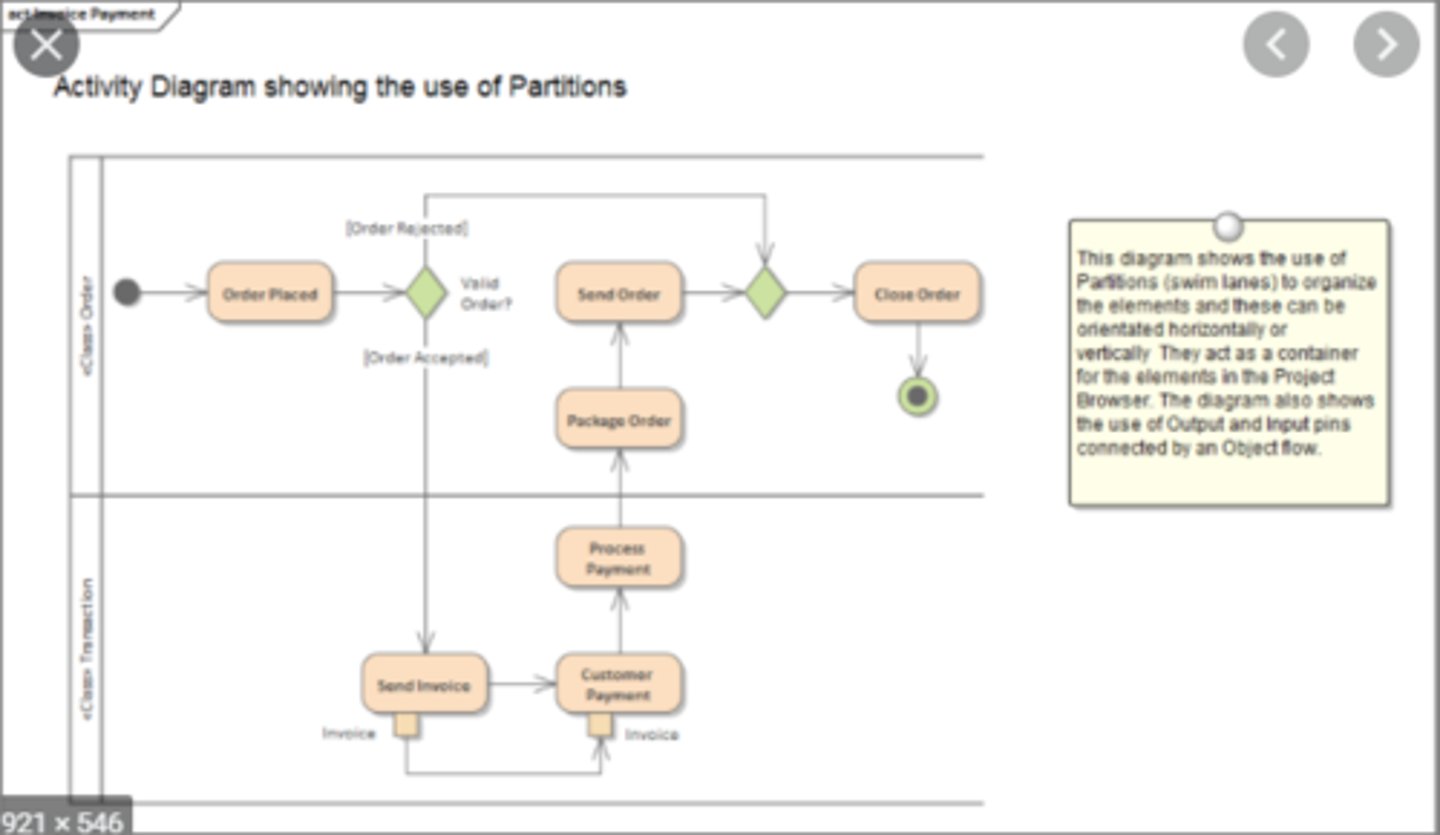
Business activity diagram
A diagram showing the flow of business activities using UML notation (may use vertical swim lanes; aka UML activity diagram)
Business case/business value, cost-benefit analysis
Assessing the value or benefits an organization aims to receive as a result of a project and comparing them to the estimated costs. A business case provides justification for the project.
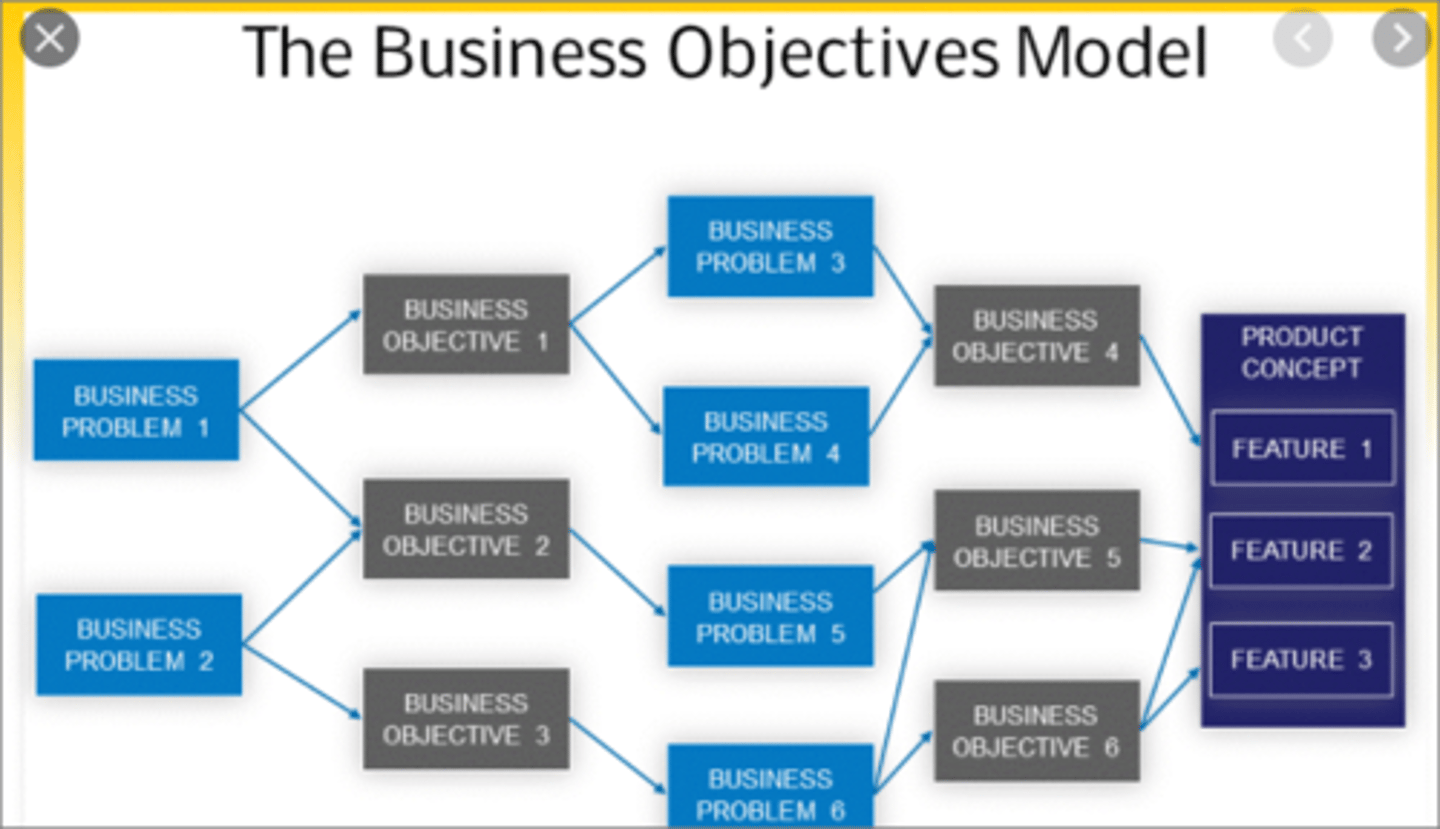
Business objective model
A tool used to analyze goals, problems objectives, success metrics, and high-level features (aka goal model)
Business requirements document
A package of requirements to present to an individual or group of stakeholders.
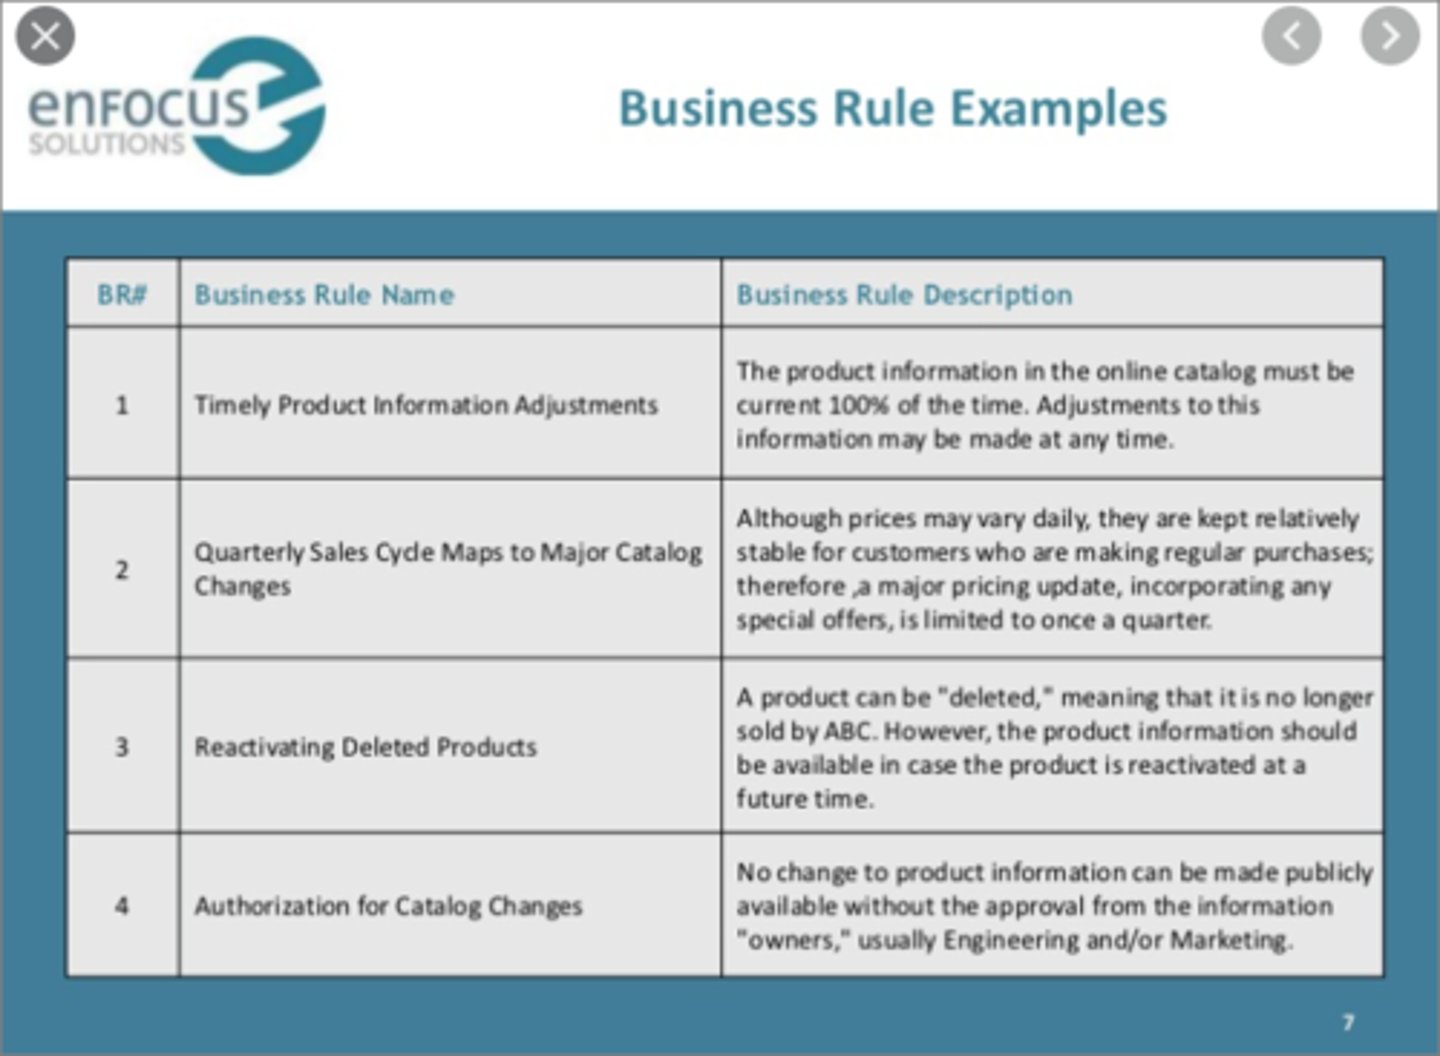
Business rules analysis/rule model
Business rules are policies, guidelines, and constraints that guide the work of the business. A rule model is a collection of rules with supporting definitions, relationships, and details.
Business rules catalog
A table used to store business rules and their characteristics.
Capability table
A tool used to examine problems, their root causes, and needed capabilities.
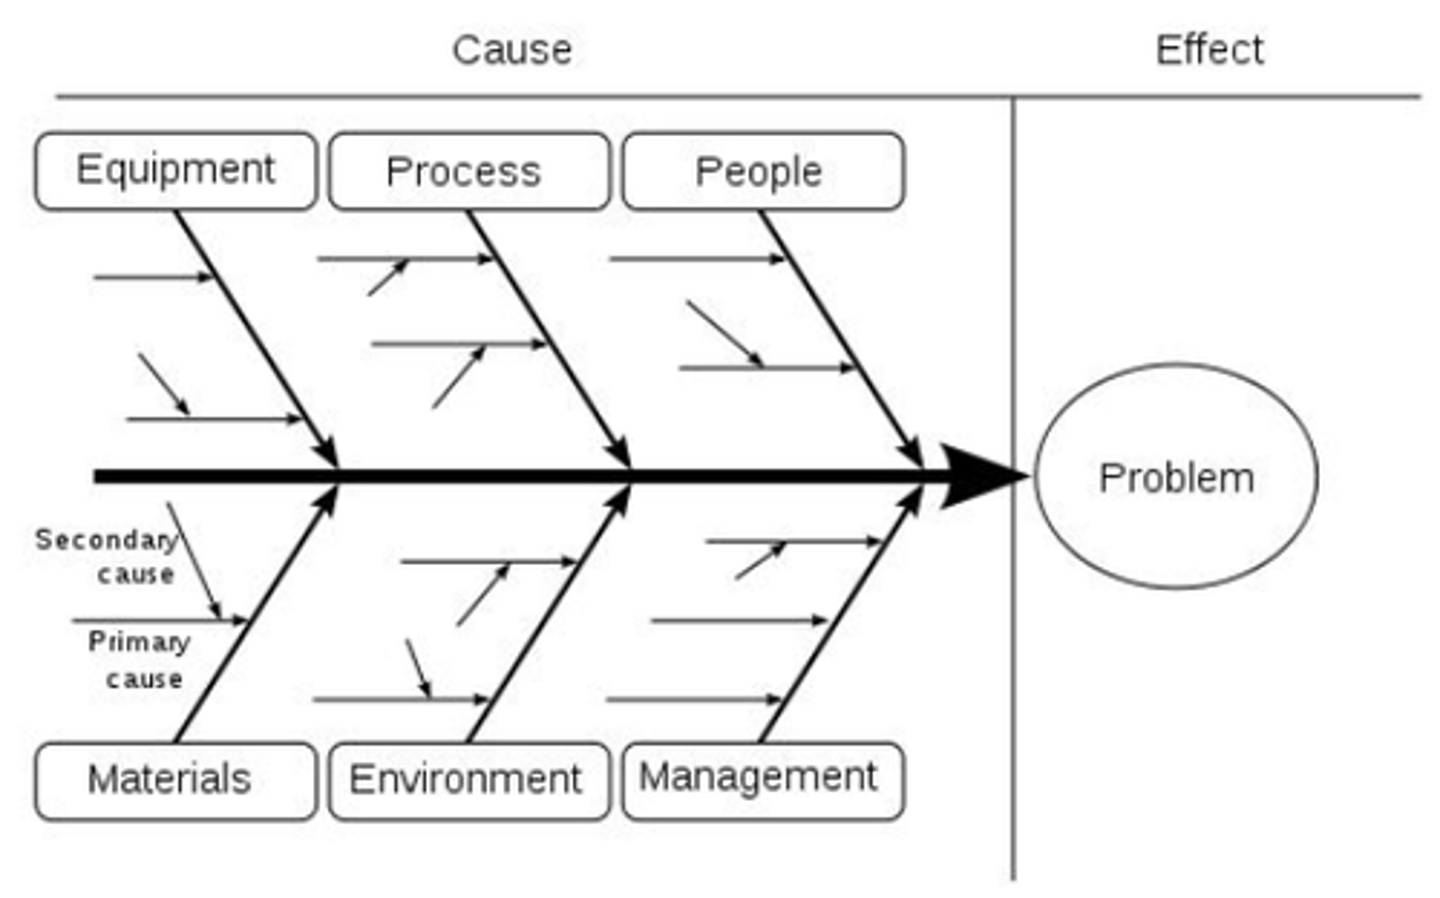
Cause and effect diagram
A diagram used to break down a problem and find its root causes (aka Fishbone, Ishikawa diagram).
Characteristics of requirements
Complete, correct, feasible, necessary, prioritized, unambiguous, and verifiable.
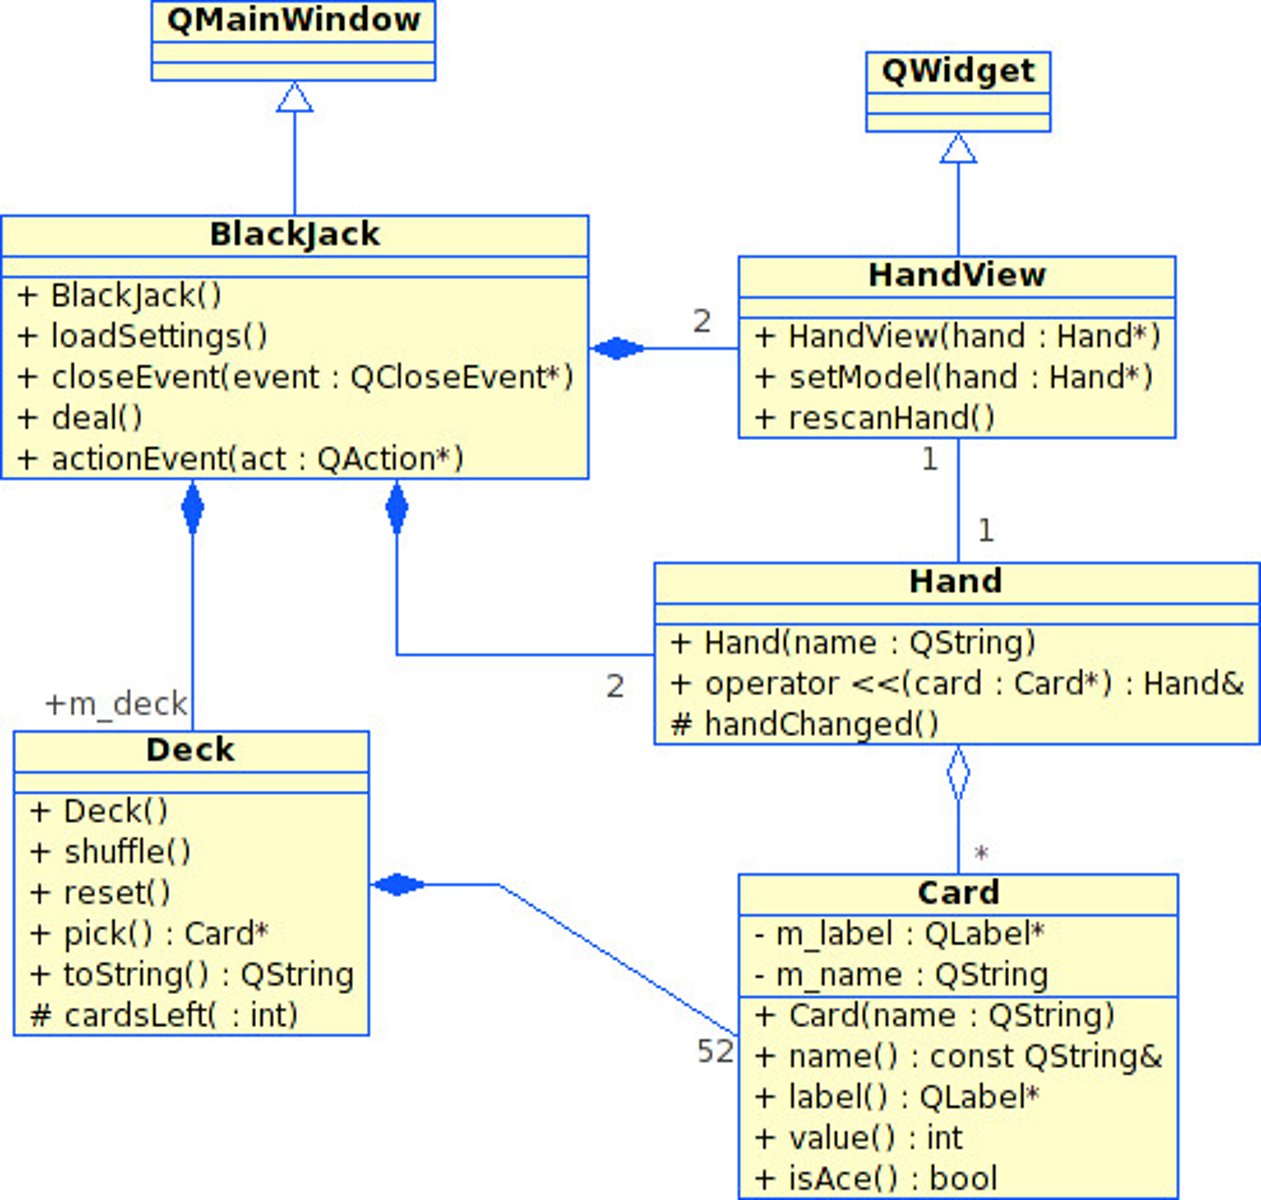
Class diagram
A diagram that includes business concepts such as classes, nouns, or entities, their characteristics, and their behaviors (used in object oriented analysis and design).
Business requirements
Requirements that describe the higher-level needs of the organization such as business issues or opportunities; provide the rationale for why the project is being undertaken. Usually stated as a business need by stakeholders, stated or diagrammed using business language. Shows how the business gets work done, what information is used, how decisions are made (business rules), and describes the problems/opportunities.
Solution (or product) requirements
Describes the features, functions, and characteristics of a product, service, or result that will meet the business and stakeholder requirements; these can be further grouped into functional and nonfunctional requirements.
Functional requirements (solution requirement)
Behaviors that the new solution or product will provide as a business improvement. If the solution is a process change, these requirements describe how the process will change. If a new product/solution, these requirements will include features and descriptions of the new product (what it will do and how it will work).
Nonfunctional requirements (solution requirement)
Requirements that express properties that the product is required to have, including interface, environment, and quality attribute properties. Often referred to as the "abilities", e.g., performance needs, volume needs, and technical requirements.
Quality requirements (product acceptance criteria)
Acceptance criteria for the solution (i.e., the conditions needed to validate the success of the solution).
Transition requirements
Requirements that help clarify the training that will be needed for converting existing data into the new system, as well as communications for letting all new stakeholders know about the change and its impact on their work.
Regulatory requirements
Requirements generated due to legal and/or other industry demands, e.g., SOX, GDPR, etc.
Project requirements
Specifications needed by the project team to complete the project. Includes budget, time, resources, and skills. Responsibility of the PM (NOT the BA).
Software requirements specification
A type of requirements documentation that includes the functional and nonfunctional requirements of a software system.
Configuration management system
System used by project team to store and manage project documents, diagrams, product components or other deliverables.
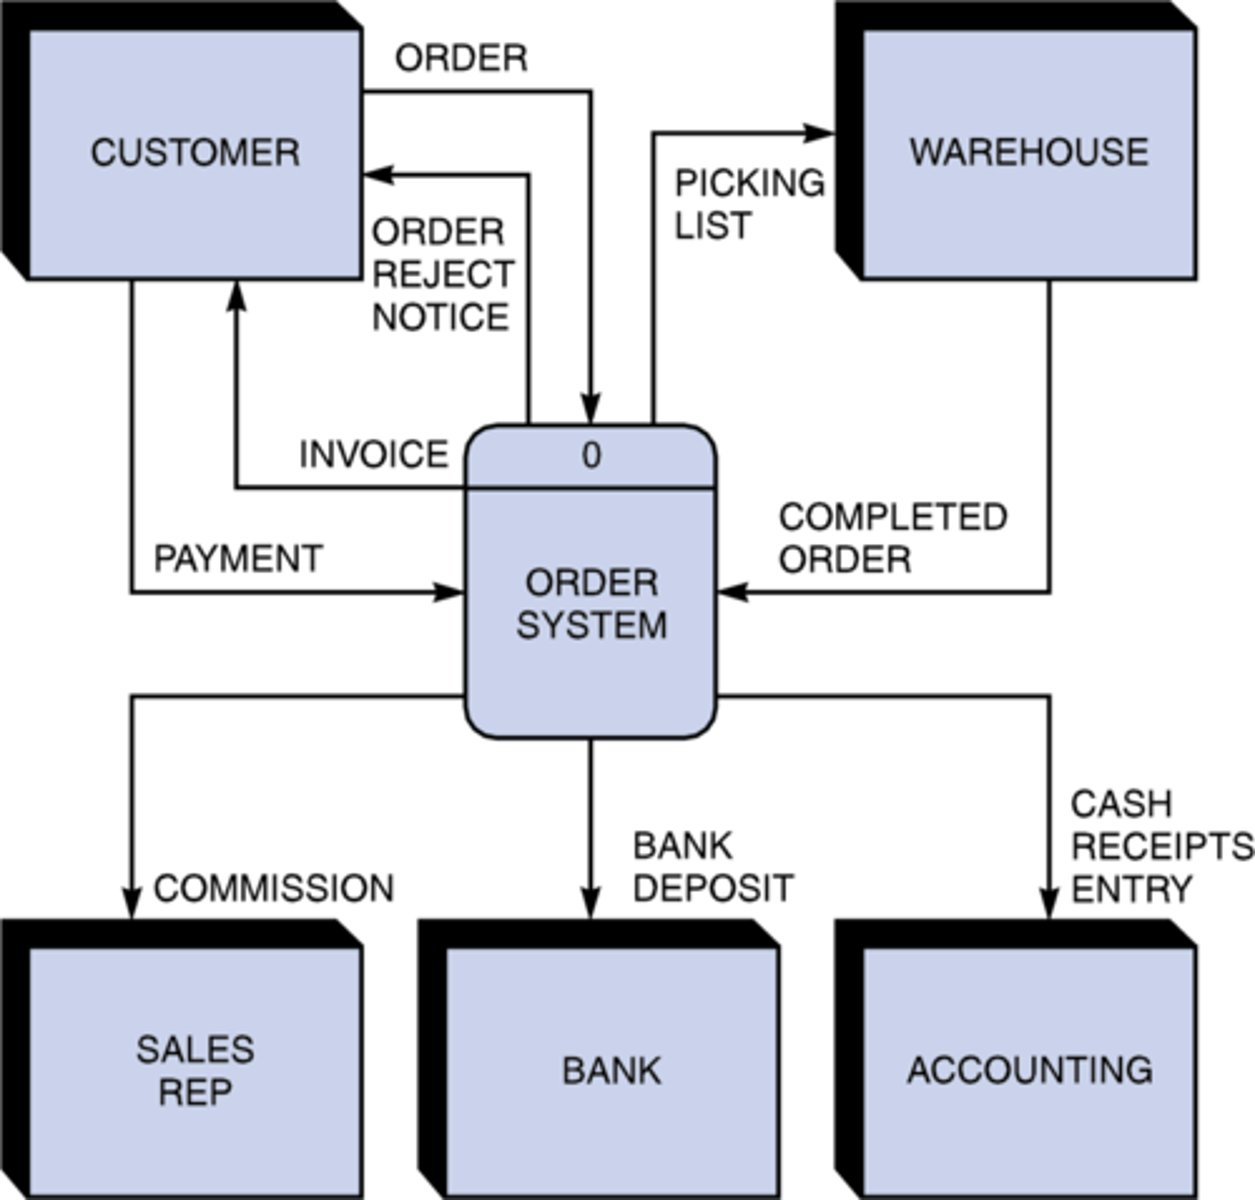
Context diagram
A specialized data flow diagram that shows the scope or context of the area to be studied or the solution.
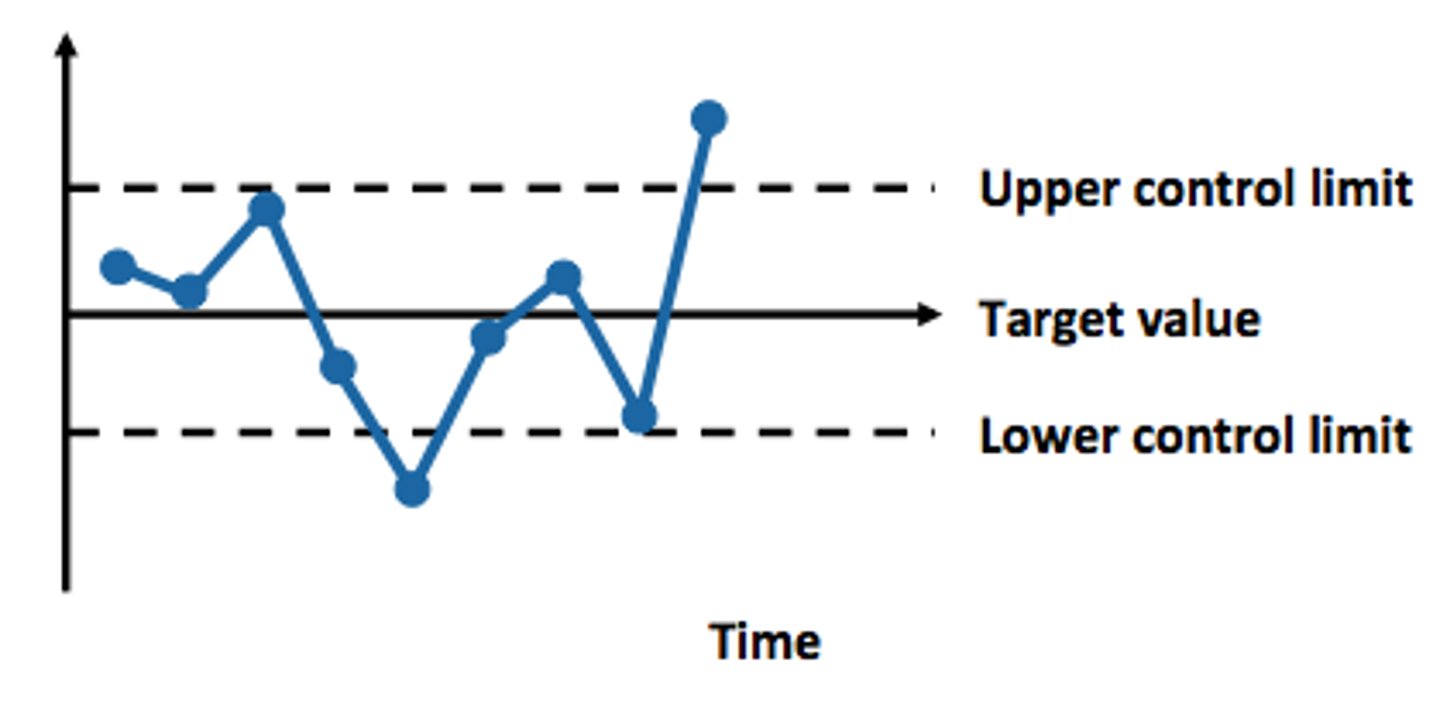
Control chart
Chart used in project management to show how a process behaves over time to determine whether a process is in control.
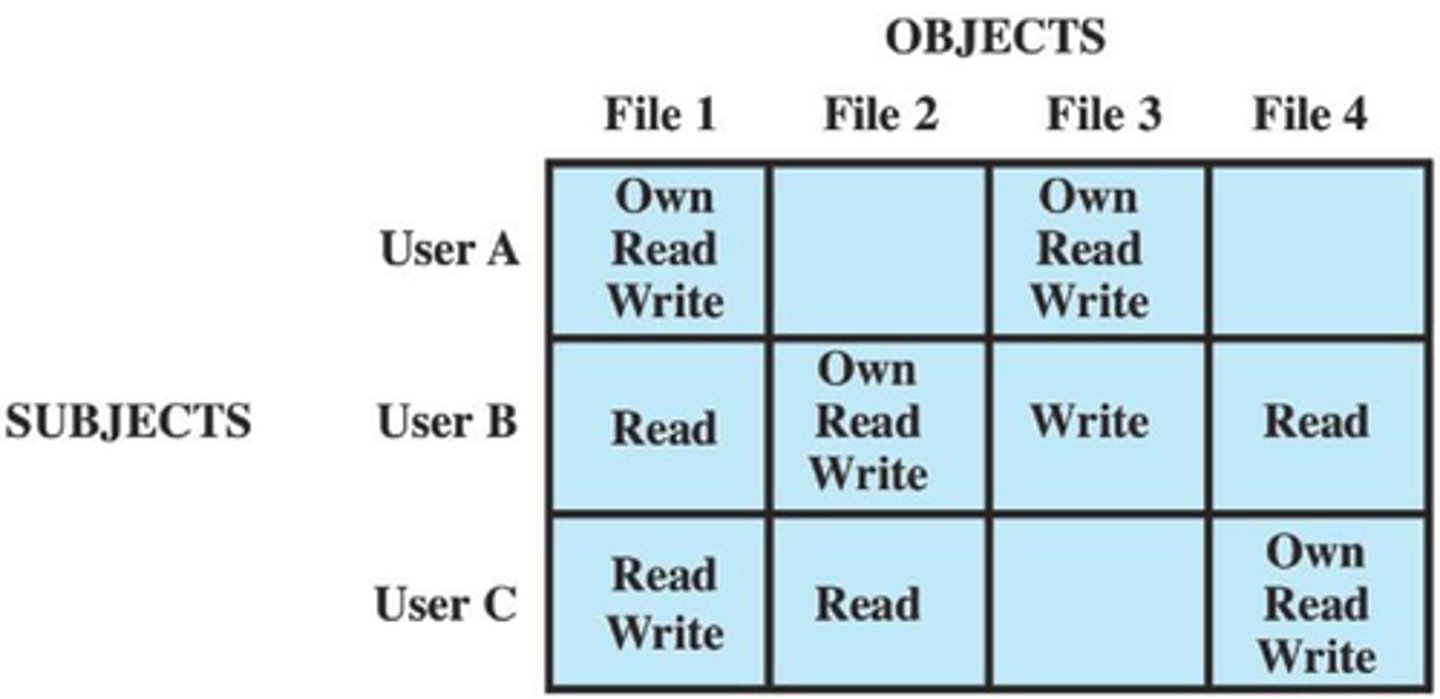
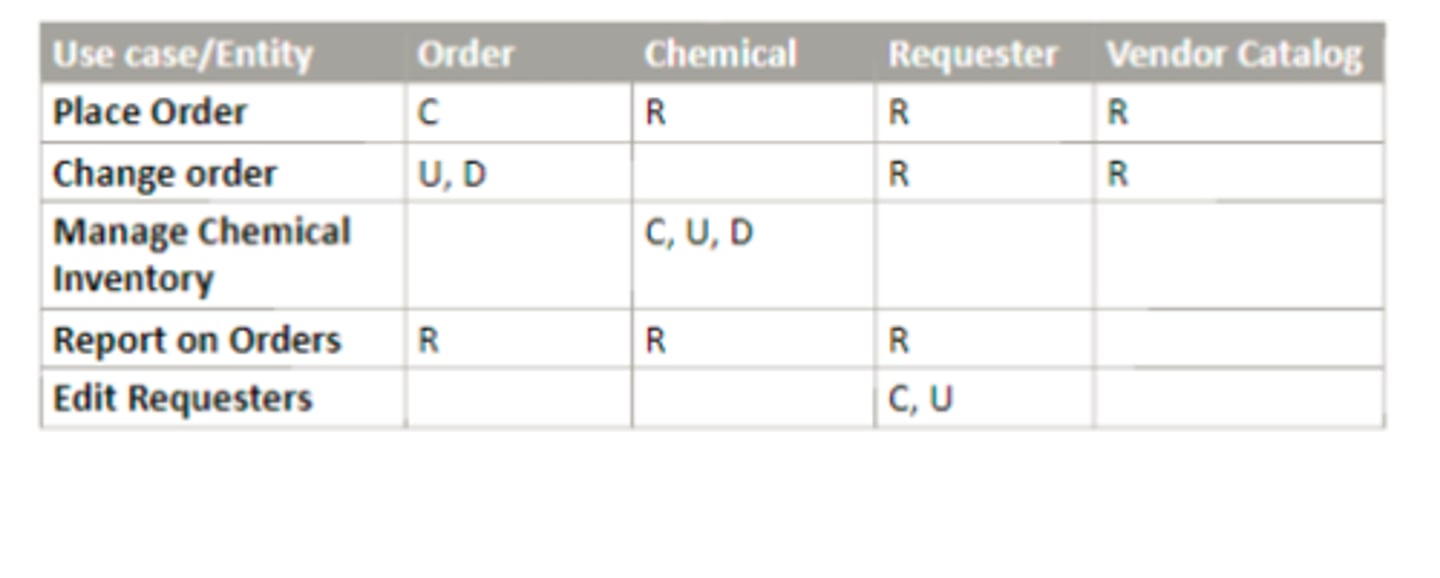
CRUD matrix
Matrix used in data analysis to ensure every data element is supported by processes that perform these activities: Create, Read, Update, Delete.
Data conversion
Reformatting existing business information for use in a new solution (part of transition requirements).
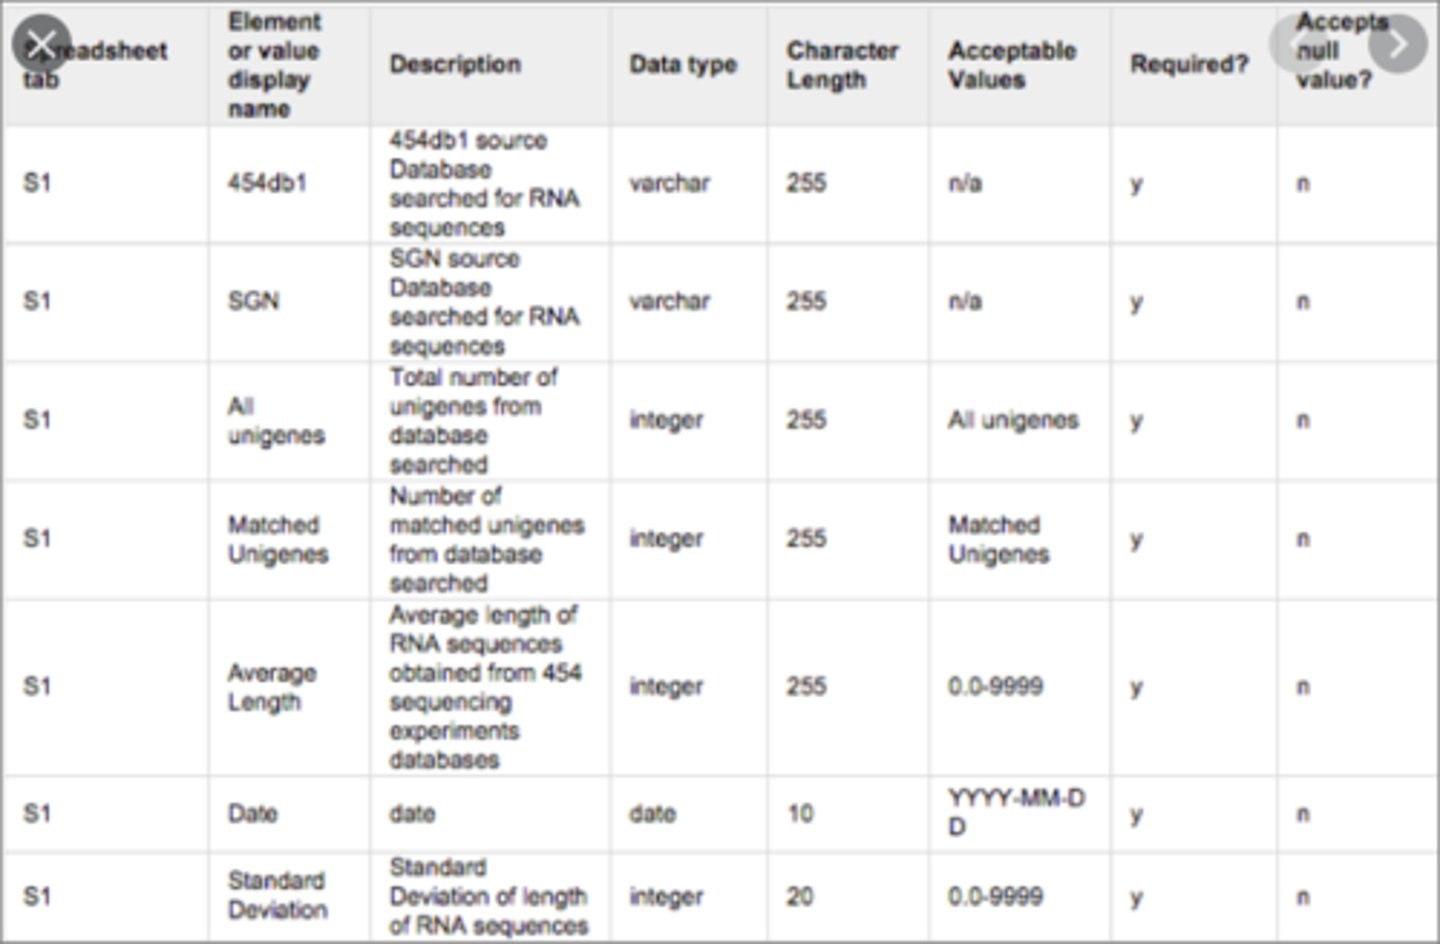
Data dictionary
List of named pieces of information (data elements) along with definitions of their meanings and usage.
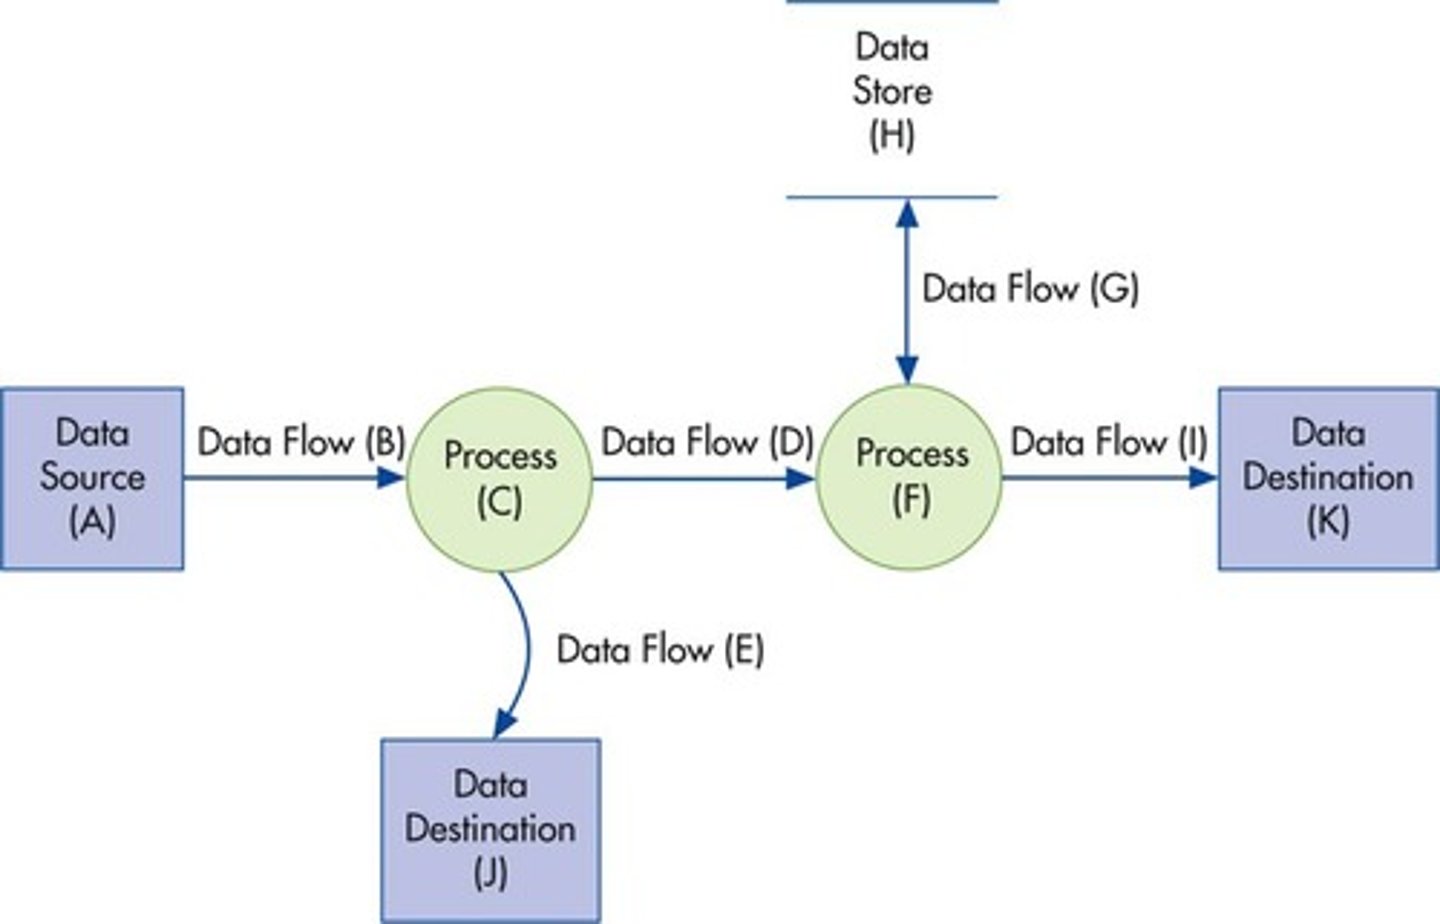
Data flow diagram
Shows business processes with information needed by each process (inputs) and information created by each process (outputs); also shows where the information or "data" flows.
Day in the Life Testing (DITL)
Semiformal testing that enables evaluation of solution functionality for typical usage.
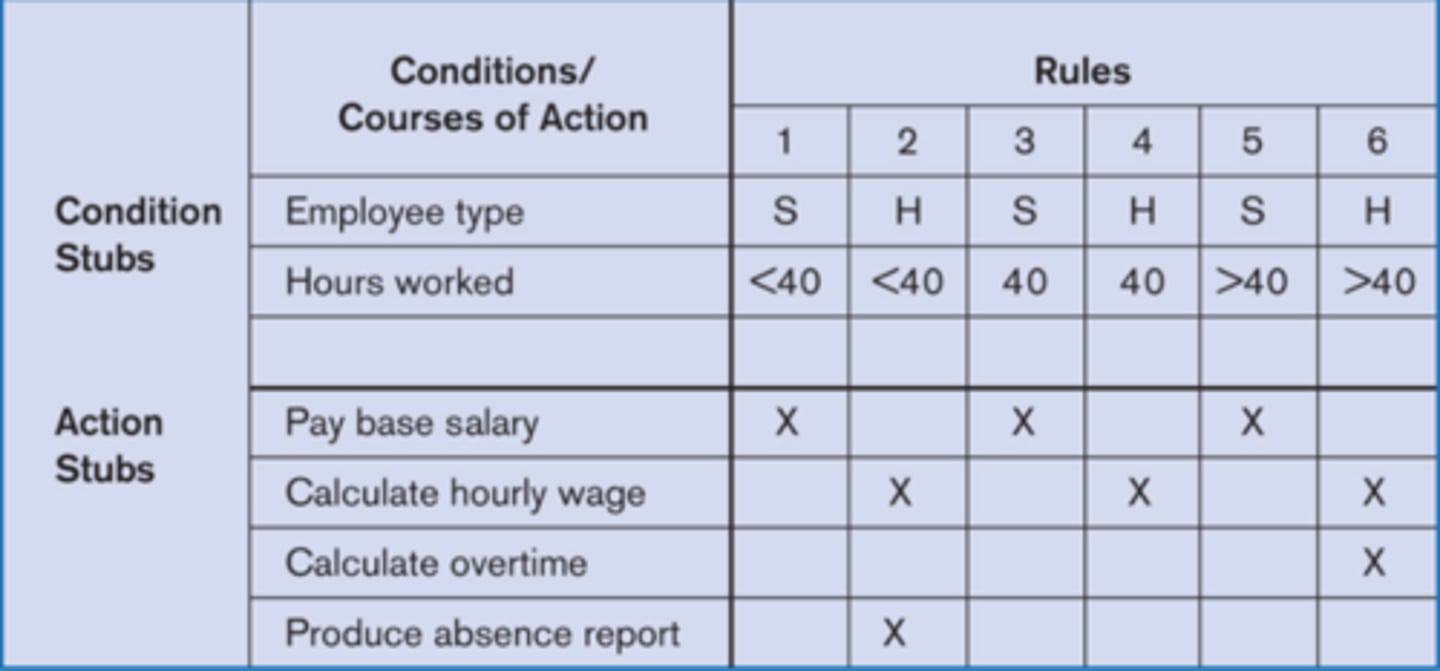
Decision table
Table showing complex business rules by listing conditions and resulting conclusions.
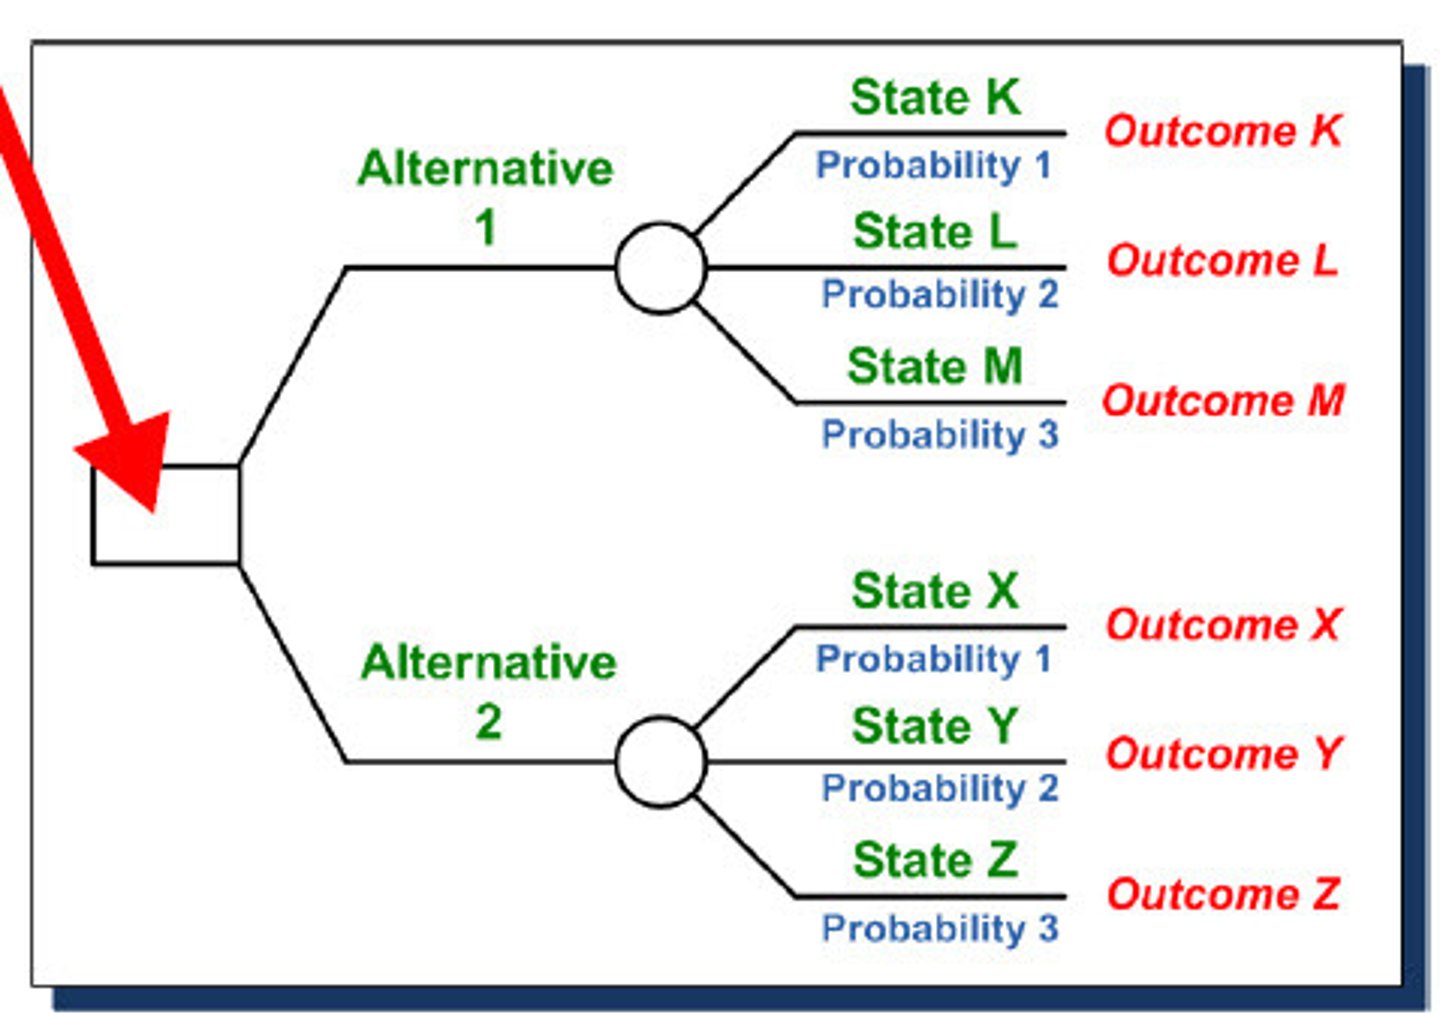
Decision tree
Diagram showing how a decision is made, including the factors used to make the decision.
Decomposition model
Breakdown of a component for analysis; can be used for solution scope, functions processes, problems, goals, organizational unites, project work, etc. (e.g., WBS).
Delphi method
Anonymous information gathering technique resulting in consensus of group experts.
Dependency analysis
Reviewing how one requirement is dependent on another requirement; usually done with a traceability matrix.
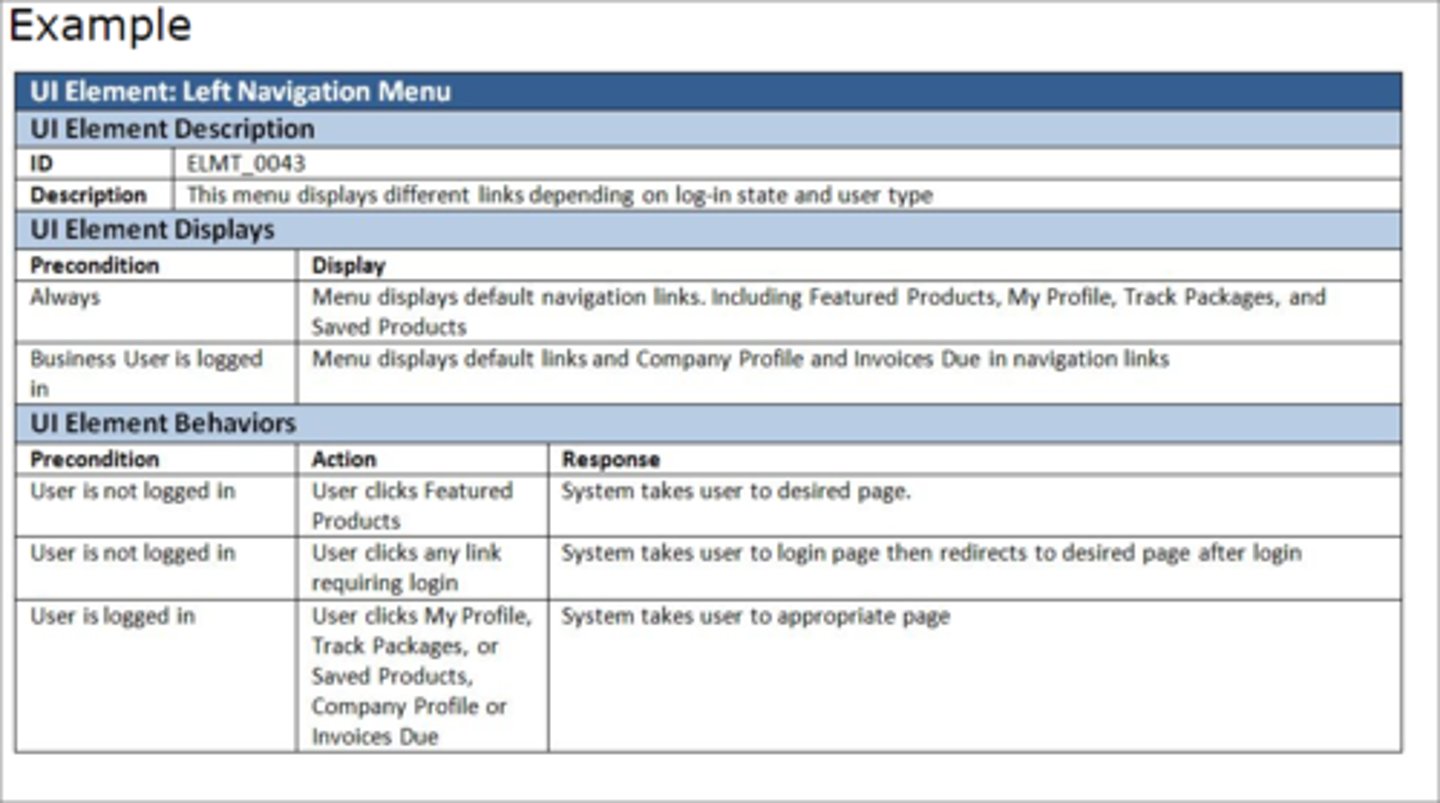
Display action response model
A way to describe the desired behaviors of the components on a wireframe or screen mockup.
Document analysis/research
Reviewing existing documents, systems, or published or unpublished sources to learn about a business or technology.
Document system management
Procedures and tools used to store, trach, version, and archive documents.
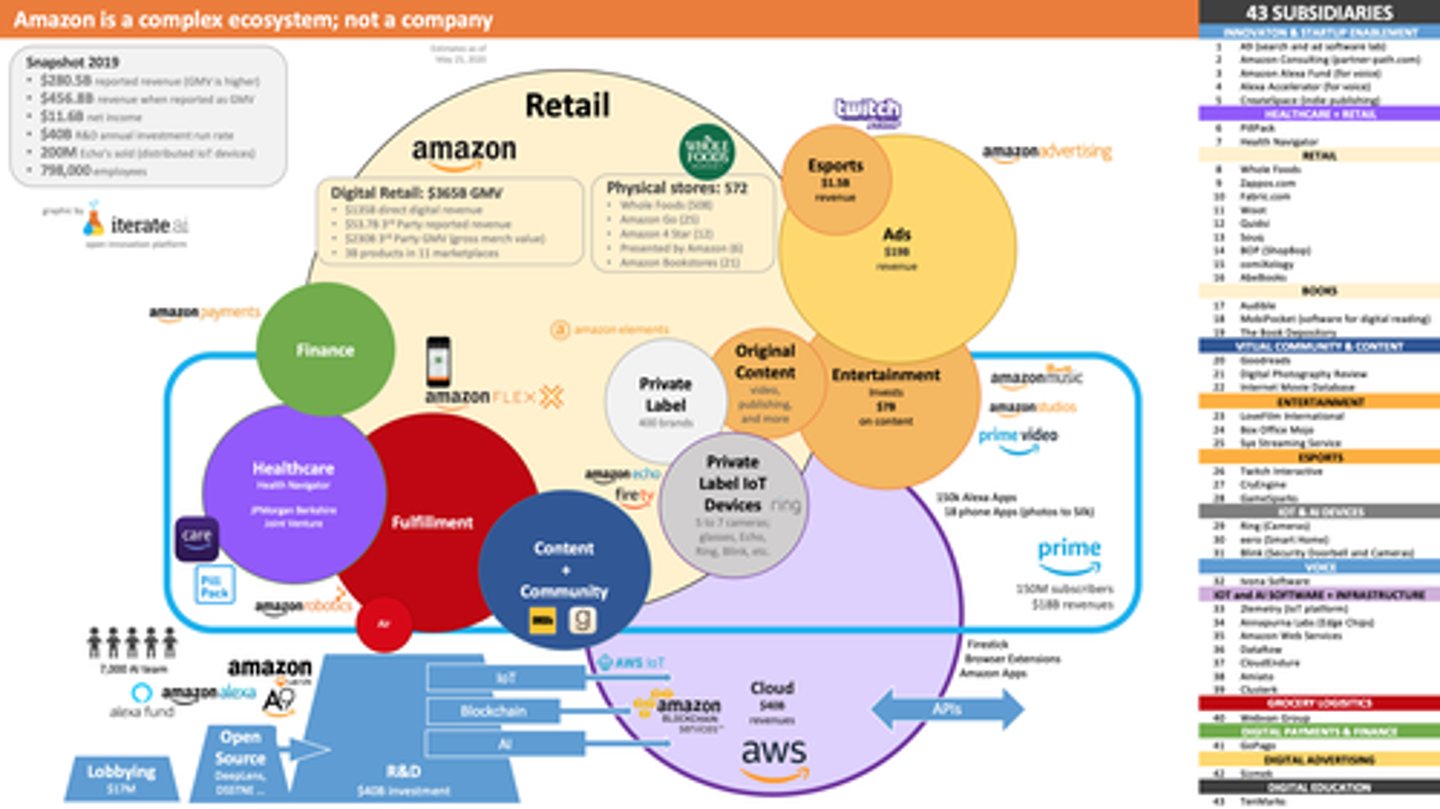
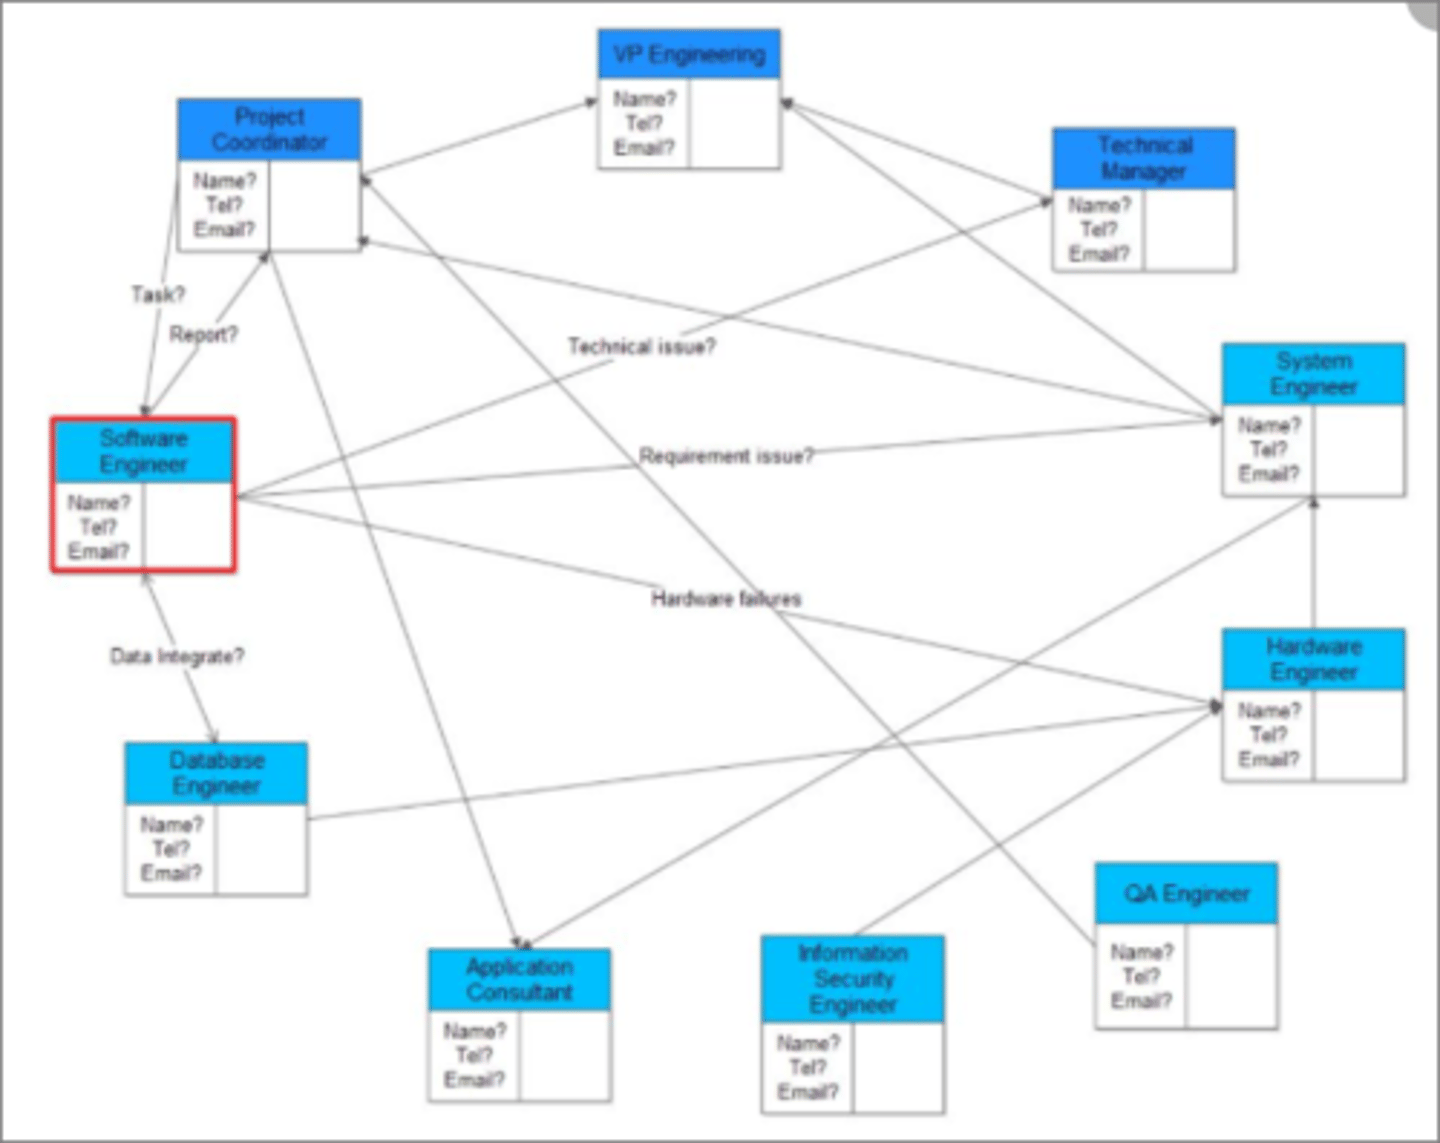
Ecosystem map
Map showing relevant systems and the relationships between them to help with scope and interface analysis.
Elaboration (progressive)
Developing more details or more clarity within requirements or models.
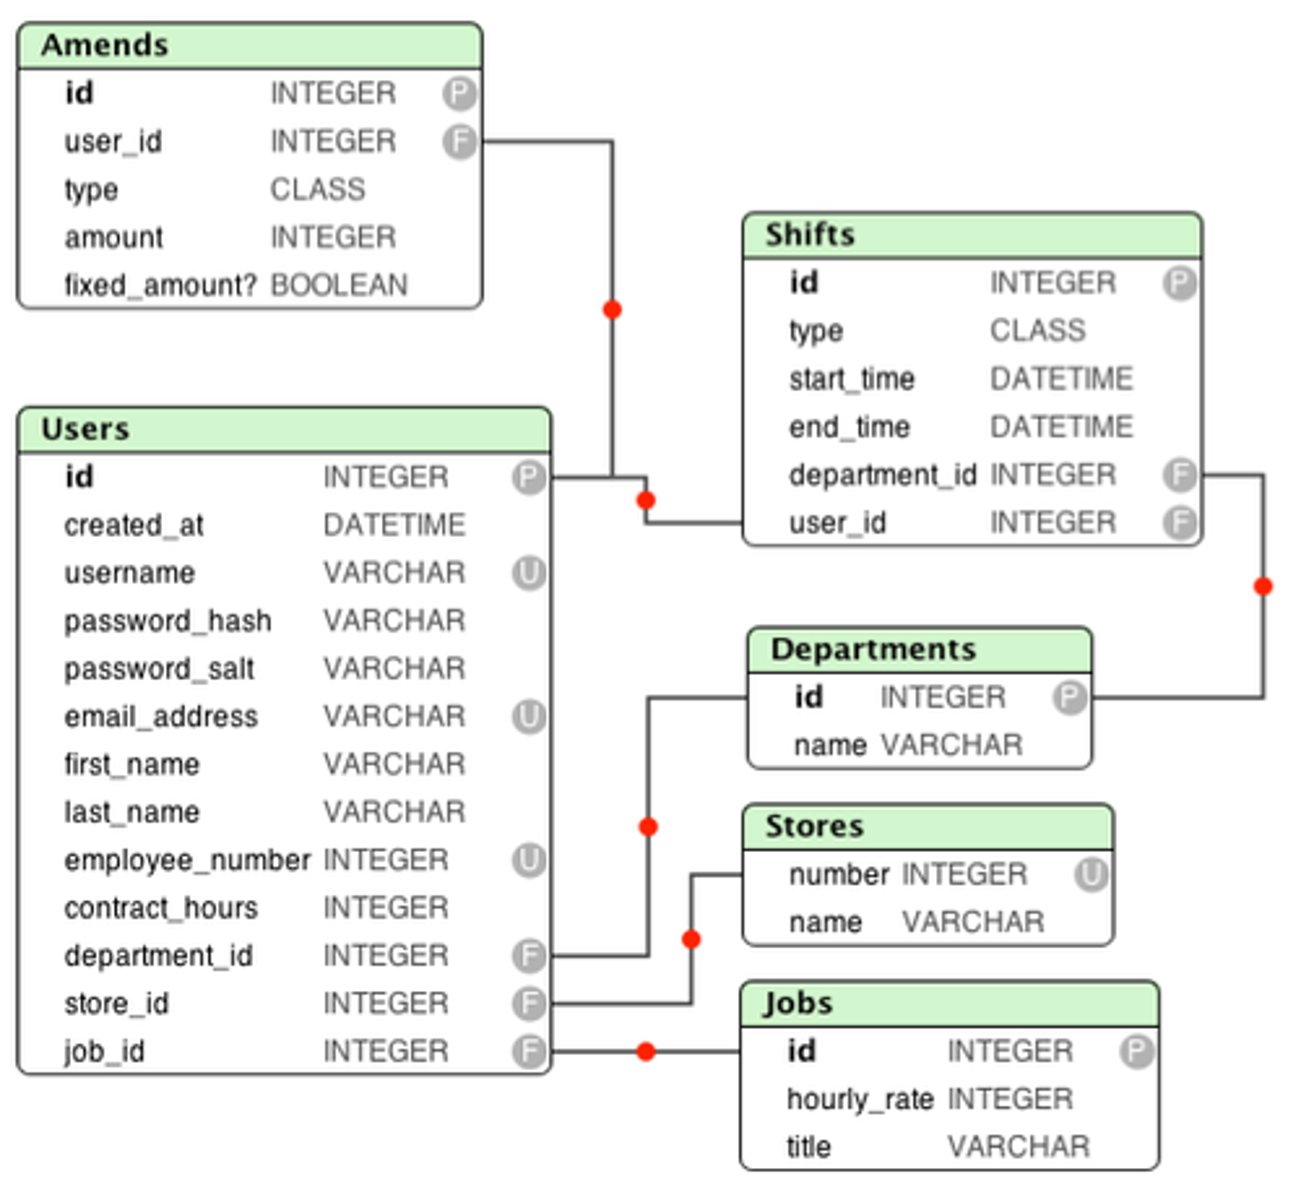
Entity relationship diagram
An analysis technique used to elicit and capture the information needs of a business.
Expected Monetary Value (EMV)
PM calculation that is an accepted practice to estimate a value for cost-related contingency reserves based on the possible outcomes that might result from threats and/or opportunities.
Exploratory testing
Free-form unscripted testing where the tester makes decisions about what to test. Often used when requirements aren't available. A validation activity used to determine if a solution is working as intended and may include ease of use, functional, and performance evaluations.
Facilitated workshop
Elicitation technique used when a group of stakeholders share needs and will share the resulting product or process (aka workshops, requirements workshops).
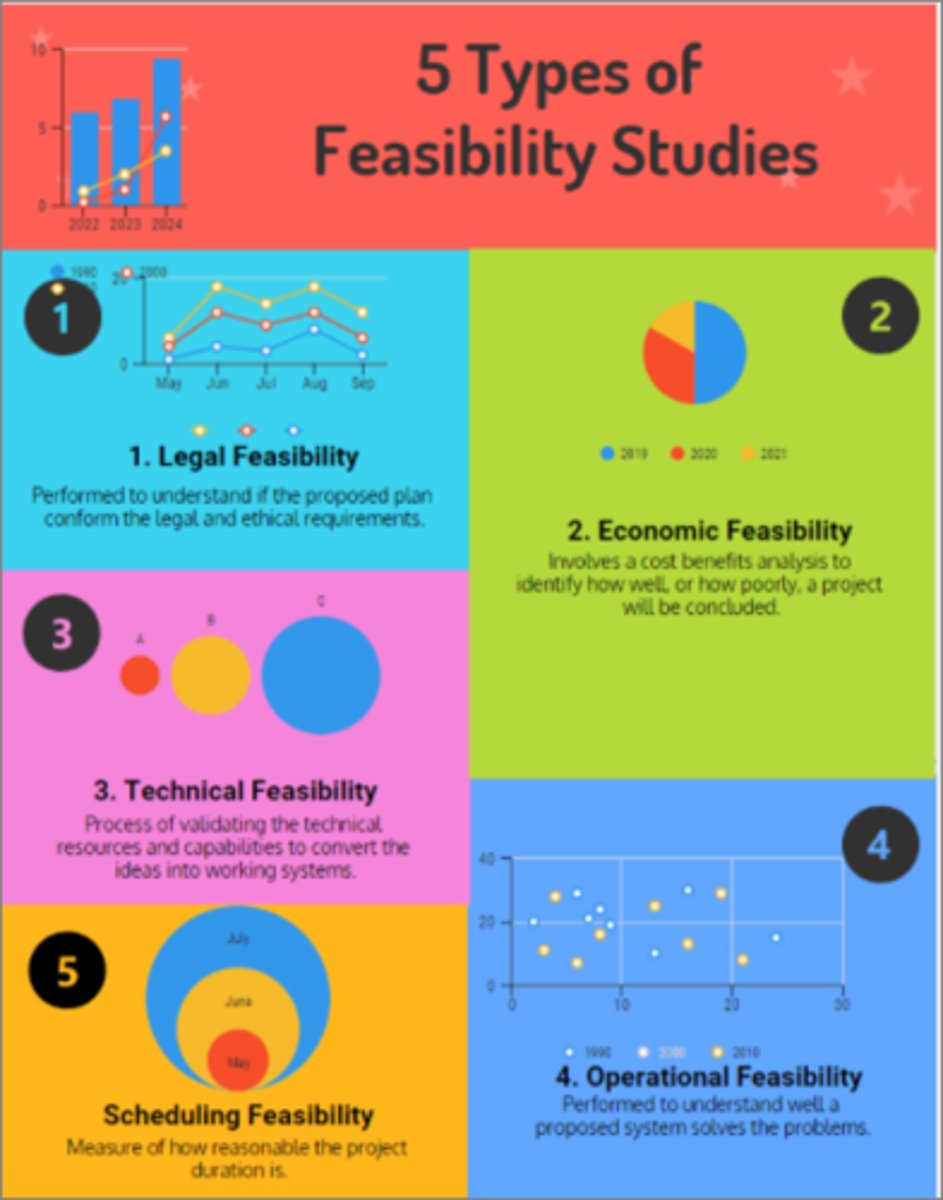
Feasibility analysis
Analyzing the ability of the organization to create the requested solution.
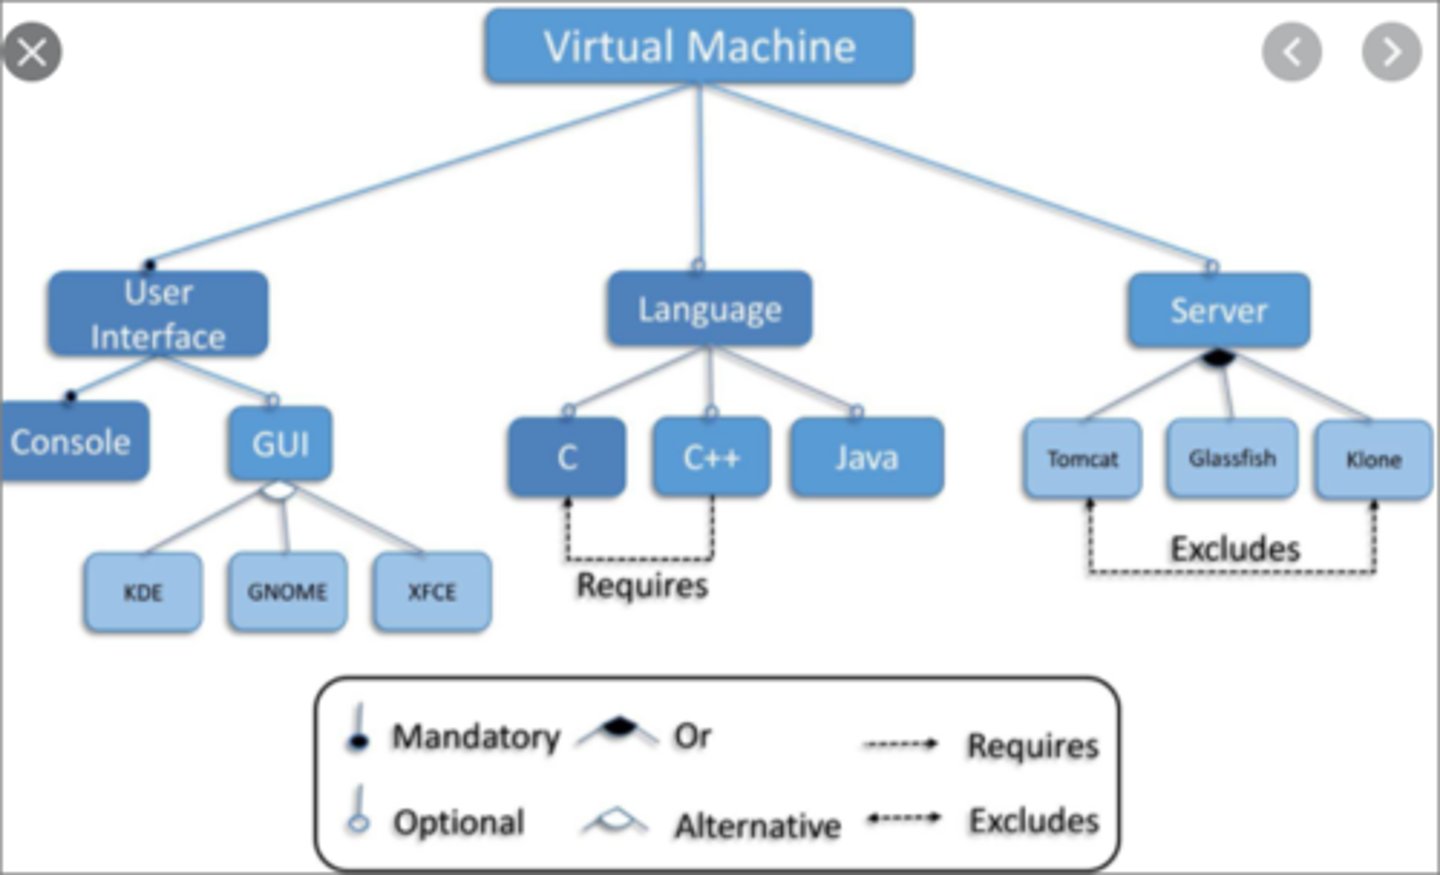
Feature model
A visual representation of the features of a solution in a tree or hierarchical structure.
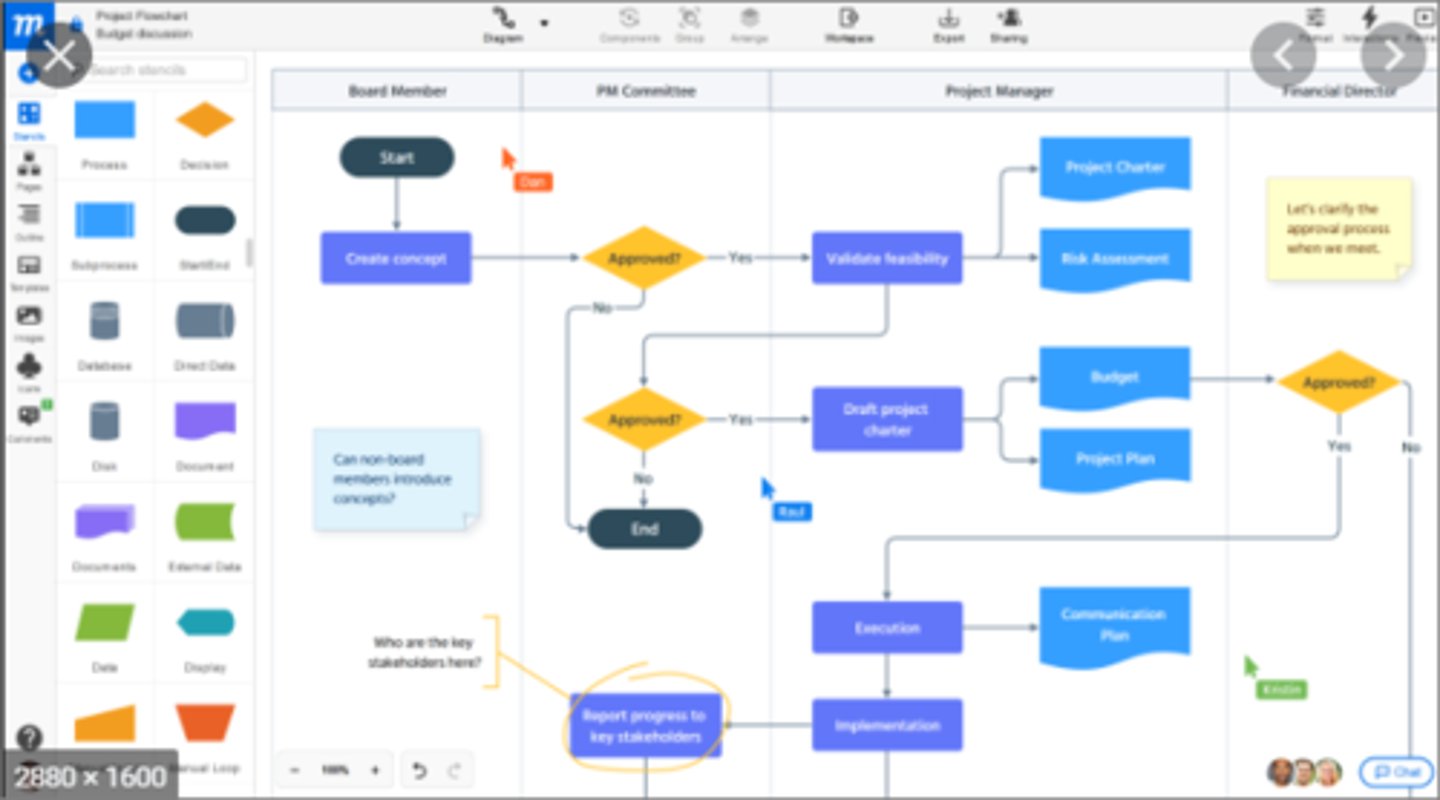
Flowchart
Diagram that shows processes or procedures with shapes and arrows (aka process flow, process map, workflow diagram).
Focus group
Meeting with customers or other stakeholders to elicit feedback on existing or new product ideas. Used to gain feedback on completed work or prototypes. Group members are prequalified or prescreened to ensure they meet the desired target group.
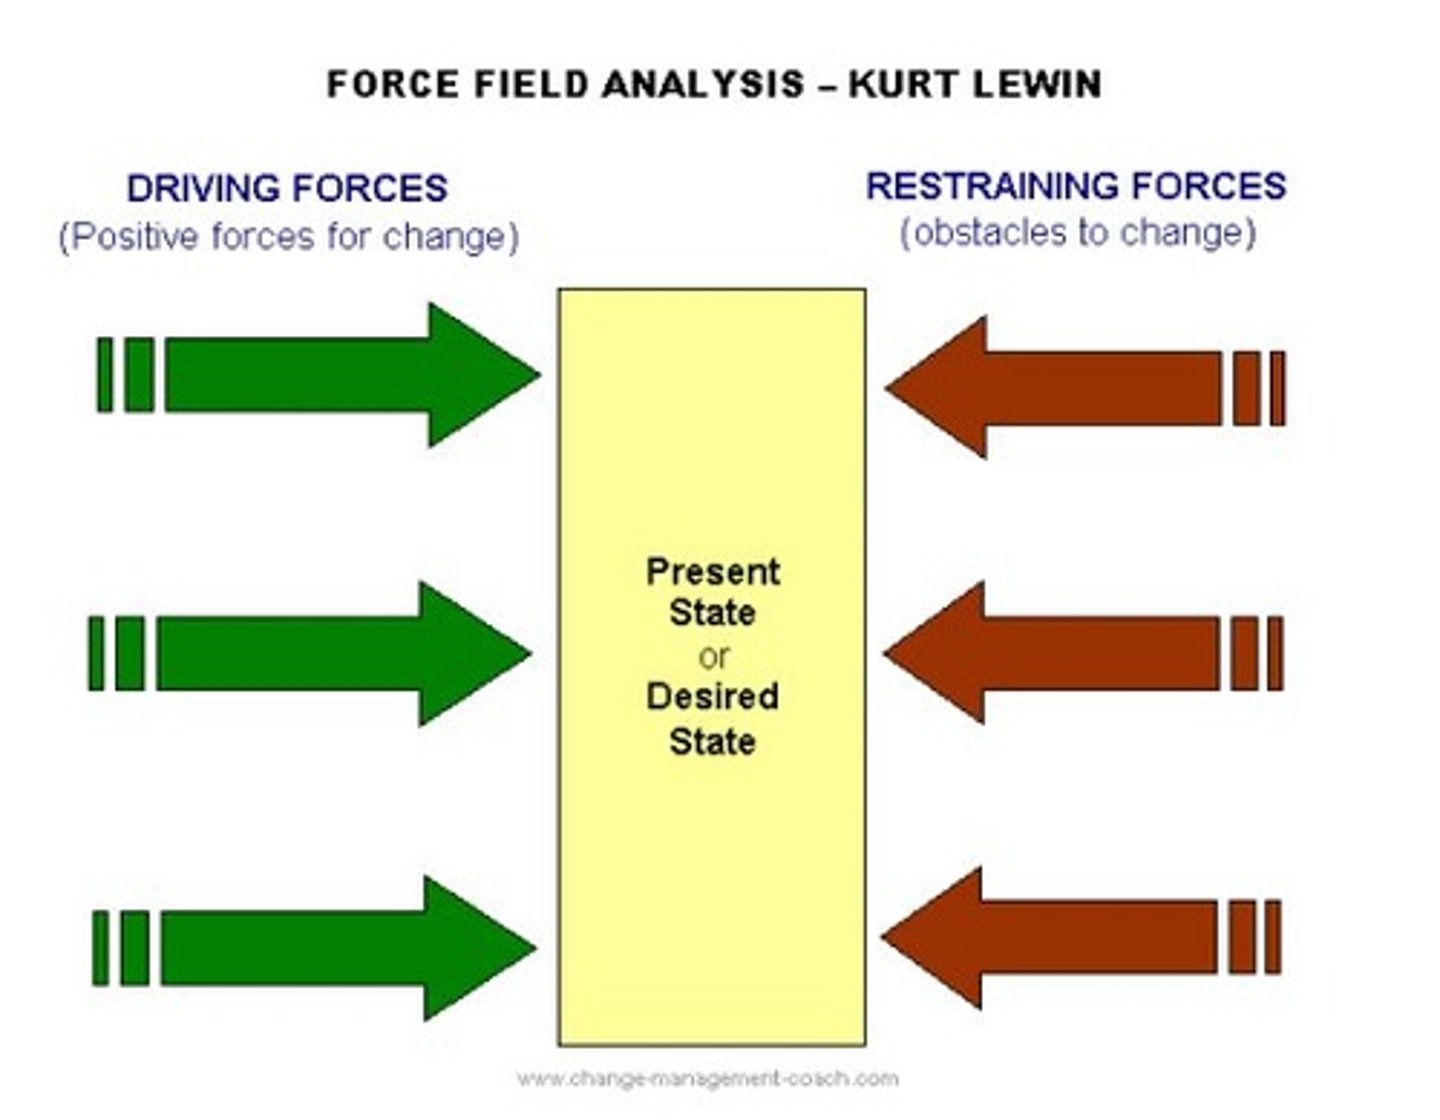
Force field analysis
Analyzing the expected pressures for and against a change or new idea.
Gap analysis
A comparison of two or more systems or processes to find differences; as-is compared to future-state or ideal state; vendor A vs. vendor B.
Glossary
List of business and requirements terms and definitions (important!).
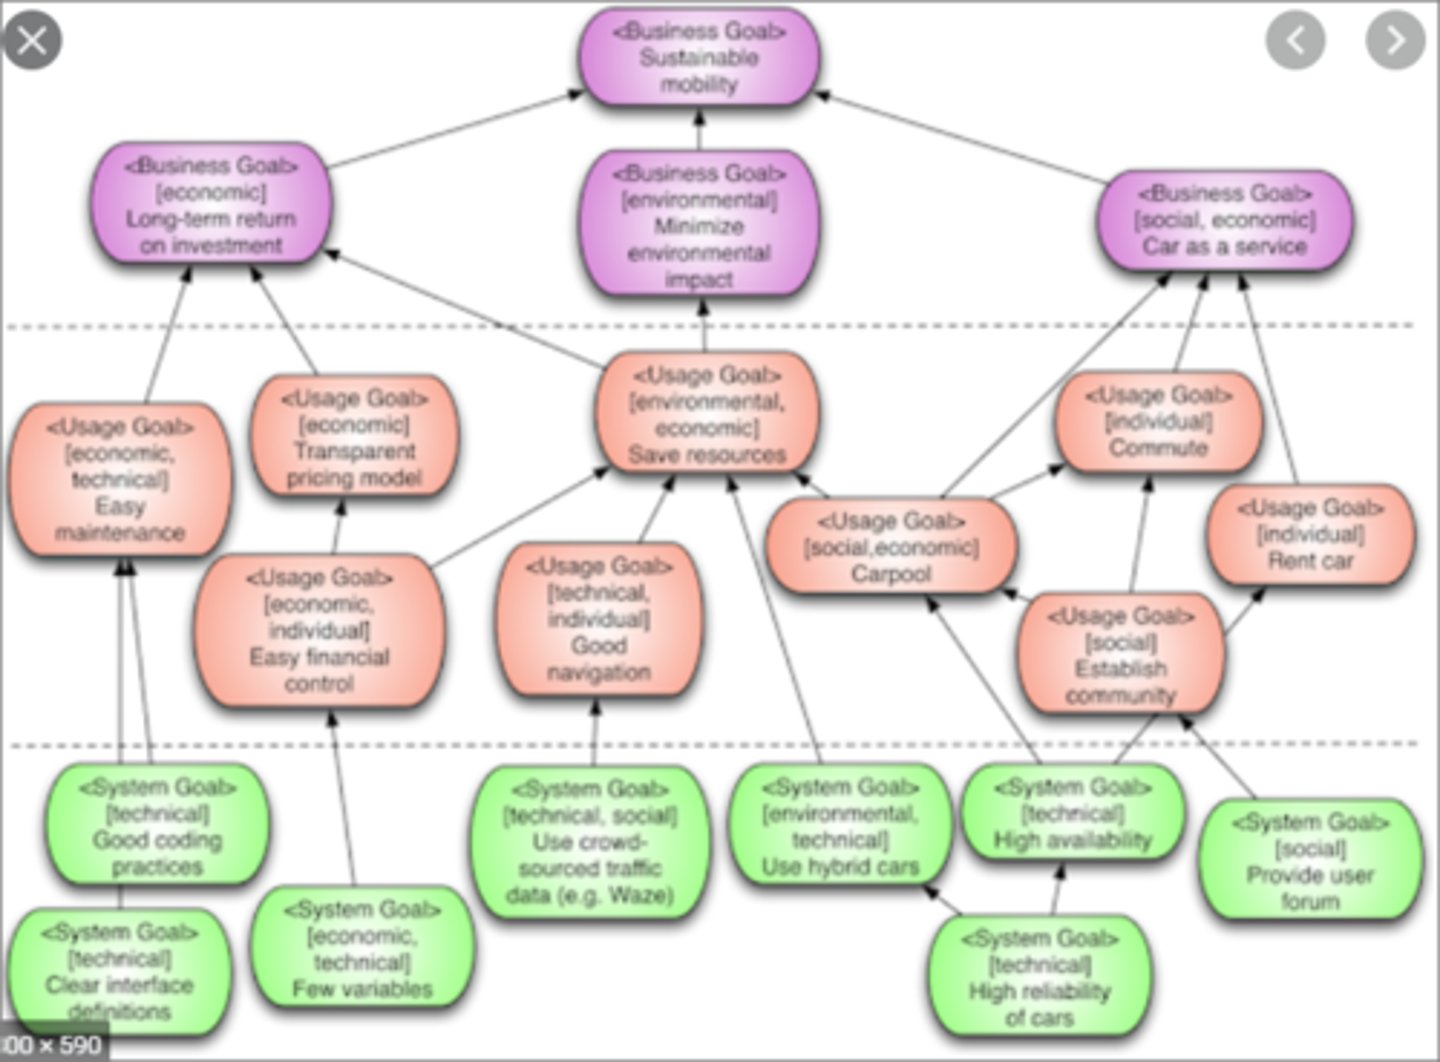
Goal model
A tool to analyze goals, problems, objectives, success metrics, and high level features (aka business objective model).
Group decision making
Methods used when more than one person is involved in making a decisions; i.e., majority rules, unanimity, consensus, compromise, and autocratic.
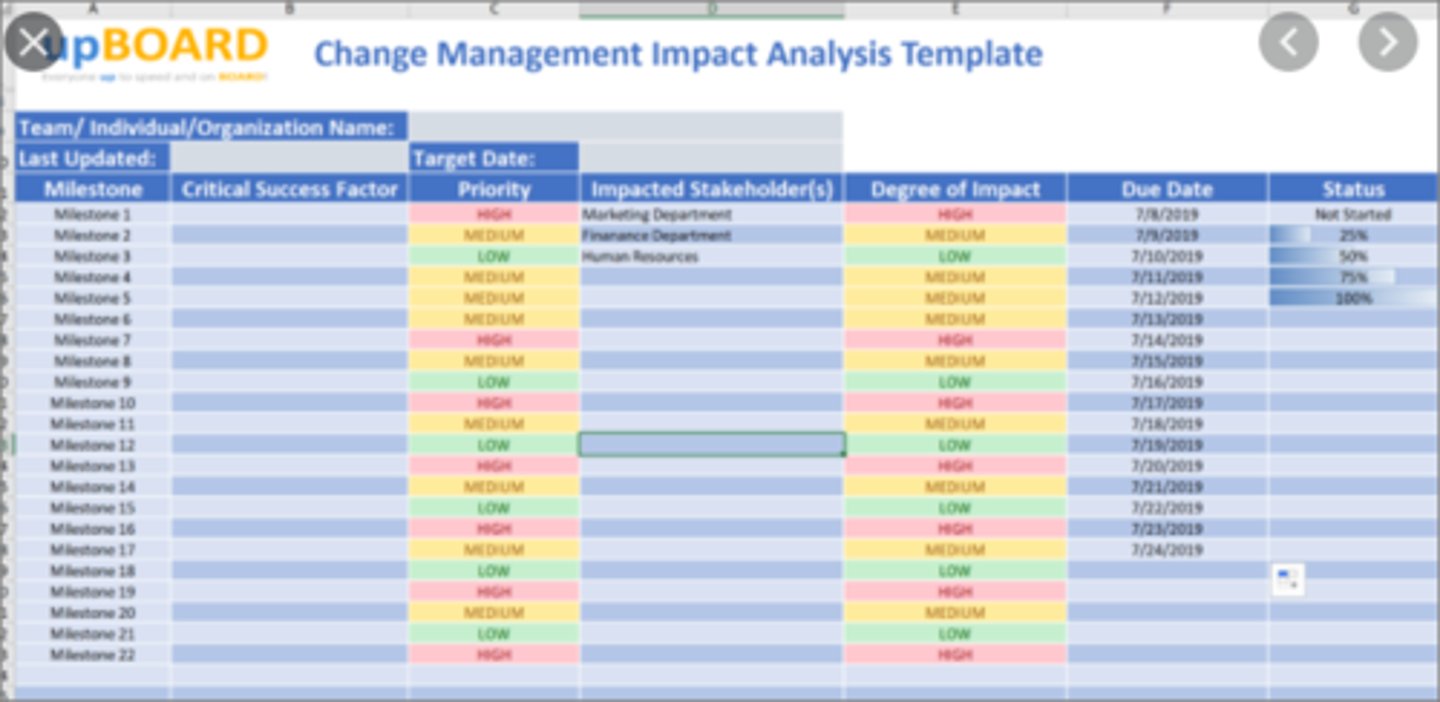
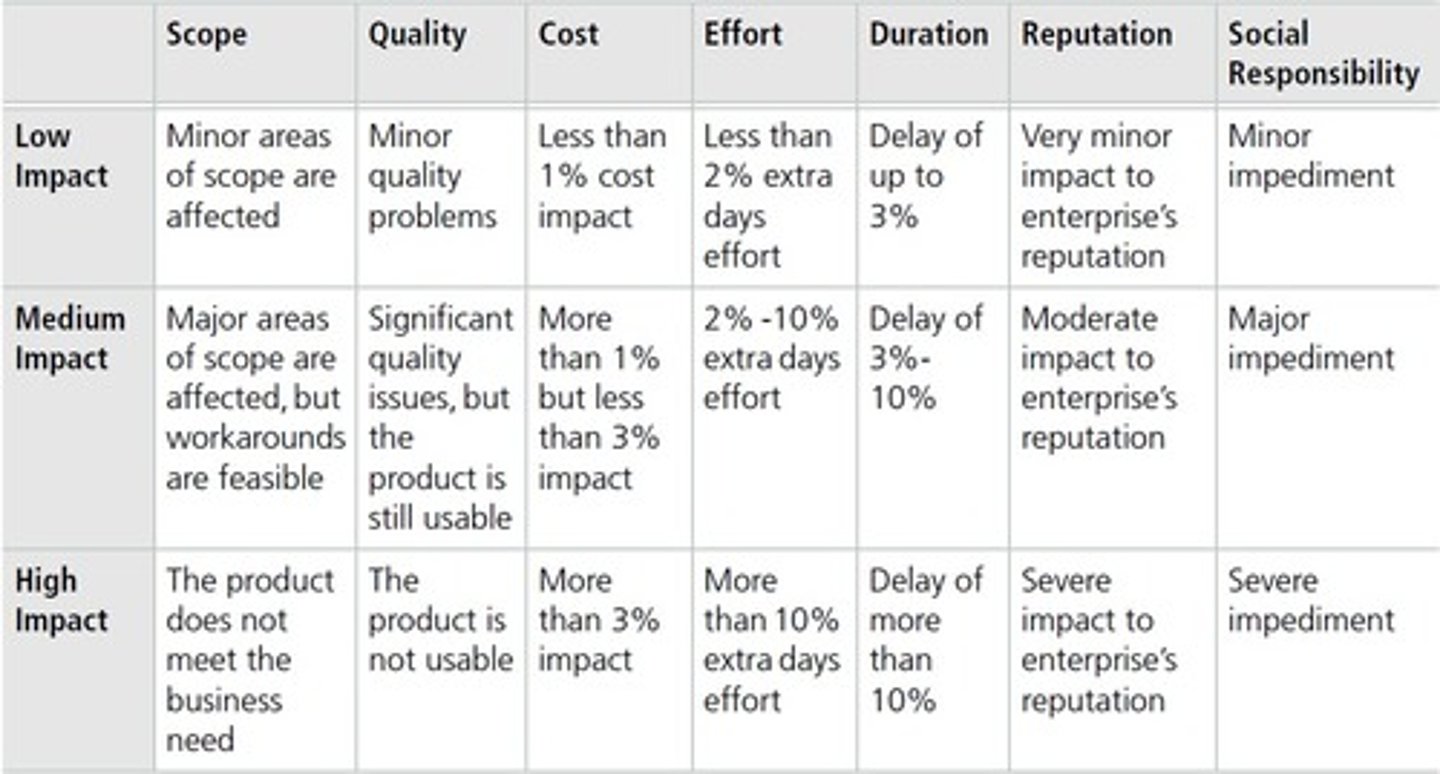
Impact analysis
Predicting the ramifications of a requested change on requirements, the solution, or the project.
Inspection
Verifying requirements, a solution component, or the solution, making sure they conform to standards and are without errors (aka review, product review, walkthrough).
Integration testing
QA work to ensure solution components work together as designed.
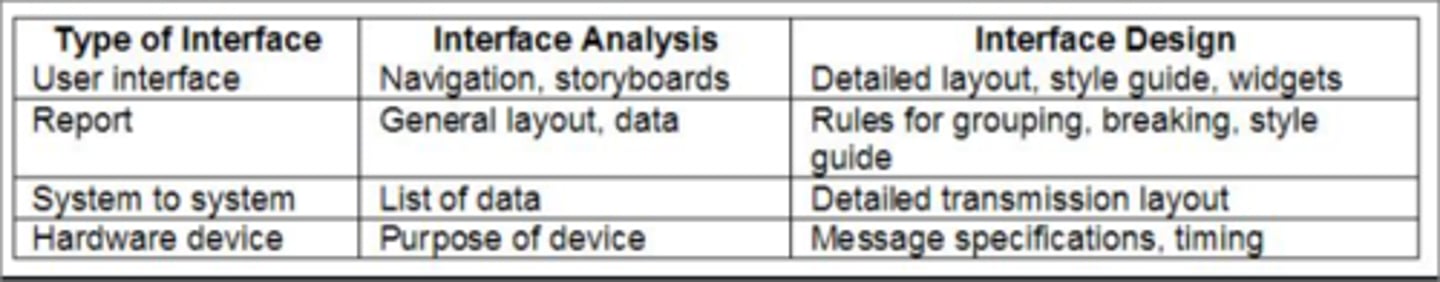
Interface analysis
Elicitation and analysis technique for understanding and designing interactions between people, processes, systems, or equipment.
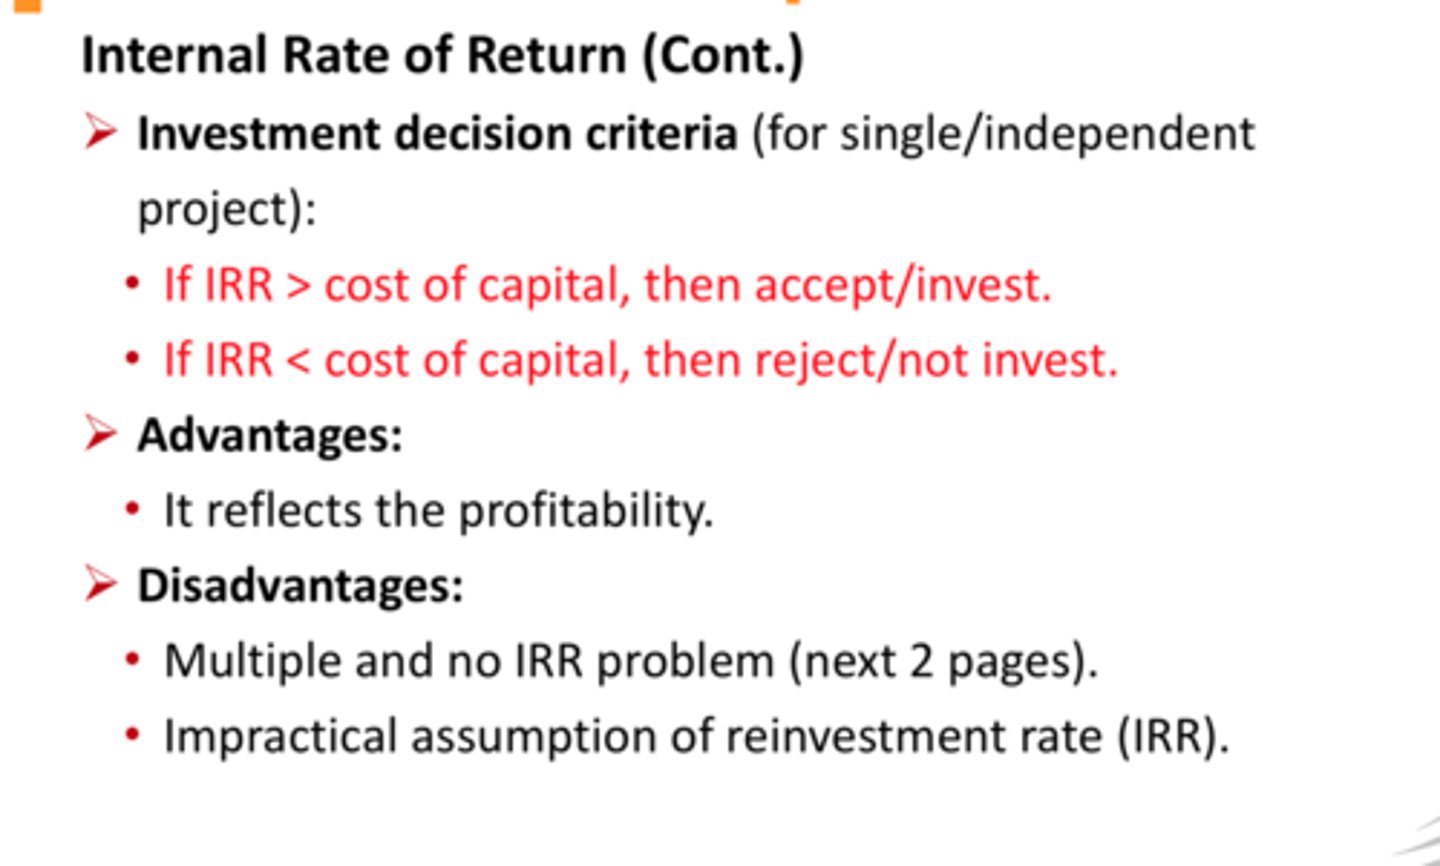
Internal rate of return (IRR)
Projected annual yield to determine if funding should be invested in a project; typically based on a minimum IRR required (hurdle rate).
Interrelationship diagram
Cause and effect diagram used to visualize complex problems.
Interviewing
Planned conversations with stakeholders, resulting in elicitation of documented information or requirements.
Job analysis
Technique used when creating job descriptions to clearly outline the activities to be performed and the skills needed to perform them well.
Joint application development or design
Elicitation technique used to bring a group of stakeholders to consensus about requirements or design (aka facilitated workshop).
Metrics/measurements
Objective, quantitative information used for solution evaluation and as-is/future-state comparisons.
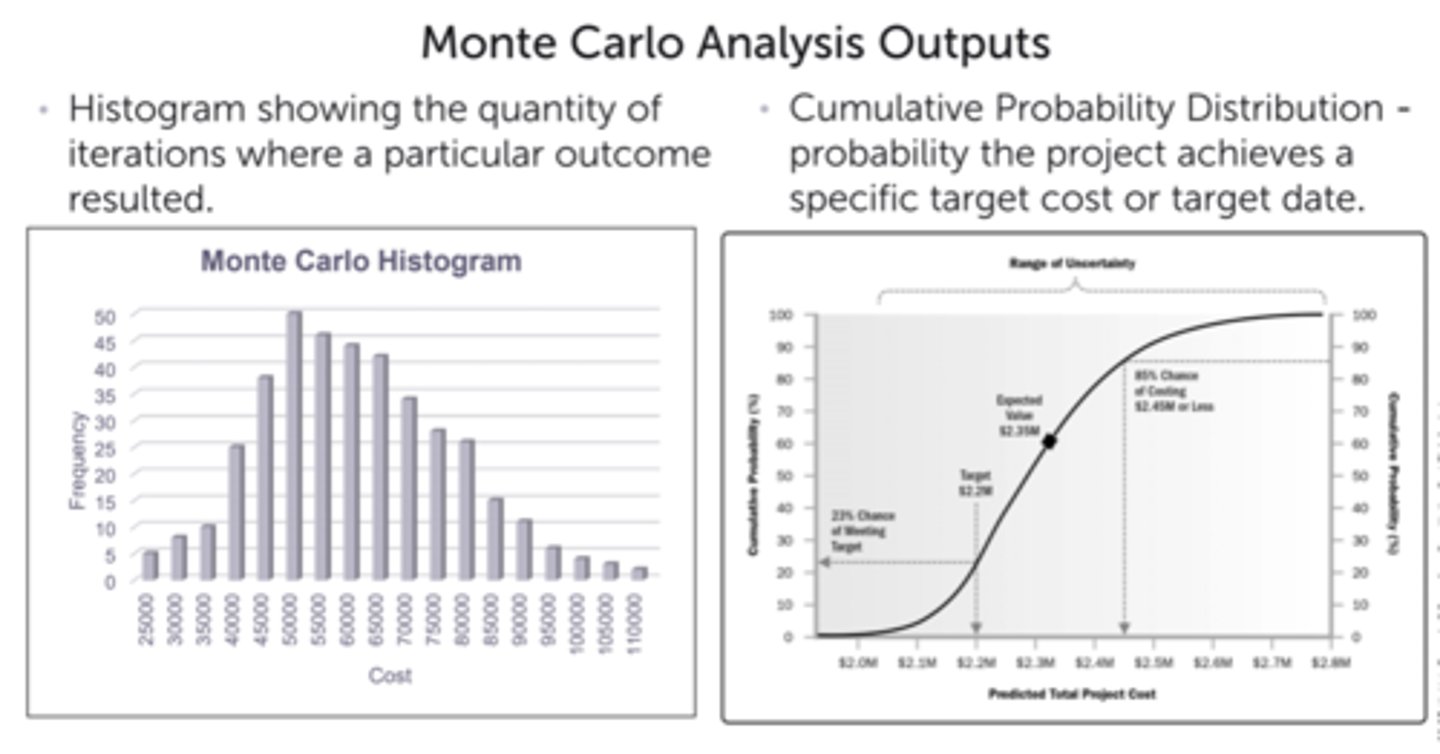
Monte Carlo analysis
Technique used in PM to simulate the outcome of a project based on 3-point estimates for each activity and the network diagram.
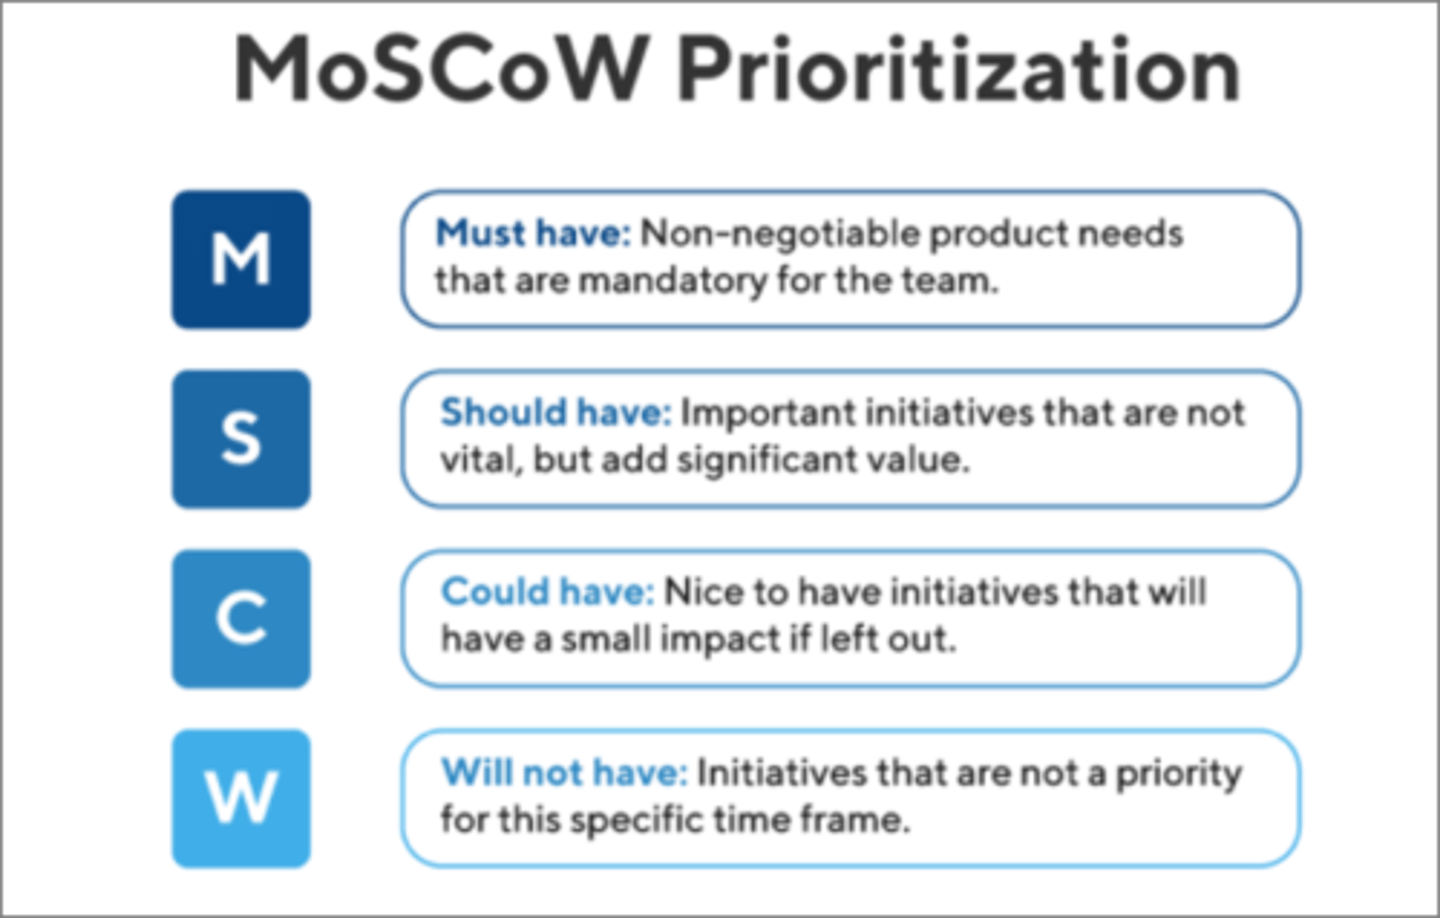
MoSCoW analysis
Technique for documenting requirements prioritization using must, should, could, or won't.
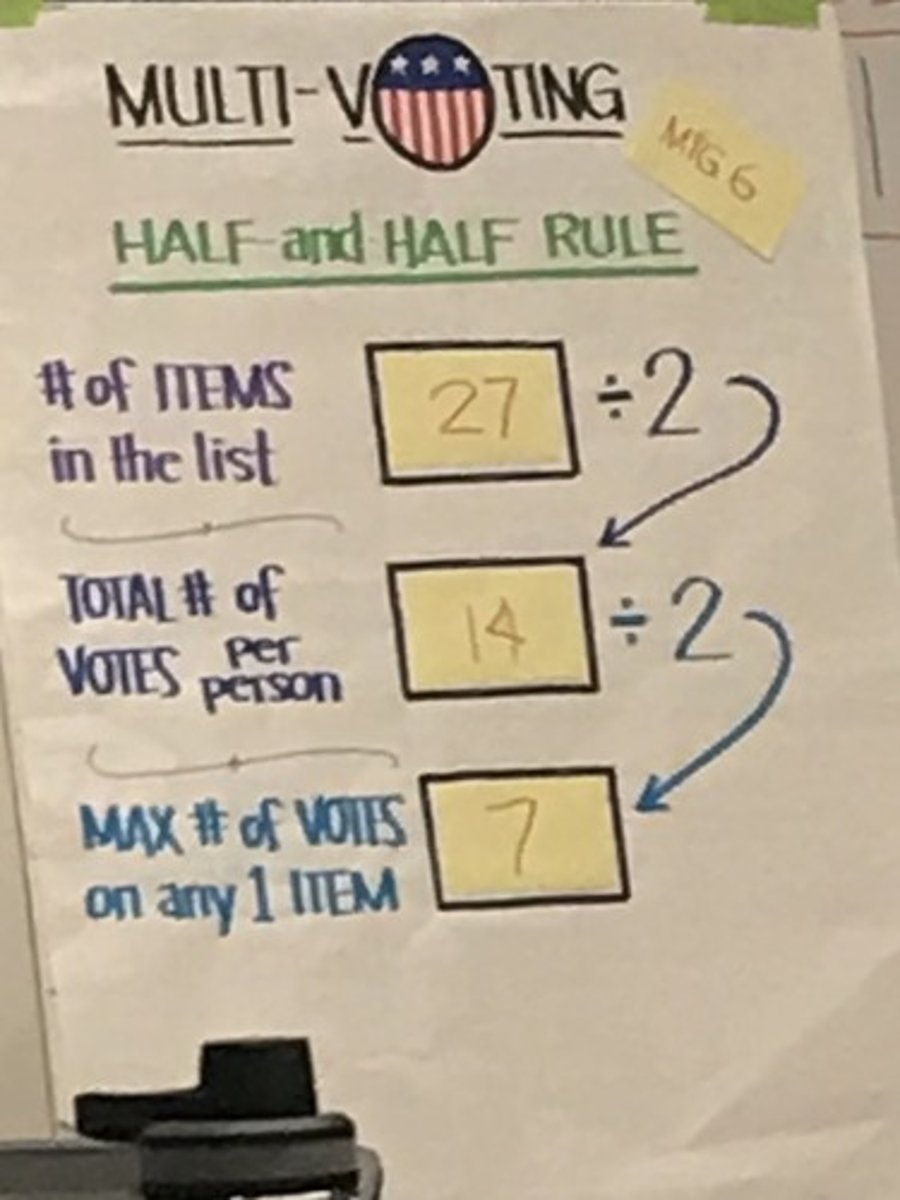
Multi-voting
Group decision making technique allowing participants to choose their preferred options from a list, resulting in a final list agreed to by all.
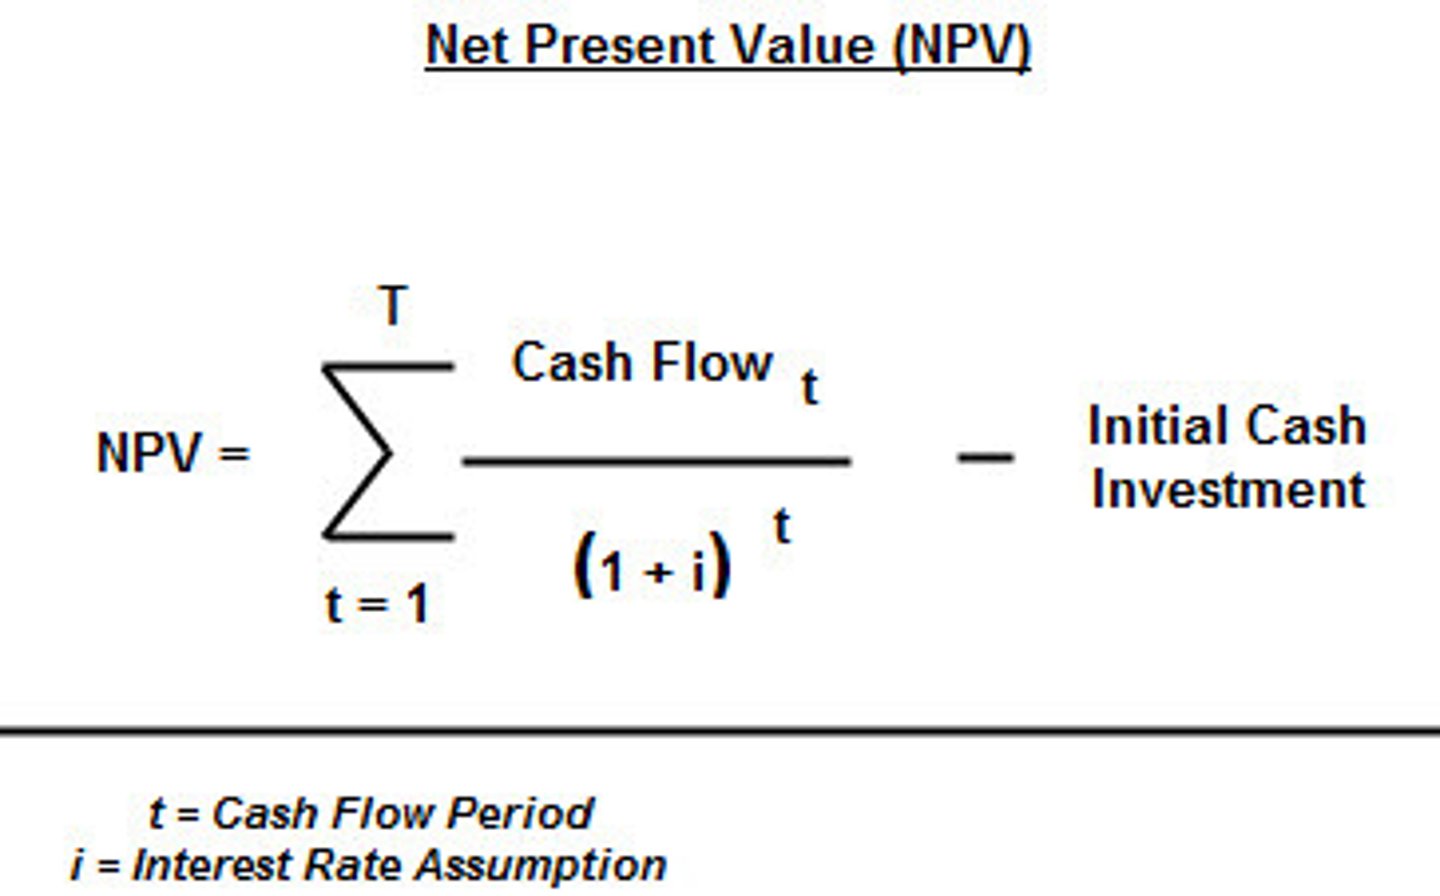
Net present value (NPV)
Financial calculation that predicts the current value of the proposed project based on estimated future benefits; often used to compare proposals.
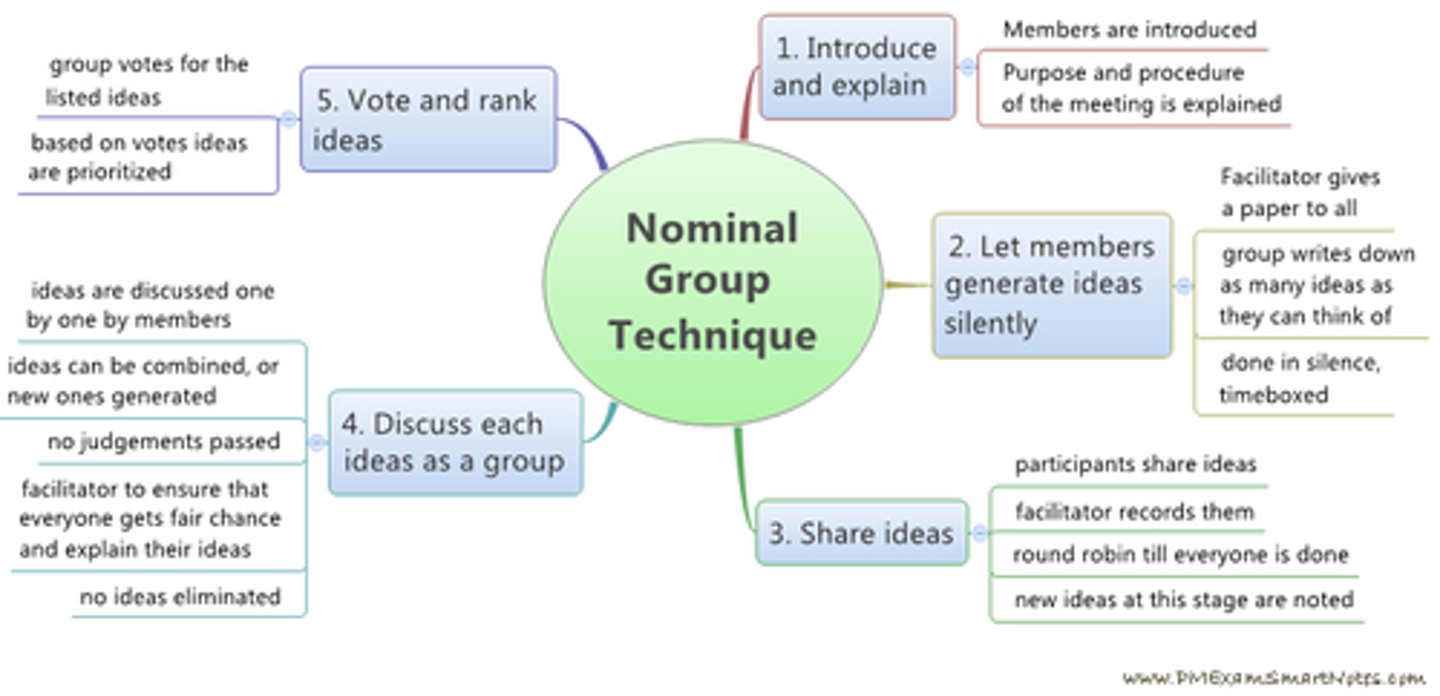
Nominal group
Group analysis technique using brainstorming for idea generation and interactive voting to rank the most useful ideas.
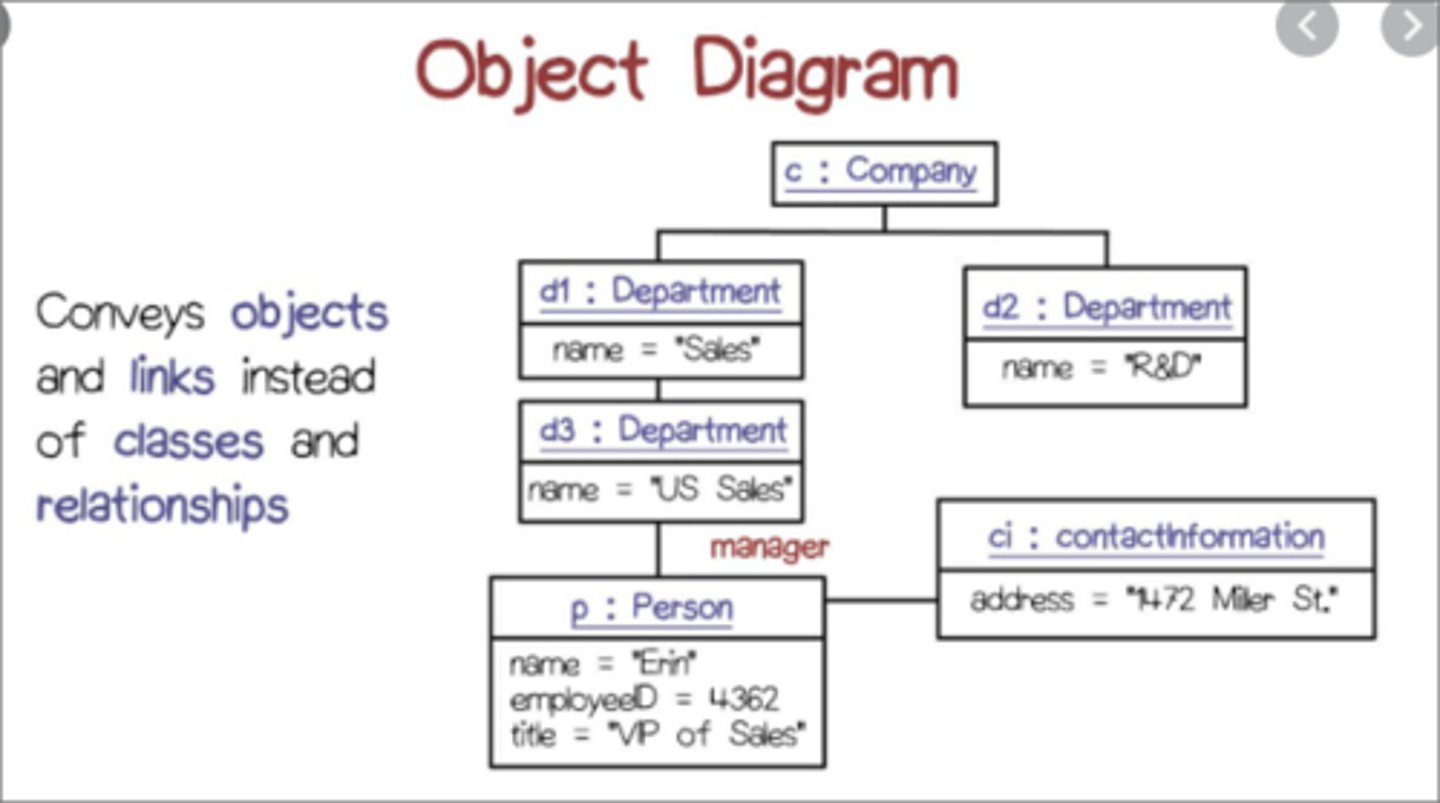
Object diagram
UML diagram showing the structure of a system at a point in time.
Observation
Watching a business worker perform a process to learn more about the work than could be gathered when reading a procedure or listening to a description (aka job shadowing).
Opportunity analysis
Analysis technique to determine the potential viability of successfully launching a new product or service.
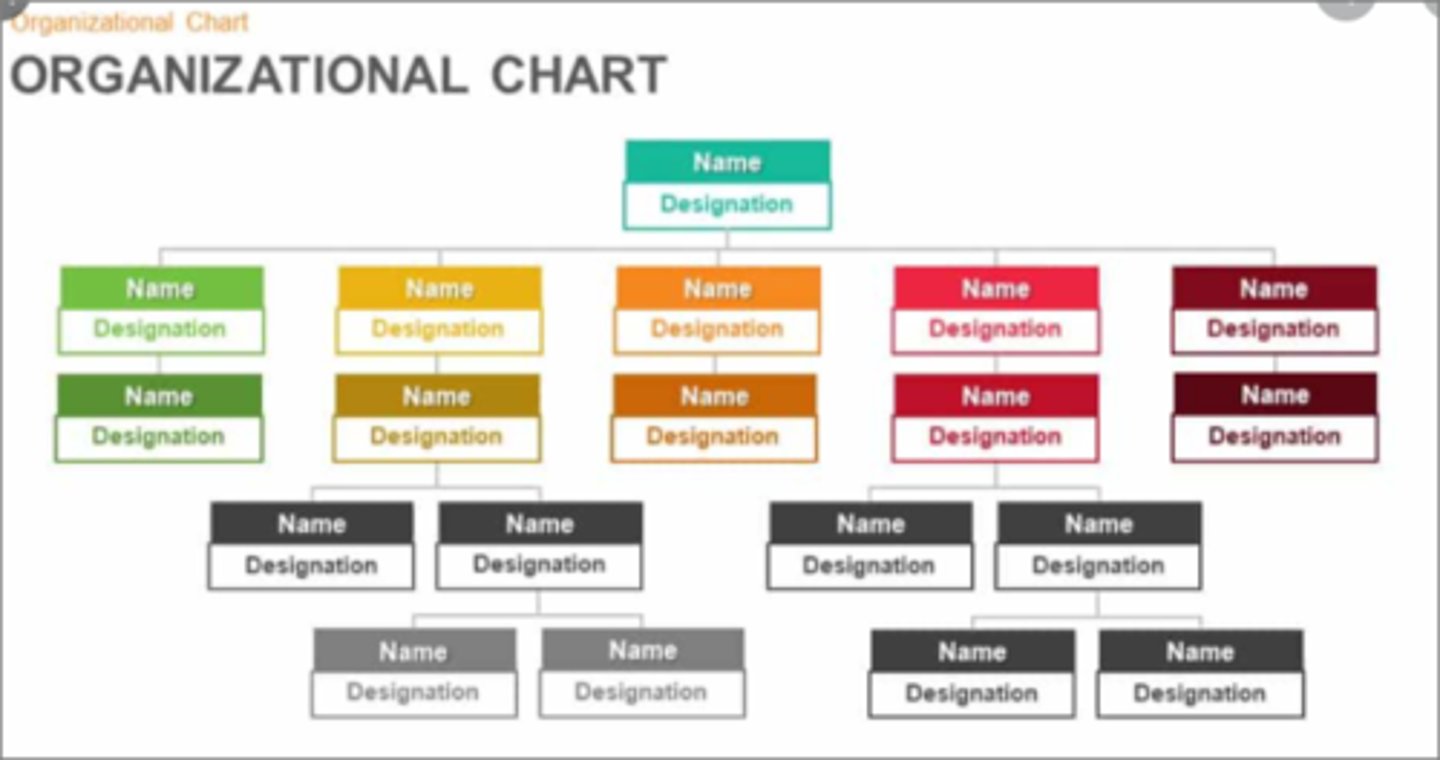
Organizational modeling, organizational breakdown, organizational chart
Diagrams or documents describing an organization's people, locations, operating units, products, services, and any other important information about the organization.
Pareto Analysis (80/20 rule)
80% of one component (such as time) will result in 20% of another component. Used to find the most valuable areas of focus (e.g., problems, requirements, issues). Helps with concentrating on the work with the biggest impact.
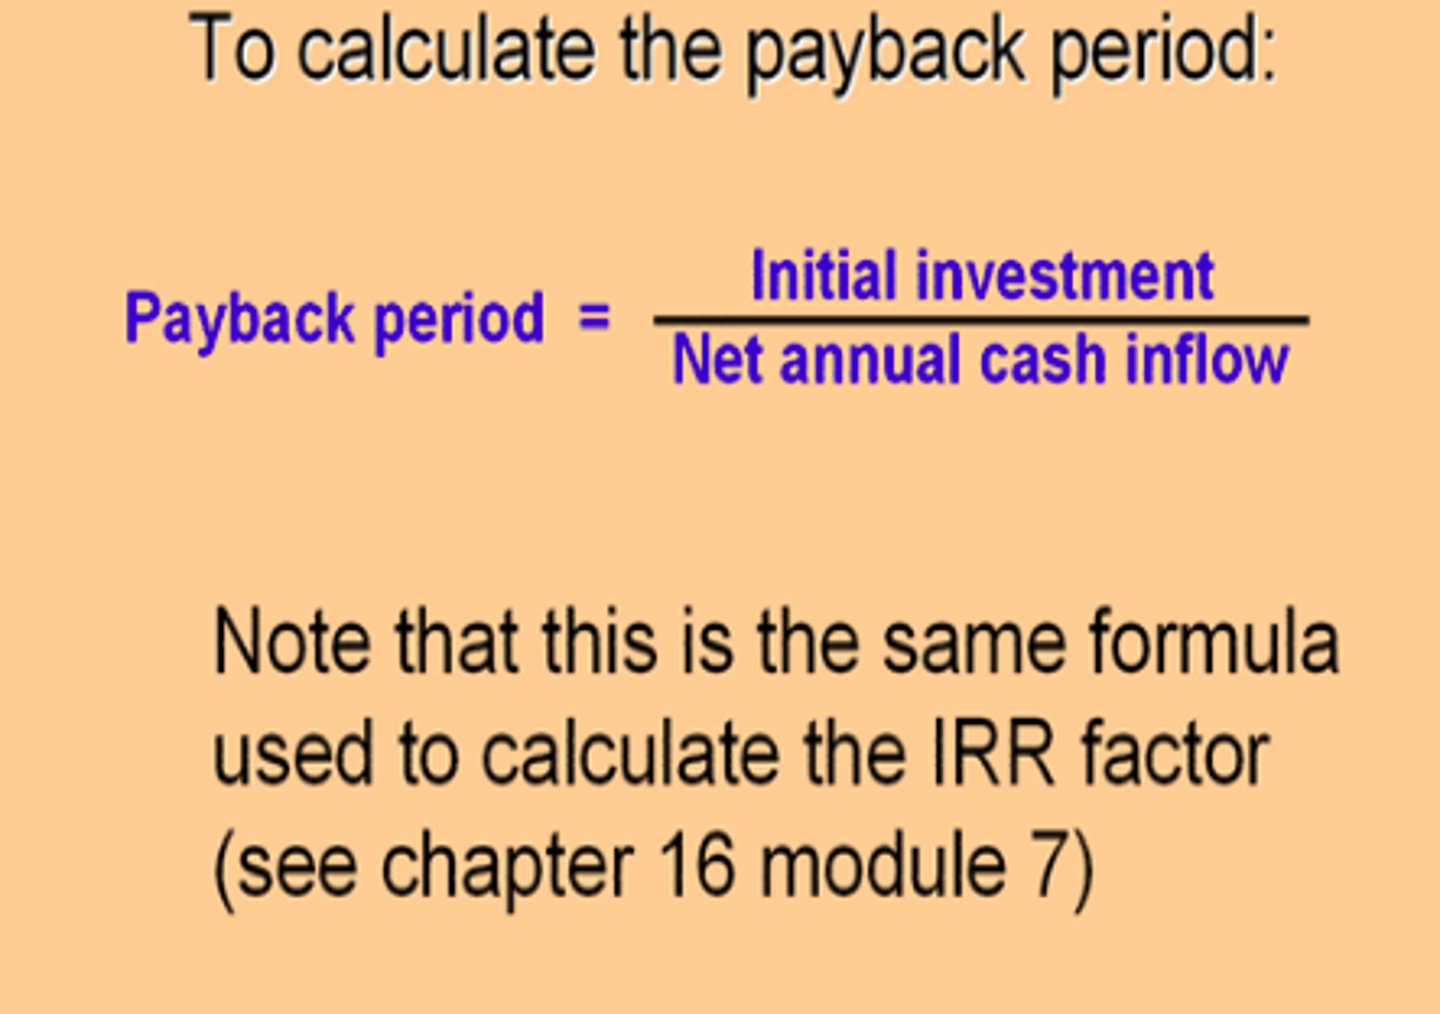
Payback period
The length of time that it takes for a project to fully recover its initial cost out of the net cash inflows that it generates.
Peer review
Human based testing; reviewing someone else's work to find inconsistencies, errors, and quality improvements.
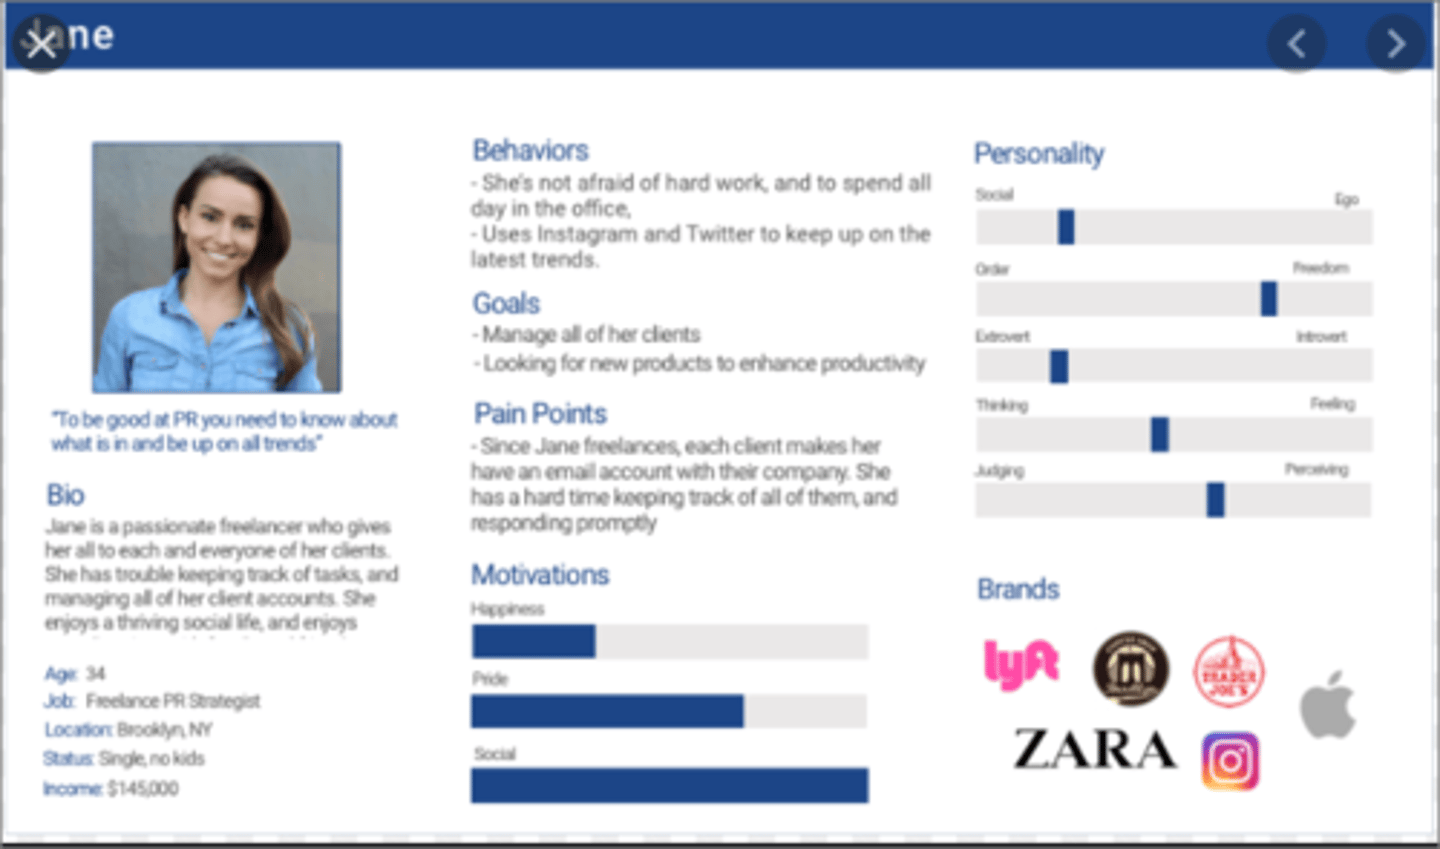
Persona analysis
Analyzing a type of user or worker (aka persona) to understand needs for product design. A persona is a fictional character created to represent a user group.
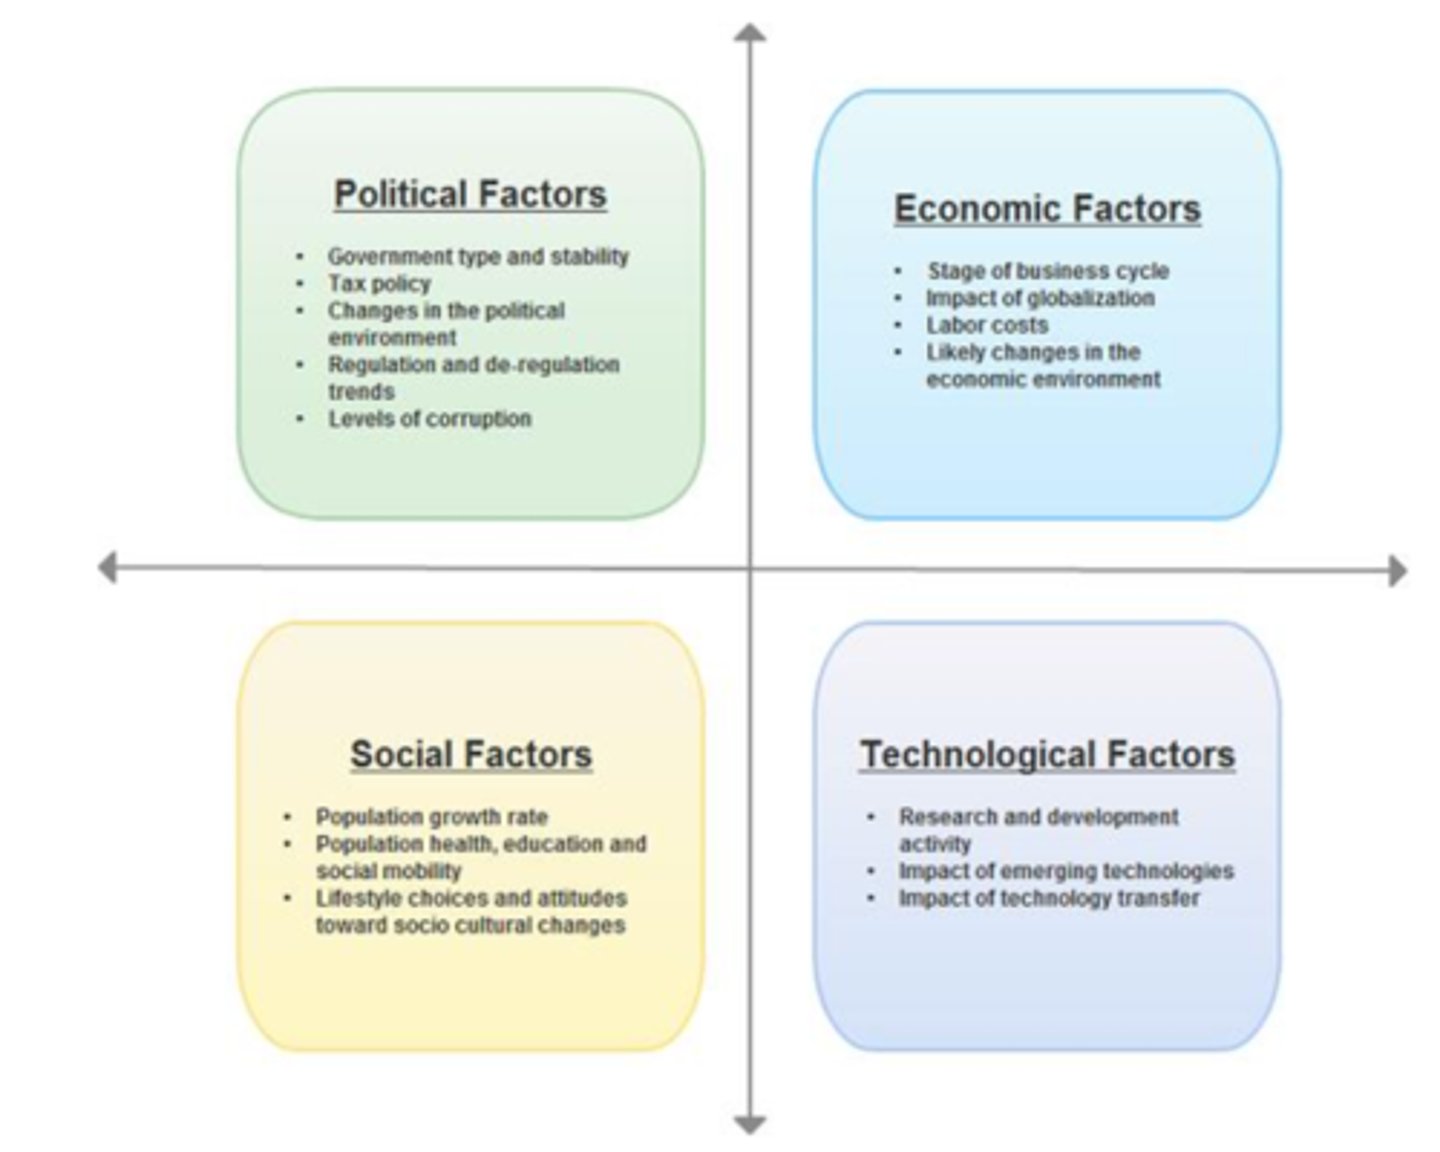
PEST, PESTLE analysis
Group of techniques used to investigate aspects of the global business environment, including political, economic, sociocultural, technological, legal, and environmental.
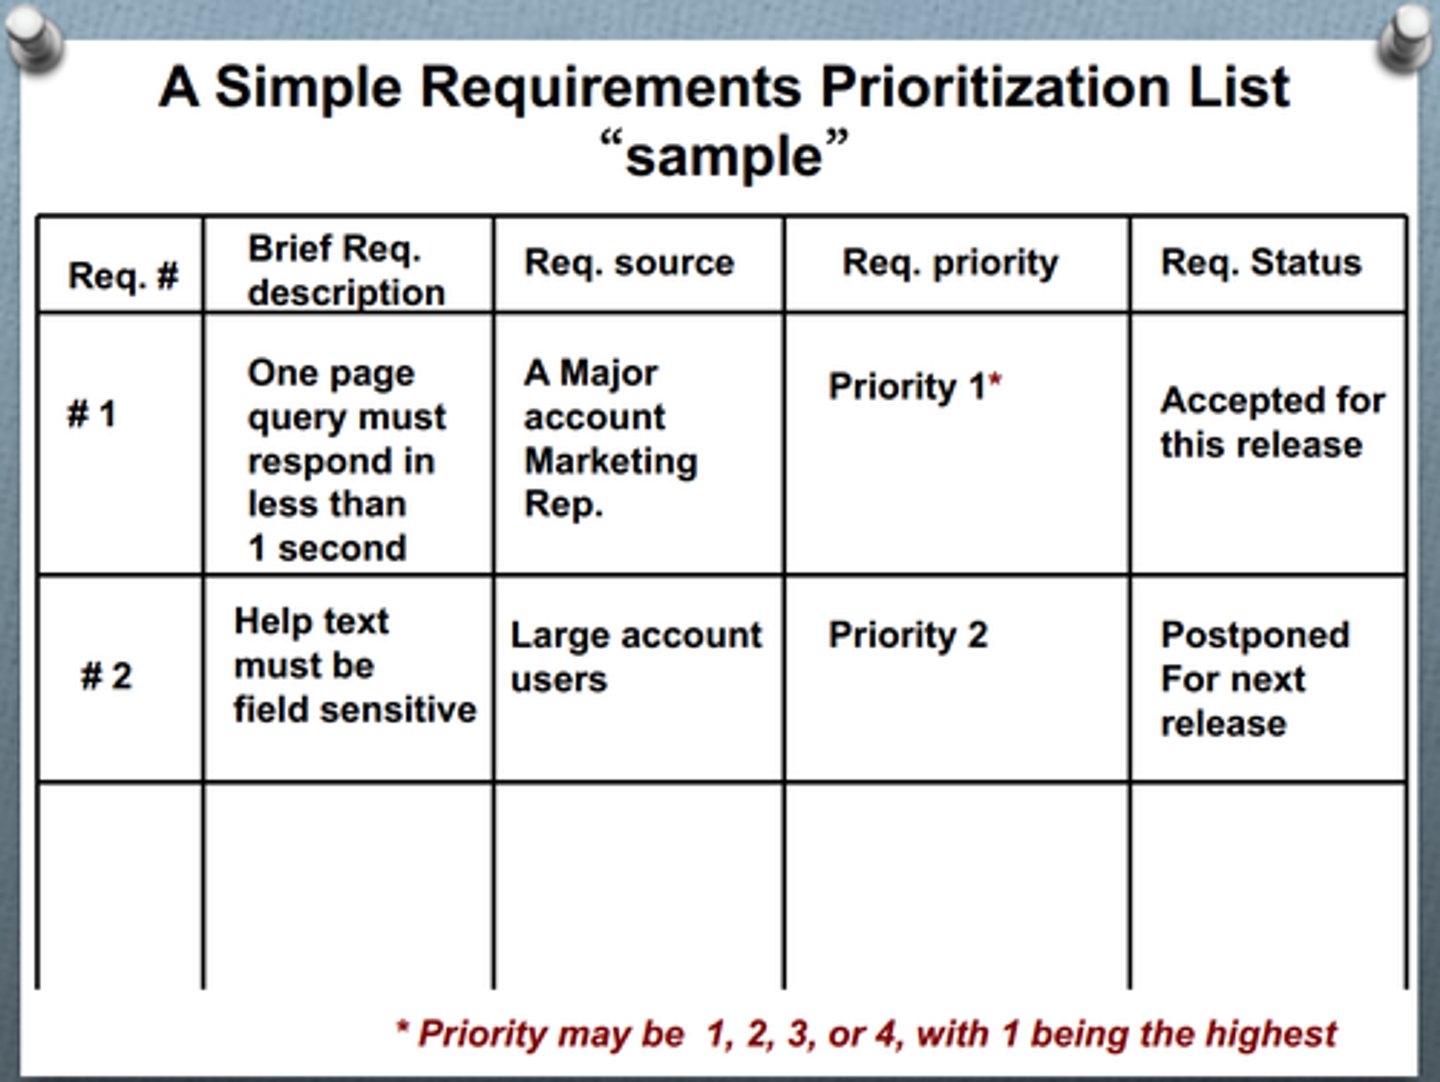
Prioritization of requirements
Recognition that not all requirements will result in the same value to the organization; also, a set of analysis techniques to help a group of stakeholders agree on development priorities.
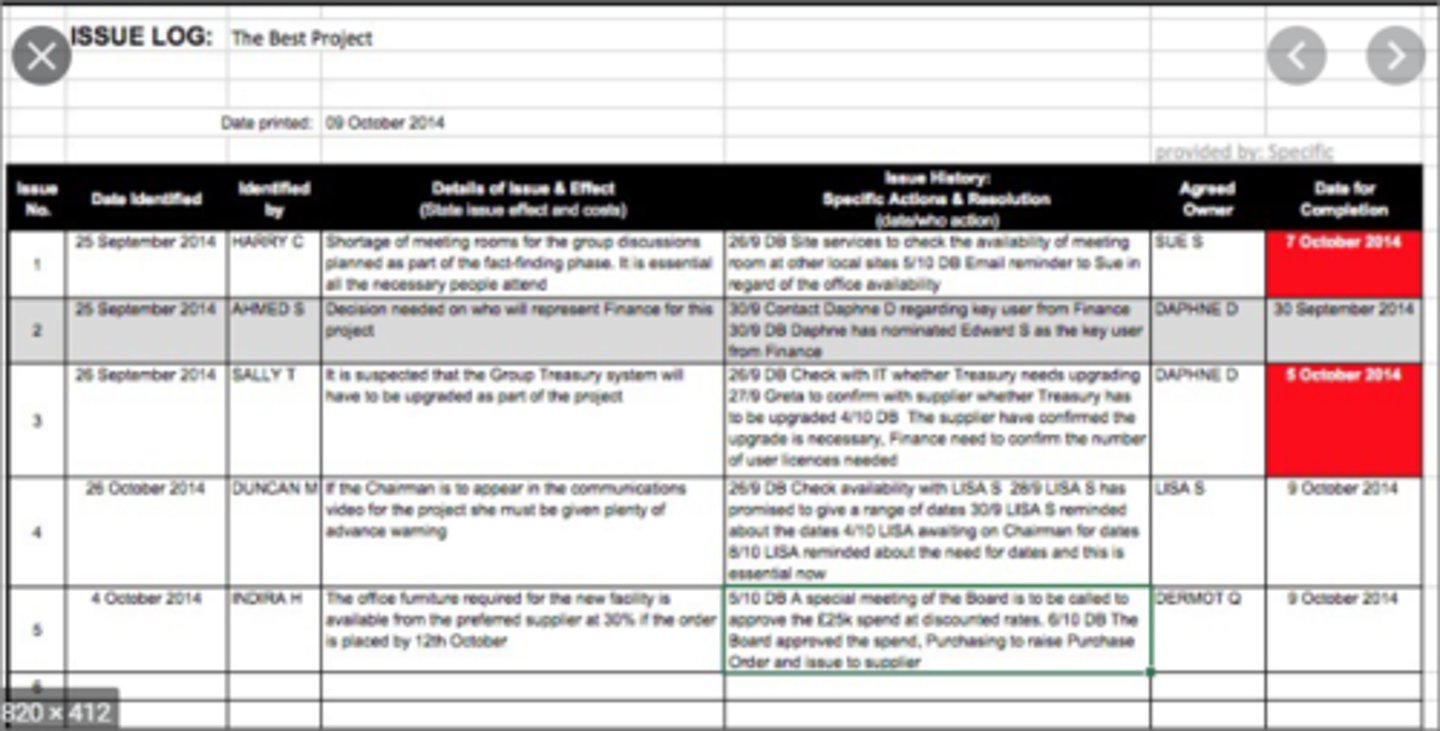
Problem tracking
Logging and resolving problems during a project (aka issue log, defect tracking)
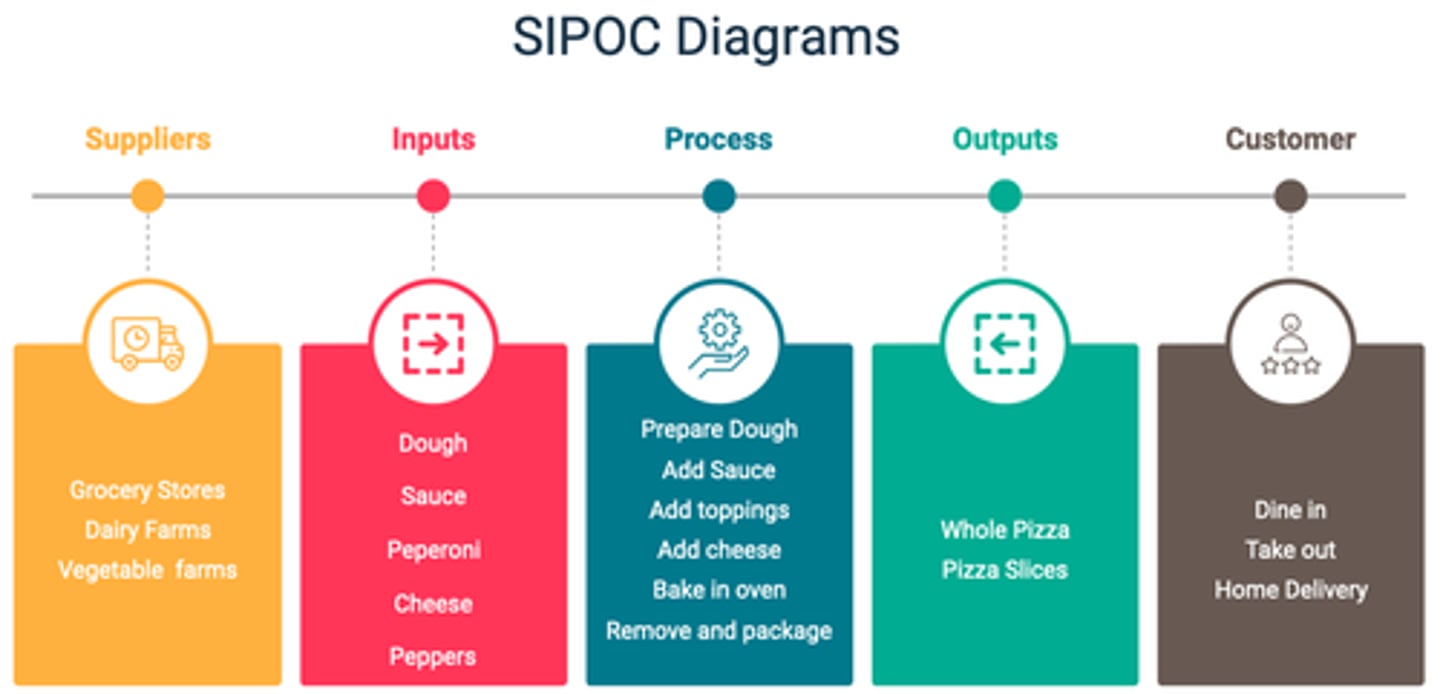
Process model or map
Analysis diagram and technique used to better understand a process (aka flowchart, workflow, SIPOC, process map).
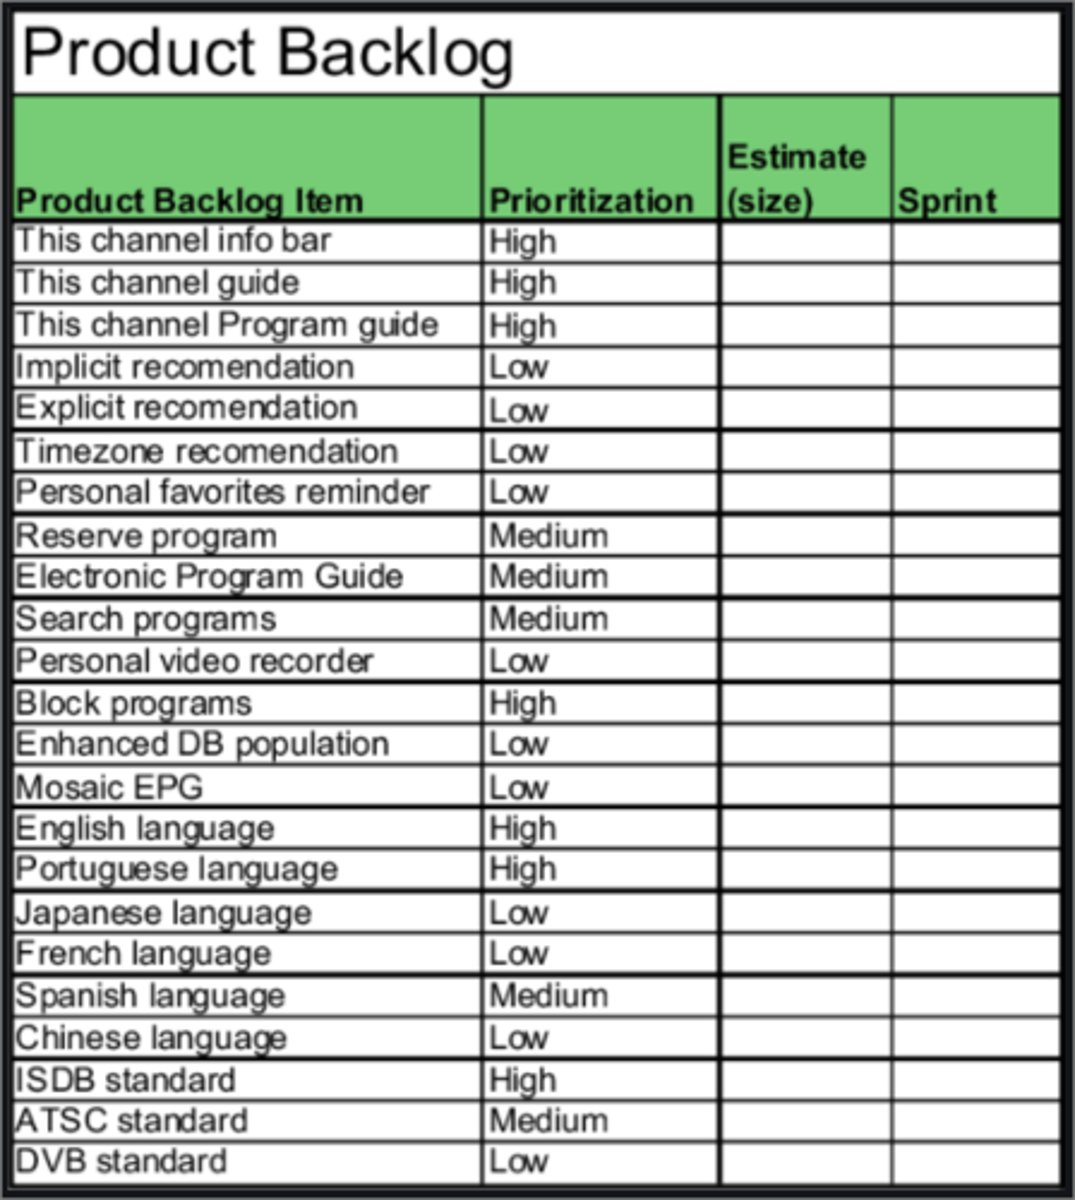
Product backlog
List of outstanding features, functions, capabilities, requirements, defects, etc. for a product (aka backlog).
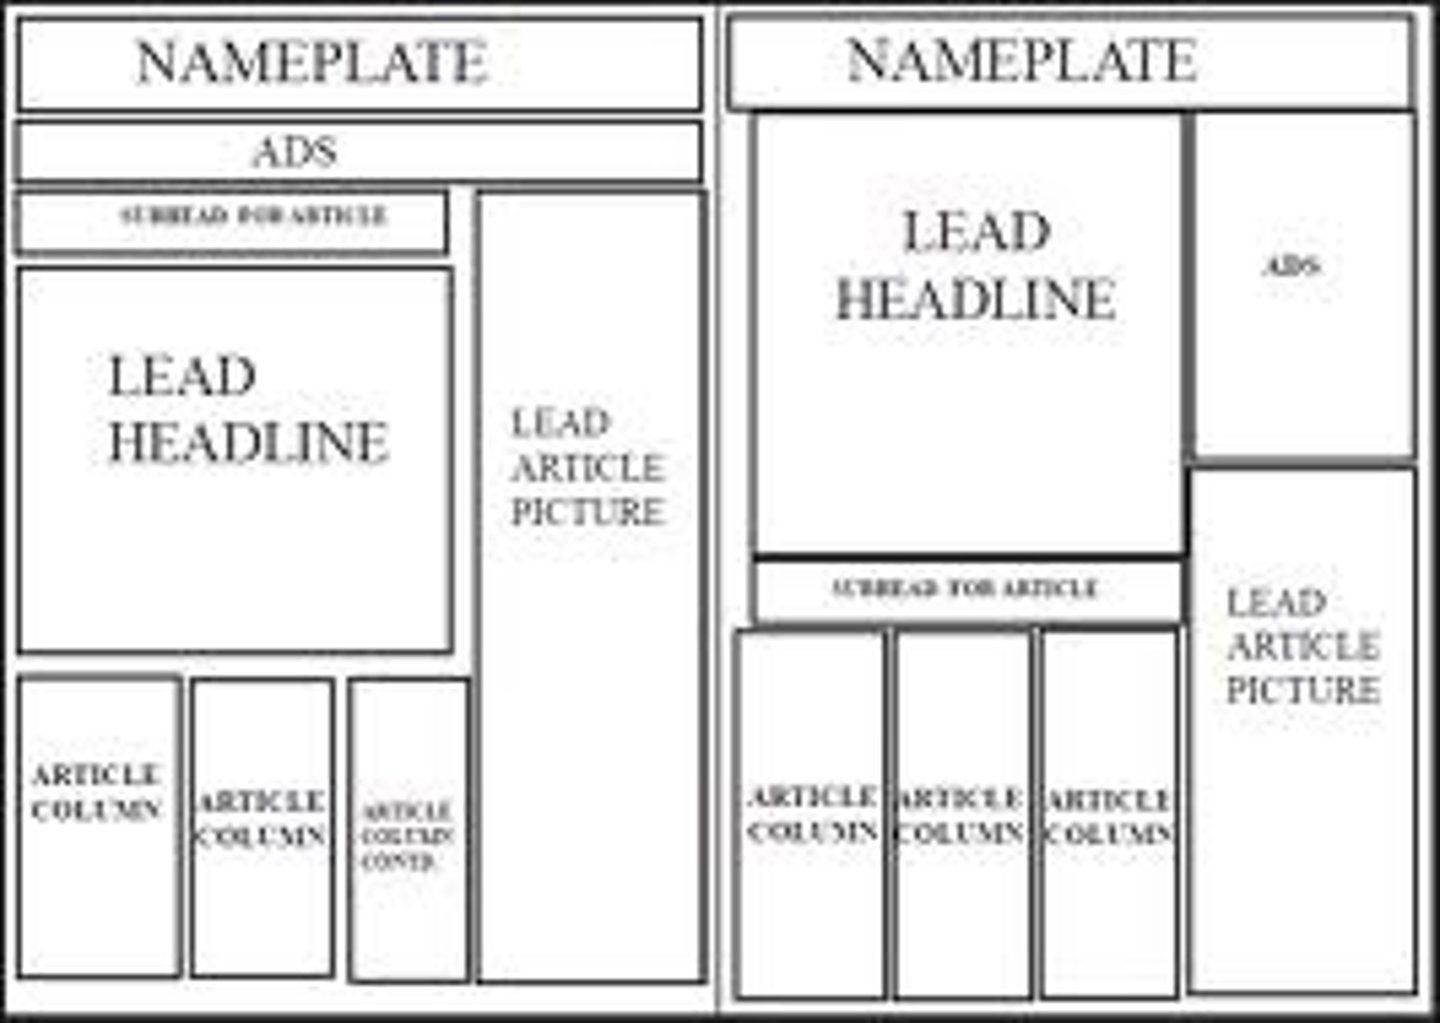
Prototyping
Tools used to present a product idea or model of a final product to a stakeholder for feedback (aka wireframes, storyboards, mockups).
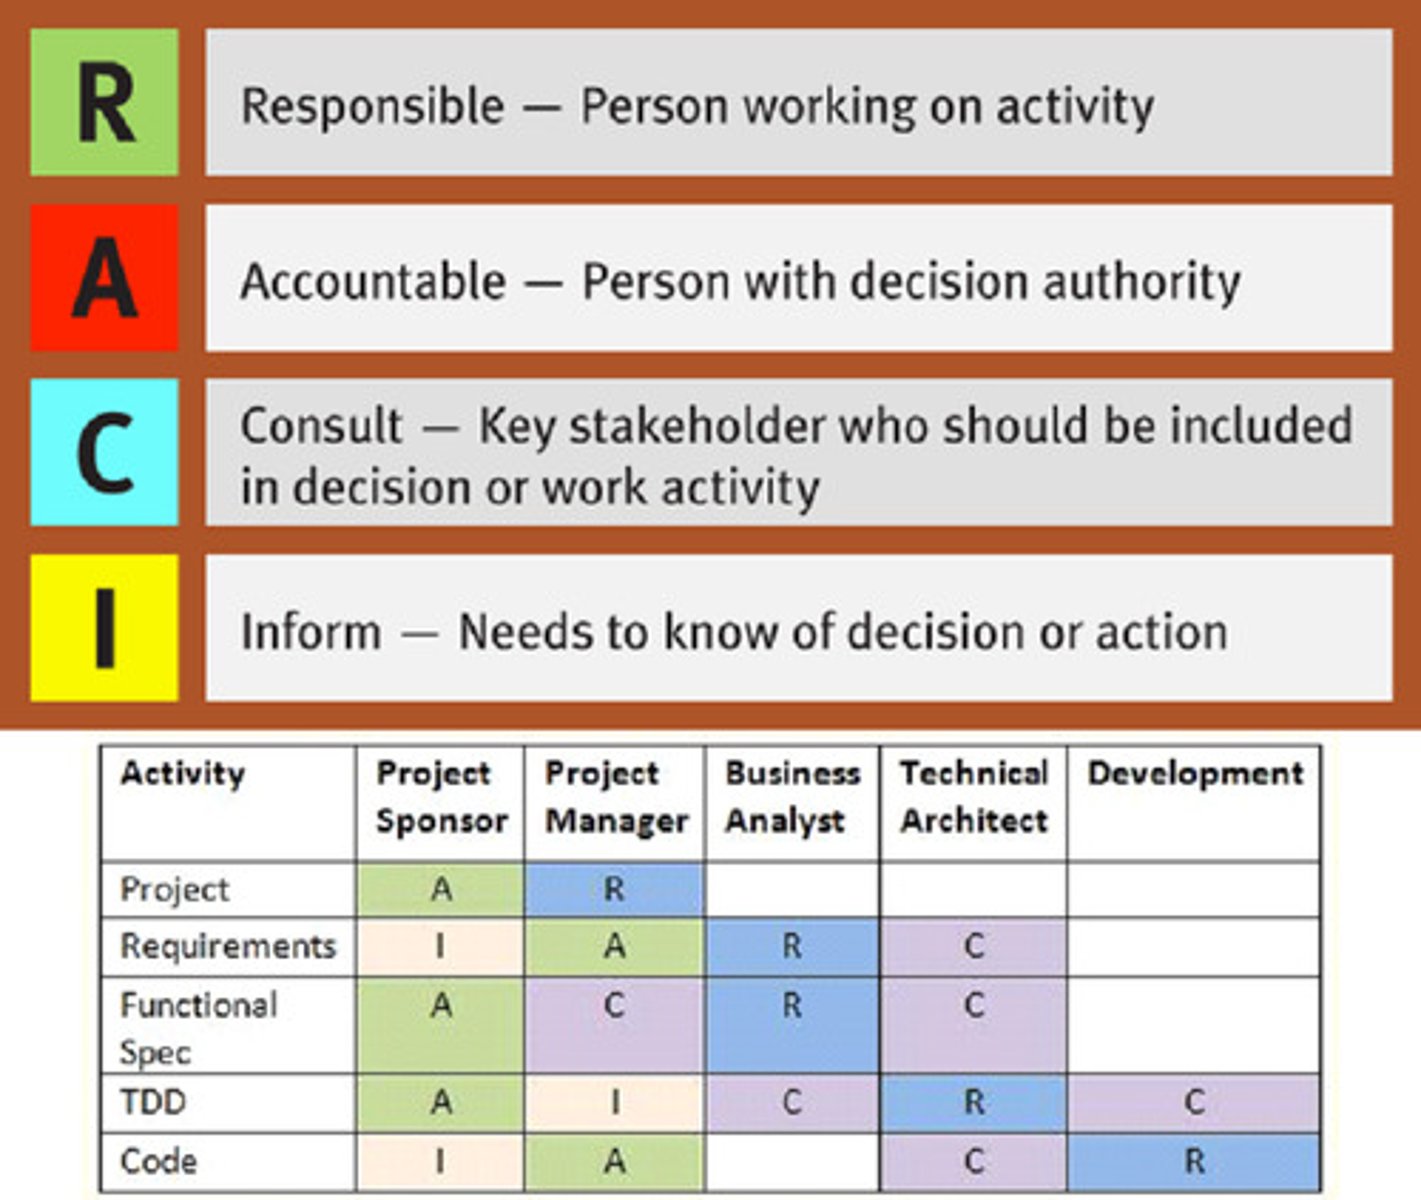
RACI
Responsible, Accountable, Consult, Inform
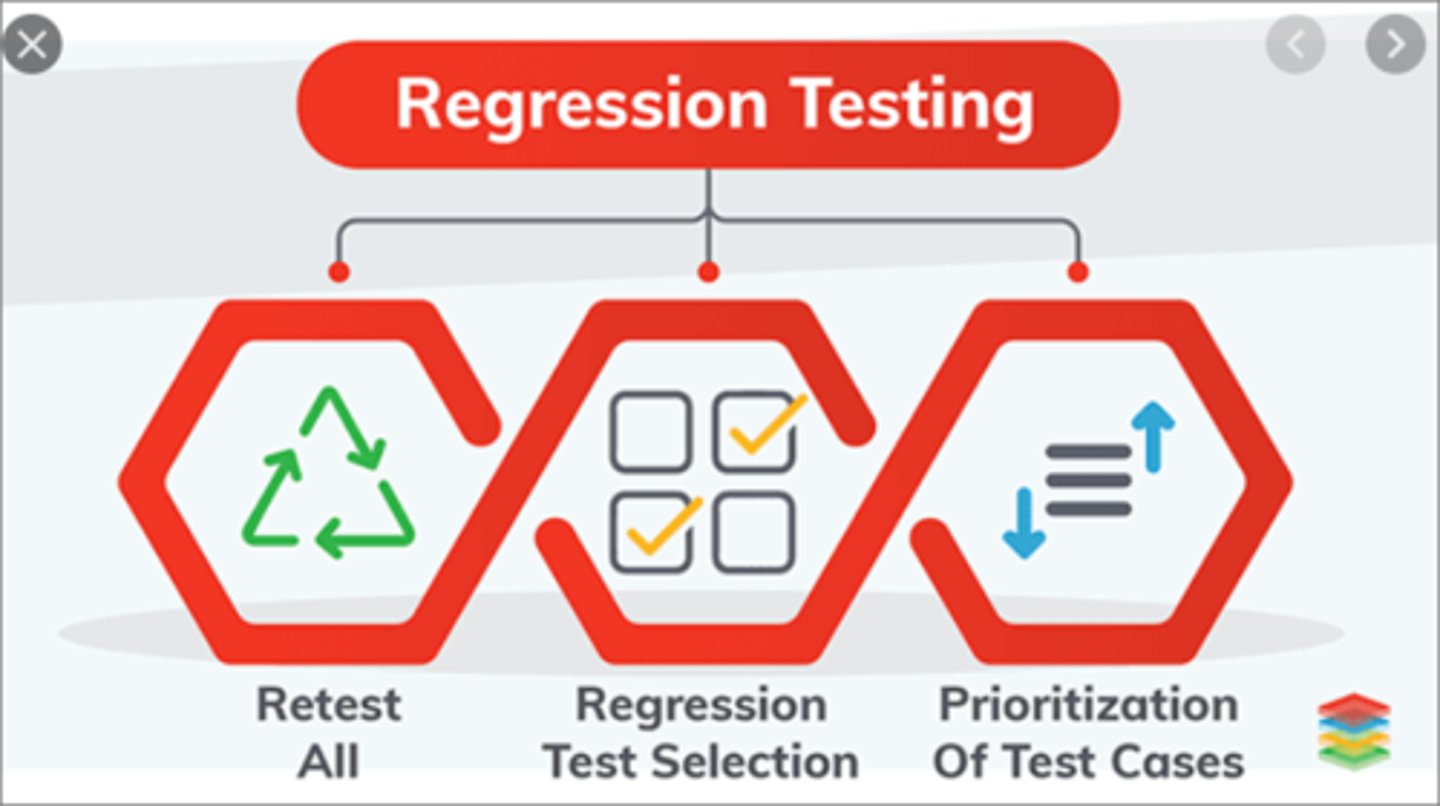
Regression testing
Retesting a unit, subsystem or system that has already been tested and then changed to ensure the change did not negatively impact the existing functionality.
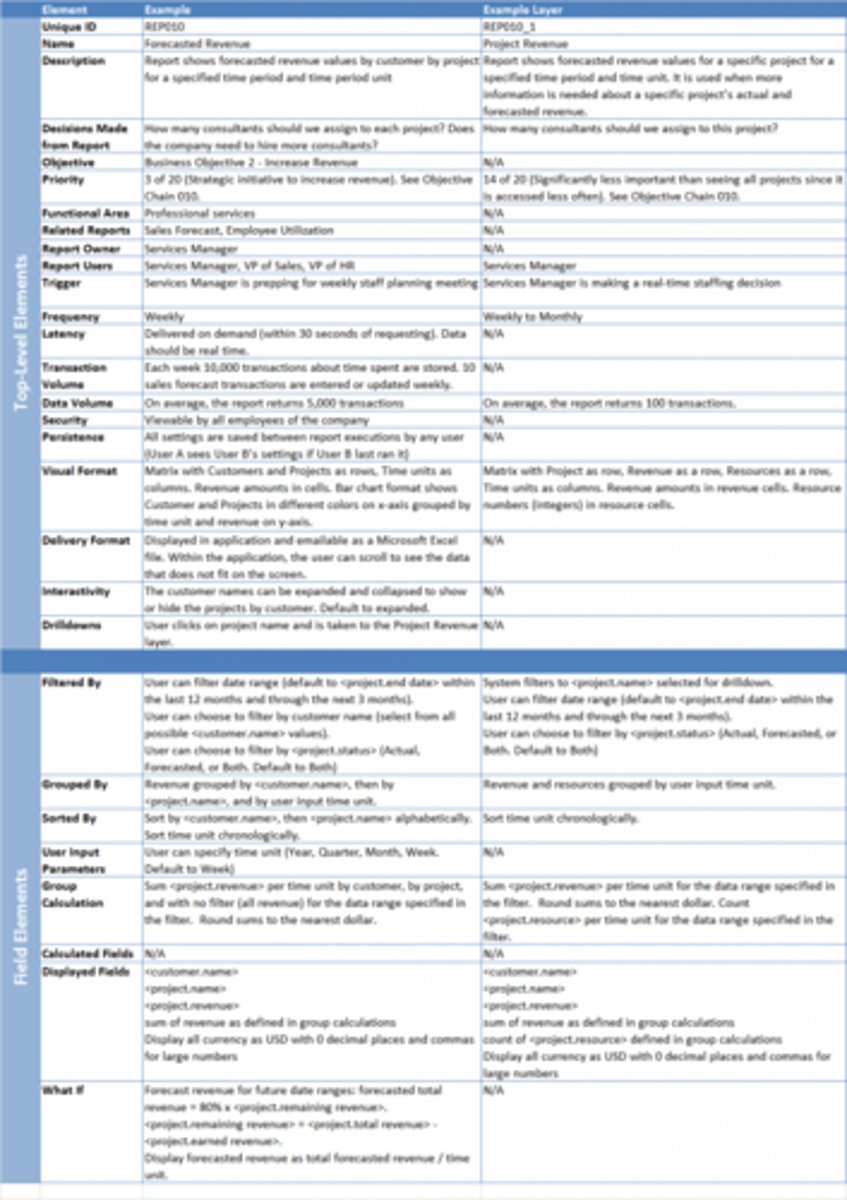
Report table
Format for documenting requirements related to a specific report; usually in conjunction with a report layout mockup.
Requirements attributes
Characteristics of requirements, e.g., name, unique identifier, date, identified, priority, source, and status.
Requirements state
Status or condition of a requirement, e.g., deferred, rejected or approved.
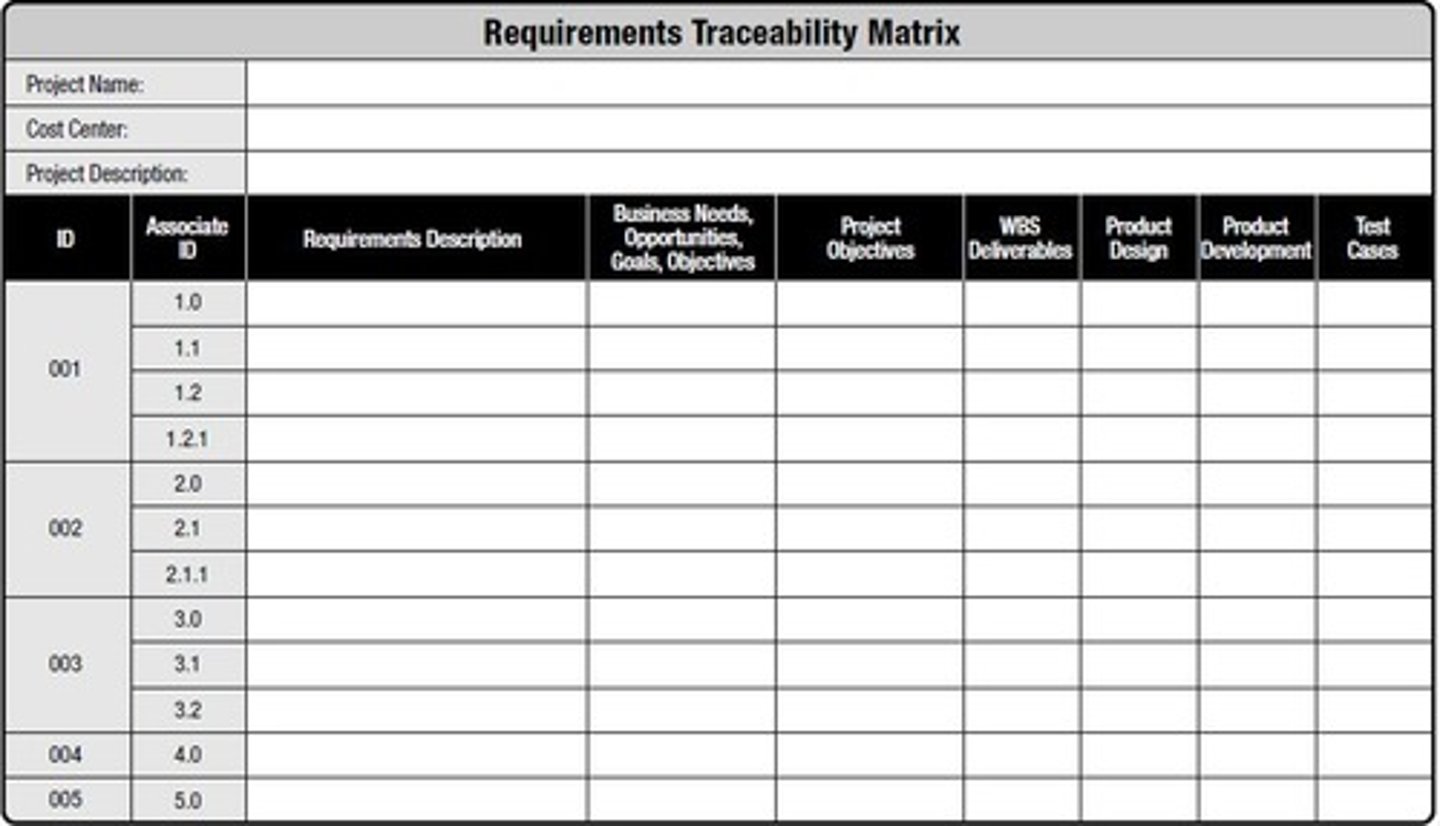
Requirements Traceability Matrix
Grid linking product or solution objectives to requirements solution deliverables, and/or test cases (aka traceability matrix).
Retrospective
Meeting in which participants discuss their past work in order to find better processes and ways to produce better products.
Return on Investment (ROI)
Projected % return on an investment calculated by taking the projected average of all net benefits and dividing them by the initial cost; typically based on minimum ROI required (aka hurdle rate).
RFP, RFQ, RFI
Docs used to get information about possible solutions from vendors, suppliers, or sellers.
Risk analysis
Examining and prioritizing risks for a program, project, or business. Risks are assessed for probability and impact; both quant and qual risk analyses are parts of project management.
Root cause analysis
Includes fishbone, cause and effect, Ishikawa diagrams and the 5 whys; Analytical techniques used to find the underlying or core problem given as set of symptoms, e.g. defects, risks, or variances.

Sequence diagram
A modelling technique describing how user or system processes interact with one another across any involved users or systems, includes the order in which the processes or steps are performed.