chapter 5 research and methods
5.0(1)
Card Sorting
1/58
Earn XP
Description and Tags
Last updated 12:37 AM on 10/27/22
Name | Mastery | Learn | Test | Matching | Spaced | Call with Kai |
|---|
No analytics yet
Send a link to your students to track their progress
59 Terms
1
New cards
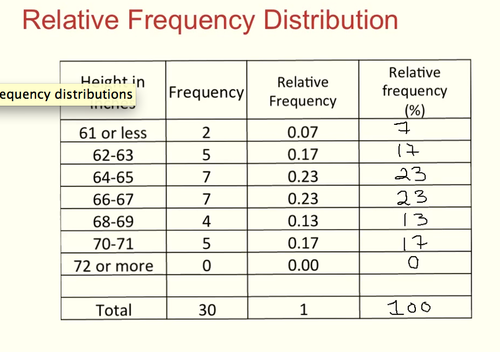
Frequency Distribution
an orderly arrangement of scores indicating the frequency of each score or group of scores
2
New cards
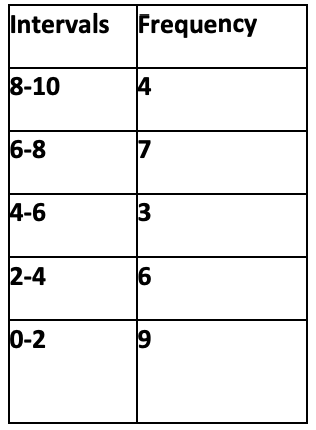
class interval frequency distribution
a table in which the scores are grouped into intervals and listed along with the frequency of scores in each interval
3
New cards
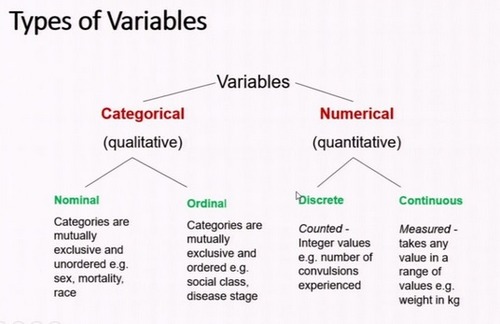
qualitative variable
a characteristic that is defined by its presence or absence in a category ( use bar graph)
4
New cards
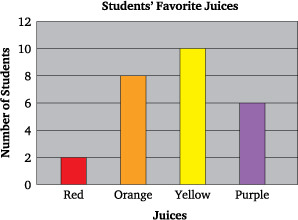
bar graph
a graph that uses vertical or horizontal bars to show comparisons among two or more items (nominal)
5
New cards
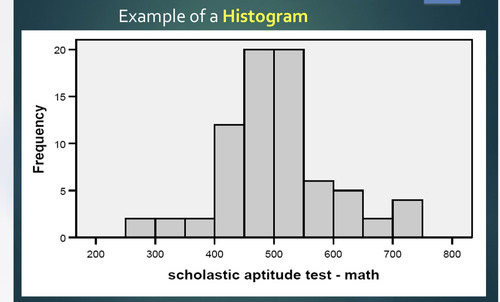
histrogram
a diagram consisting of rectangles whose area is proportional to the frequency of a variable and whose width is equal to the class interval. ( ratio, interval, ordinal)
6
New cards
Quatitative
data measured and has numerical value (histogram)
7
New cards
descriptive methods
case study
survey
naturalistic observation
(DON'T SHOW CAUSE/EFFECT)
survey
naturalistic observation
(DON'T SHOW CAUSE/EFFECT)
8
New cards
archival research
method of research using past records or data sets to answer various research questions, or to search for interesting patterns or relationships
9
New cards
frequency polygon
graph of a frequency distribution that shows the number of instances of obtained scores, usually with the data points connected by straight lines ( ratio, interval, ordinal)

10
New cards
measure of central tendencies
a Number that means middle
Mean: Average
Median: Middle Number
Mode: Most common number
Mean: Average
Median: Middle Number
Mode: Most common number
11
New cards
measure of variation
A measure used to describe the distribution of data
range
Standard deviation
Average deviation
range
Standard deviation
Average deviation
12
New cards
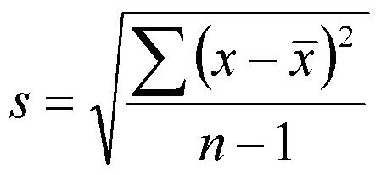
standard deviation
a computed measure of how much scores vary around the mean score
13
New cards
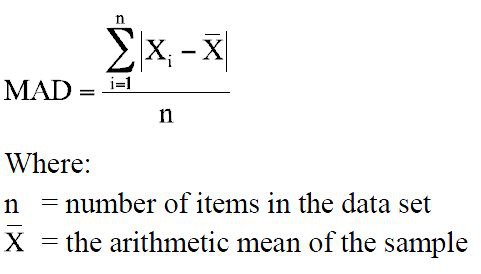
average deviation
An alternative measure of variation that, like the standard deviation, indicates the average difference between the scores in a distribution and the mean of the distribution. X - mean
14
New cards
variance
standard deviation squared
15
New cards
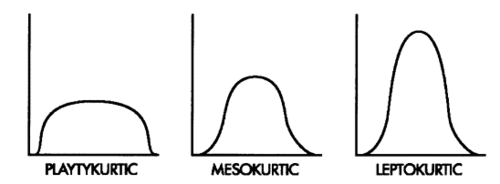
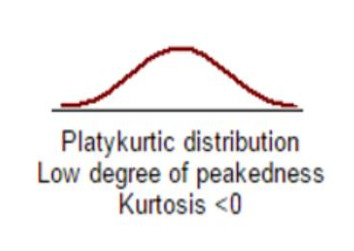
Kurtosis
how flat or peaked a normal distribution is
16
New cards
Mesokurtic
normal curves that have peaks of medium height and distributions that are moderate in breadth
17
New cards
Playkurtic
distribution is low and flat because the scores are spread out
18
New cards
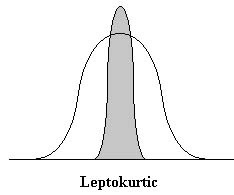
Leptokurtic
normal curves that are tall and thin, with only a few scores in the middle of the distribution having a high frequency
19
New cards
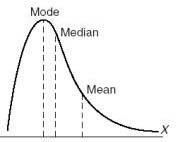
Postive skewed distribution
Most of the scores are bunched towards the left. The mode is to the left of the mean because the mean is affected by the extreme scores tailing off to the right.
20
New cards
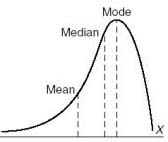
negative skewed distribution
Most of the scores are bunched towards the right. The mode is to the right of the mean because the mean is affected by the extreme scores tailing off to the left.
21
New cards
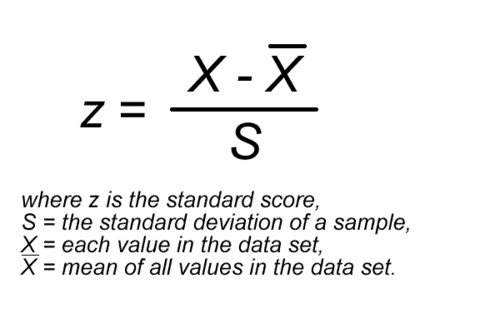
z-score
a measure of how many standard deviations you are away from the norm (average or mean)
22
New cards
standard normal distribution
A normal distribution with a mean of 0 and a standard deviation of 1.
23
New cards
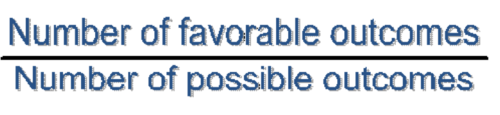
Probability
A number that describes how likely it is that an event will occur
24
New cards
hypothesis testing
the theory, methods, and practice of testing a hypothesis by comparing it with the null hypothesis. The null hypothesis is only rejected if its probability falls below a predetermined significance level, in which case the hypothesis being tested is said to have that level of significance.
25
New cards
ask about probability testing
26
New cards
Use descriptive statistics when
One is describing a complete a sample of scores or events
27
New cards
Use inferential statistics when:
Want to generalize from a sample of known scores to a population of unknown scores
28
New cards
one-tailed alternative hypothesis
only one direction of an effect or relationship is predicted in the alternative hypothesis of the test
29
New cards
two-tailed alternative hypothesis
The means of the groups being compared differ in any way
30
New cards
type one error
rejecting null hypothesis when it is actually true - a false positive
31
New cards
type two error
Wrongly accepting the null hypothesis
32
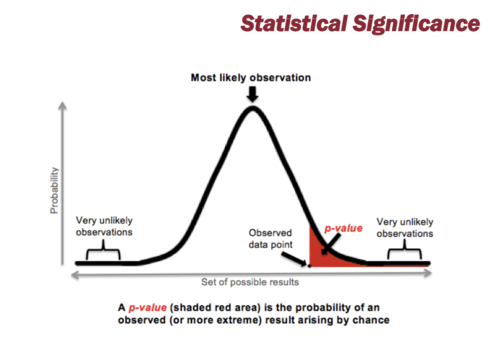
New cards
statical significance
A statical statement of how likely it is that an obtained result occurred by chance ( for the study to be valid must be less the 0.05)
33
New cards
descriptive statistics
describe distribution (minimum, maximum, mean, standard deviation)
34
New cards
inferential statistics
procedures for drawing conclusions about a population based on data collected from a sample
35
New cards
measure of variation
A number that indicates the degree to which scores are either clustered or spread out in a distribution
36
New cards
variance
the standard deviation squared
37
New cards
mail survey
a written survey that is self-administered
38
New cards
Telephone survey
survey conducted via telephone in which questions are read to the respondents
39
New cards
open-ended questions
questions for which respondents formulate their own responses
40
New cards
close-ended questions
questions on which respondents must choose from a limited number of alternatives
41
New cards
partially open-ended questions
closed-ended questions with an open-ended "other" option.
42
New cards
rating scales (Likert scales)
respondents rate on a numeric scale indicating the direction and strength of their response
43
New cards
stratified random sampling
a sampling technique designed to ensure that subgroups or strata are fairly represented
44
New cards
cluster sampling
a sampling technique in which clusters of participants that represent the population are used
45
New cards
convenience sampling
a sampling technique in which participants are obtained wherever they can be found and typically wherever is convenient for the researcher
46
New cards
quota sampling
a sampling technique that involves ensuring that the sample is like the population on certain characteristics but uses convenience sampling to obtain the participants
47
New cards
sampling bias
a tendency for one group to be overrepresented in a sample
48
New cards
interviewer bias
the tendency for the person asking the questions to bias the participant's answers
49
New cards
socially desirable responses
a response that is given because a respondent believes it is deemed appropriate by society
50
New cards
expectancy effects
51
New cards
narrative records
full narrative descriptions of a subject's behavior
52
New cards
checklist
a tally sheet on which the researcher
53
New cards
static item
type of item in which attributes that do not change are recorded
54
New cards
action item
type of item used to note the presence or absence of behaviors
55
New cards
qualitative research
a type of social research based on field observations that is analyzed without statistics
56
New cards
loaded question
a question that includes nonneutral
57
New cards
leading question
a question phrased in such a way as to suggest the desired answer; a lawyer may ask leading questions on cross-examination
58
New cards
double-barreled
a question that asks more than one thing
59
New cards
response bias
the tendency to consistently give the same answer to almost all of the items on a survey