AP Macroeconomics Unit 5: Long-Run Consequences of Stabilization Policies
1/33
Earn XP
Name | Mastery | Learn | Test | Matching | Spaced | Call with Kai | Chat |
|---|
No analytics yet
Send a link to your students to track their progress
34 Terms
Phillips Curve
A curve showing the tradeoff between inflation and unemployment.
Short Run Phillips Curve (SRPC)
A curve representing the short-term trade off between unemployment and inflation. The relationship is inverse.
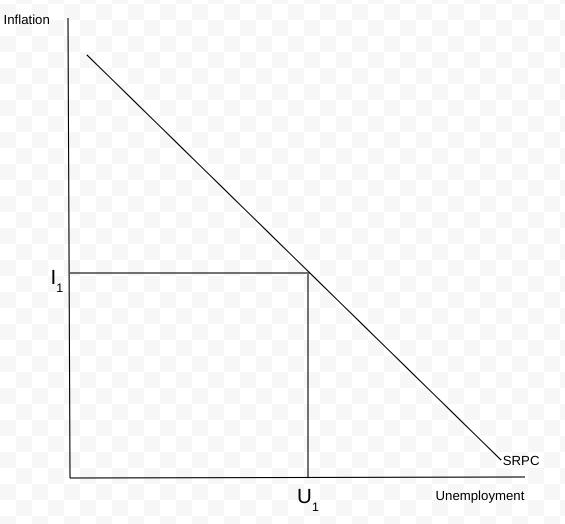
An overheating/inflationary economy is represented by:
a high inflation rate but low unemployment
A recessive economy is represented by:
a low inflation rate but high unemployment
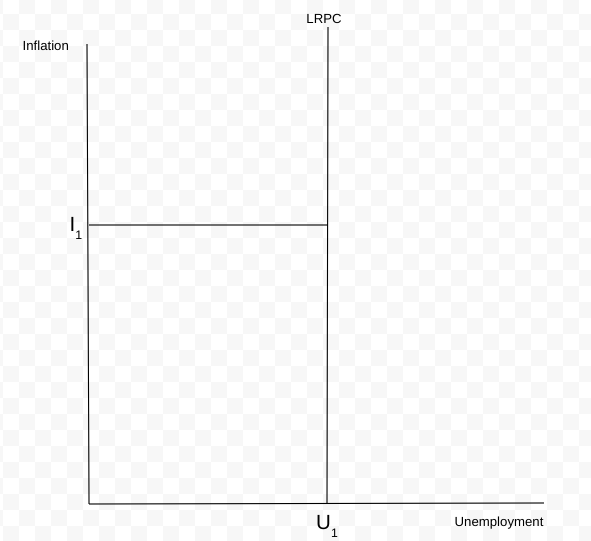
Long run Phillips curve
Demonstrates that inflation and unemployment do not have a tradeoff. Set at the natural rate of unemployment.
Phillips Curve + AD
When AD shifts it results in a change on the SRPC.
As AD increases, it causes inflation to increase and unemployment to decrease, and vice versa.
Phillips Curve + AS
When AS shifts it results in changes the whole SRPC.
As AS increases, inflation and unemployment decrease and vice versa.
Velocity of money
The average number of times one dollar is spent again in one year.
Quantity Theory of Money
Money supply x velocity = Price level x quantity of output (also real GDP). Should equal to nominal GDP.
In the long-run, when banks increase the money supply:
It leads to more spending, higher resource prices, and inflation. It can result in less loans and result in the economy tanking.
Why expansionary monetary policy is still good
It helps with real output in the short run.
Money market
Reflects short-term.
Loanable Funds market
Reflects long-term.
Fisher effect
An increase in expected inflation causes nominal interest rates to increase.
Natural Rate of Interest
The interest rate where prices are stable.
Deficit spending
The amount of money that exceeds government revenues.
Budget deficit
Government spending/transfer payments > Revenues
Budget surplus
Government spending/transfer payments < Revenues
National debt
The total in budget deficits accumulated over time.
Entitlements
The government’s mandatory spending to those who are eligible for these payments. (e.g, Medicaid)
John Maynard Keynes
An economist who believed that government should actively stimulate the economy, especially in a recession. More liberal.
In a recession:
People are more likely to save and decrease their spending.
Broken Window Fallacy
The belief that destruction is good for the economy.
When a boy breaks a shopkeeper’s window, the money spent to repair the window technically goes to the economy, even though the owner had to pay for it. However, it does not necessarily mean destruction is best.
Crowding out
When government borrowing on interest-sensitive spending effectively decreases the amount of private loans and growth
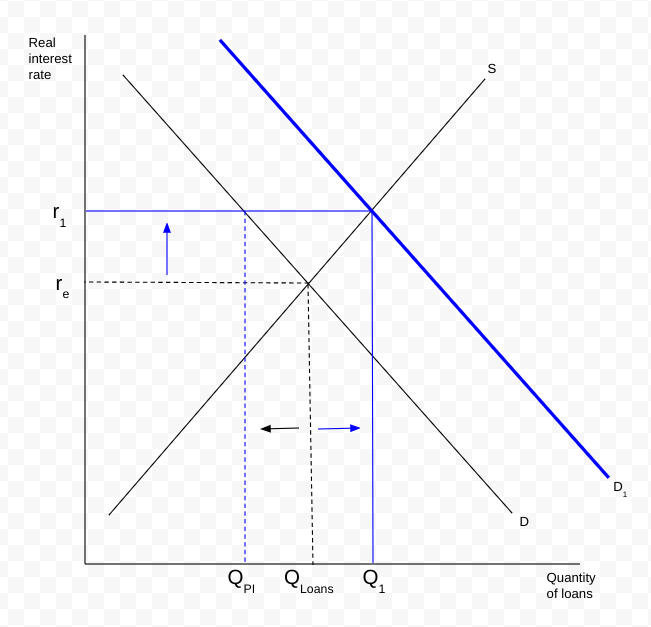
Economic growth in the long run due to crowding out:
Less growth; investment falls.
Real GDP per capita
Real GDP divided by population. The preferred method for measuring growth and standard of living.
Growth rate
The change in rGDP/capita over time.
Productivity
Output per unit of input.
Aggregate Production Function
A graph showing the relationship between real GDP and physical input.
The relationship is direct, but less rGDP is put out as physical input increases.
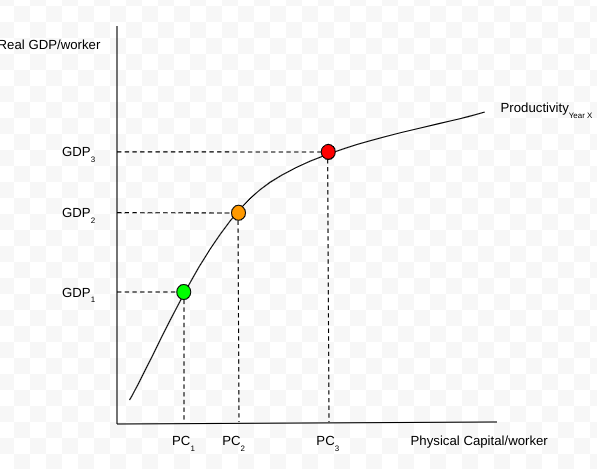
When there is economic growth:
The productivity curve shifts up, and workers make more rGDP for the same amount of input.
Characteristics of countries with high growth rates:
Economic system: Capitalism promotes innovation and increase productivity
Rule of law: Stable politics and peacetime have made for more economic growth.
Capital stock: The more machinery, the more products you can make.
Human capital: Better education and training make workers more effective.
Natural resources: Countries with more resources have generally had more productivity.
Government policies that result in long-run economic growth:
Education + training (human capital)
Infrastructure (physical capital)
Production/investment incentives (physical capital, supply-side economic policies)
Supply-side economics:
Government policies designed to increase production by reducing business taxes and regulations, providing more incentive to work. Considered a “top-down” approach. More conservative.
Why supply-side economics are controversial:
Providing tax breaks could overwhelmingly benefit the wealthy
Held under the assumption that businesses will spend tax cuts on investment, rather than pay their shareholders
No guarantee the “top-down” approach will reach workers