Block Exam #3
0.0(0)
Studied by 2 peopleCard Sorting
1/180
Earn XP
Description and Tags
Last updated 5:37 PM on 4/10/23
Name | Mastery | Learn | Test | Matching | Spaced | Call with Kai |
|---|
No analytics yet
Send a link to your students to track their progress
181 Terms
1
New cards
Cardiovascular System
1. Transportation to all the tissues in the body
1. Bulk transport
1. Nutrients, respiratory gases, wastes, electrocytes
2. Regulation
1. Hormonal, temperature
3. Protection
1. Clotting, healing, immunity
4. Maintain optimal blood pressure and flow
2
New cards
Cardiovascular System Components
1. Blood
1. Fluid medium
1. Cells and plasma
2. Heart
1. 4 chambered pump (pressure)
1. Septum divides left and right halves
3. Blood vessels
1. Delivery system (tubing)
1. Arteries, arterioles, capillaries, venules, veins
2. Pulmonary, systemic circulation
4. Lymphatic system
1. Lymphatic vessels, lymphoid tissues, lymphatic organs

3
New cards
Blood Introduction
1. Average adult volume = 5 liters
2. Arterial blood
1. Leaving the heart
2. Bright red
3. Oxygenated except blood going to lungs
3. Venous blood
1. Entering the heart
2. Dark red
3. Deoxygenated except blood coming from lungs
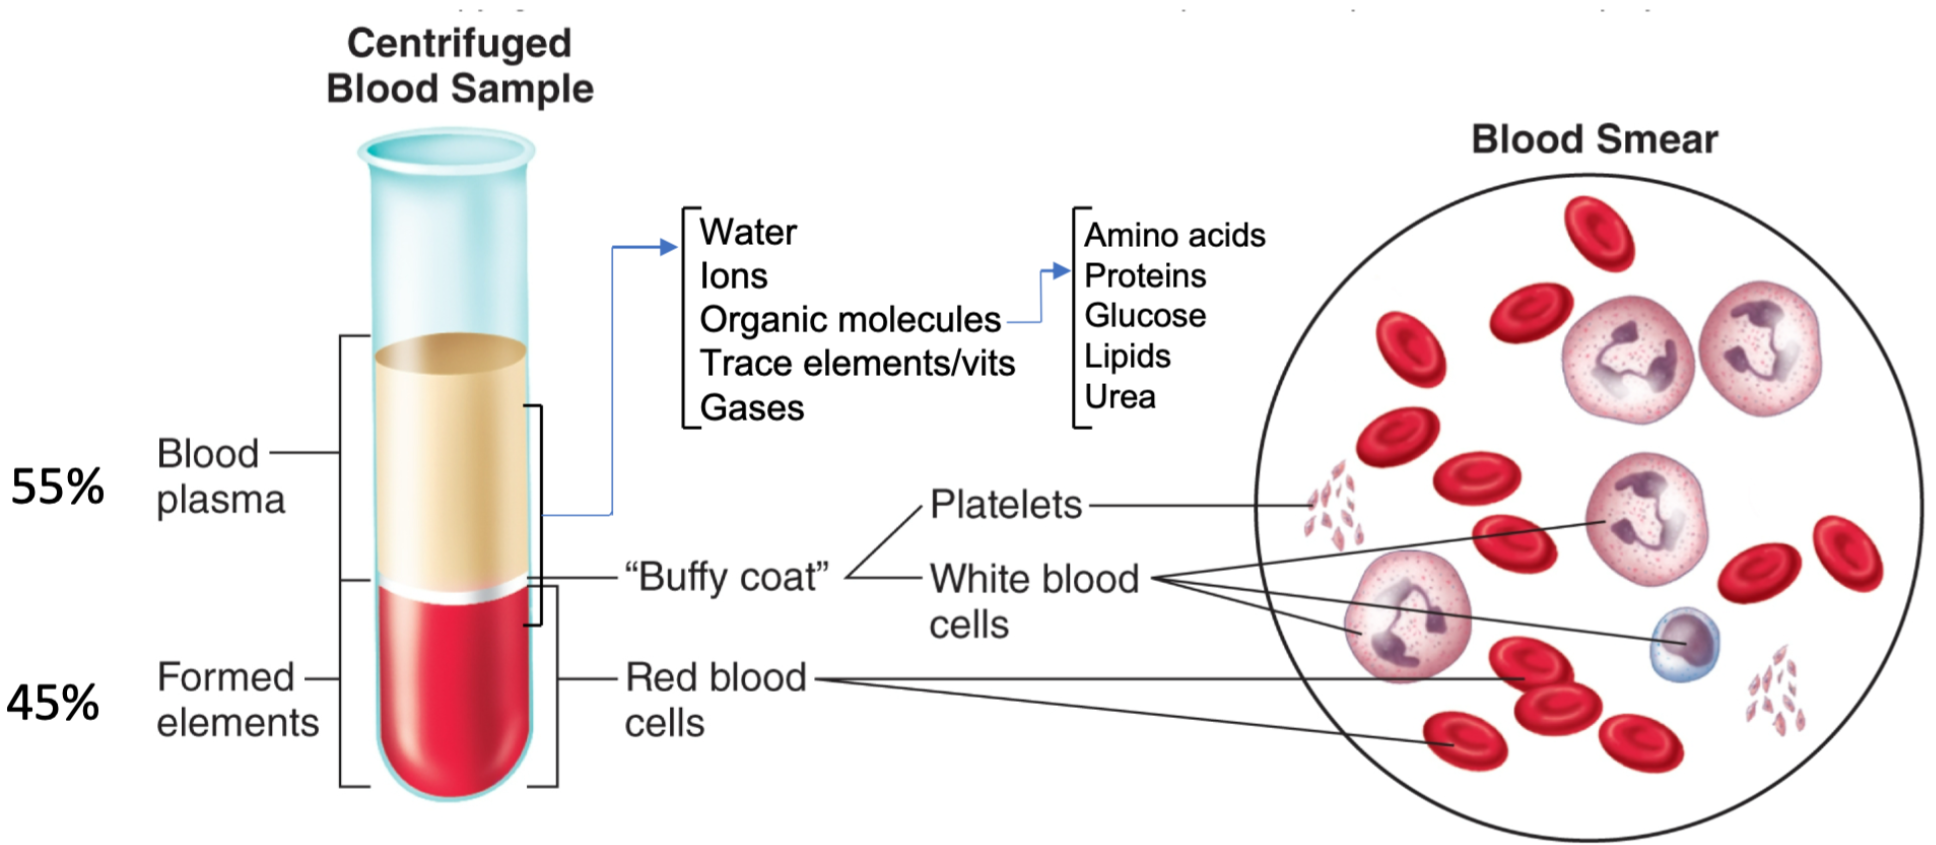
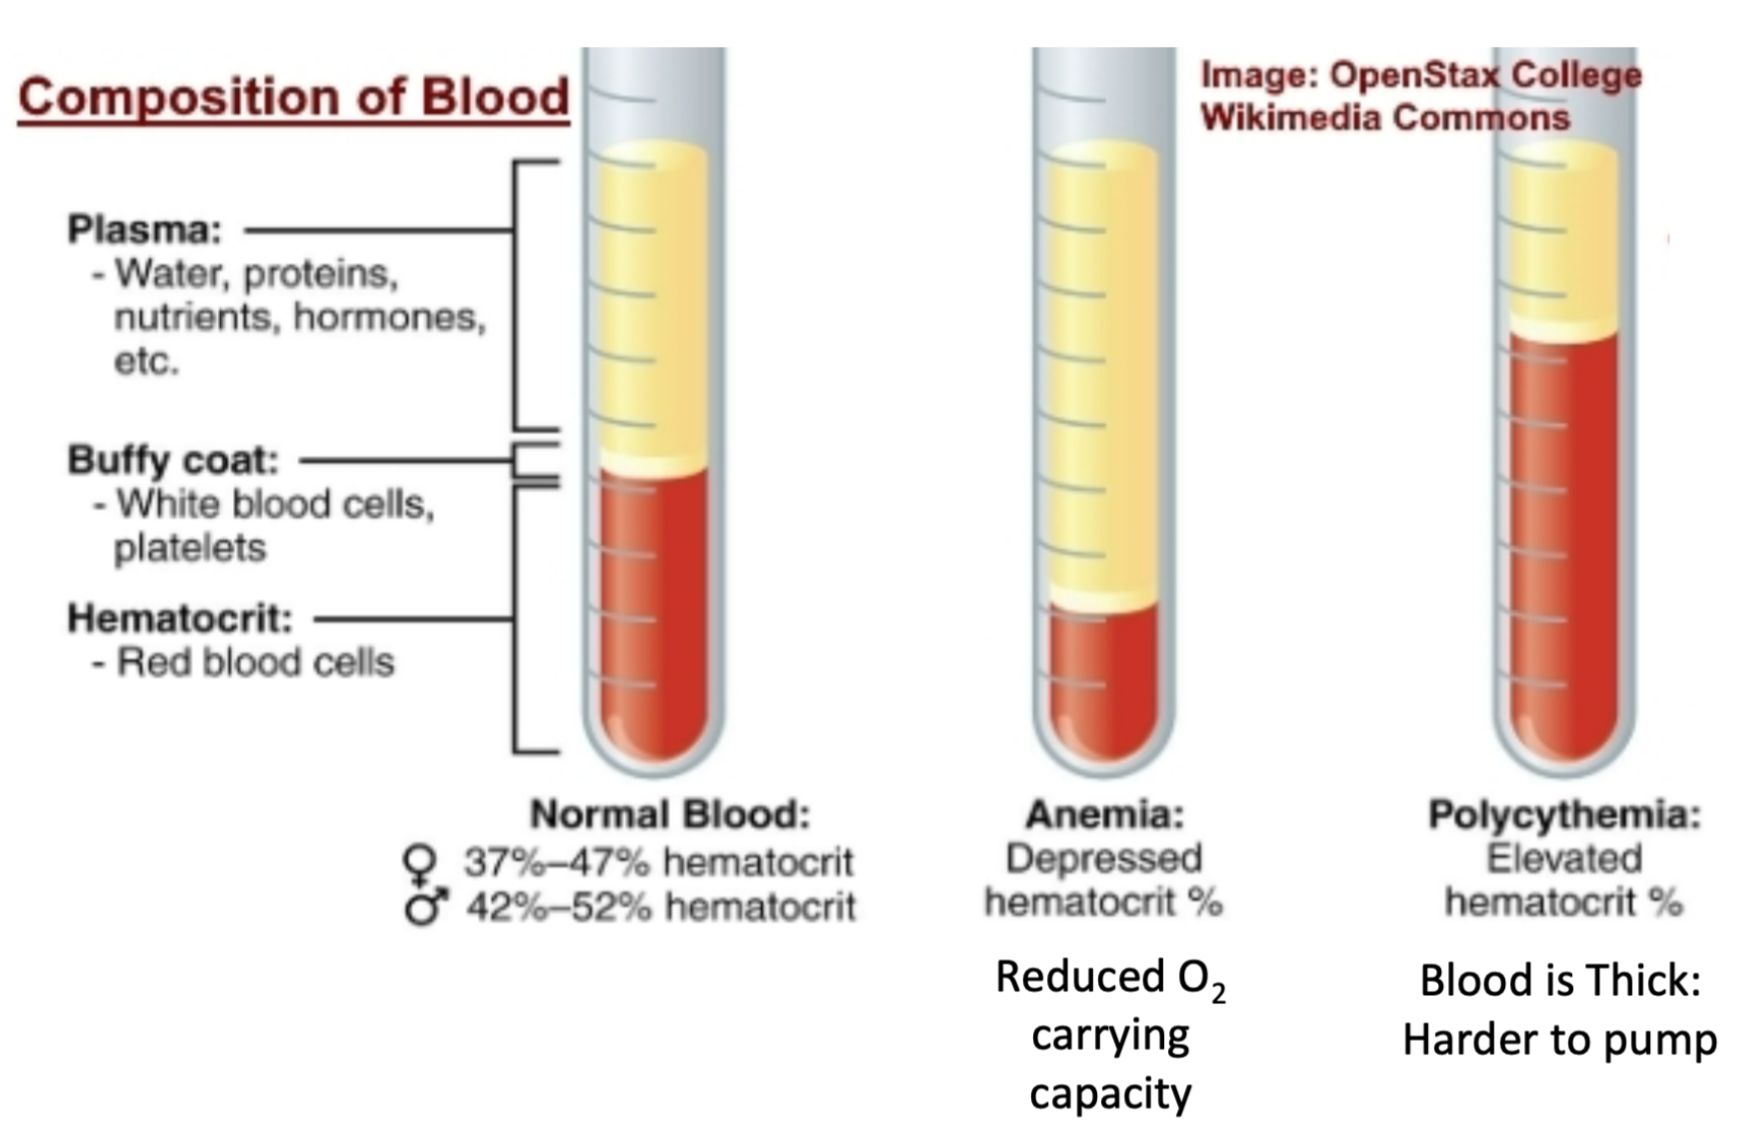
4. 45% formed elements
1. Red blood cells
5. 55% plasma
1. WATER, ions, organic molecules, vitamins, gases (O2/CO2)
4
New cards
Plasma
1. Major blood component
2. Fluid part of blood
1. Water
2. Dissolved solutes
3. Proteins (make up 7-8% of plasma)
5
New cards
Plasma Proteins
1. Makeup 7-8% of plasma
2. Albumin
3. Globulins
4. Fibrinogen
6
New cards
Albumin
1. Plasma protein
2. Creates osmotic pressure
1. Helps draw water from tissues back into capillaries
2. Maintains blood volume and pressure
7
New cards
Globulins
1. Plasma protein
2. **Alpha and beta** globulins
1. Transport lipids and fat-soluble vitamins
3. **Gamma** globulins
1. Antibodies that function in immunity
8
New cards
Fibrinogen
1. Plasma protein
2. Helps clotting after becoming fibrin
3. Serum
1. Blood without fibrinogen
9
New cards
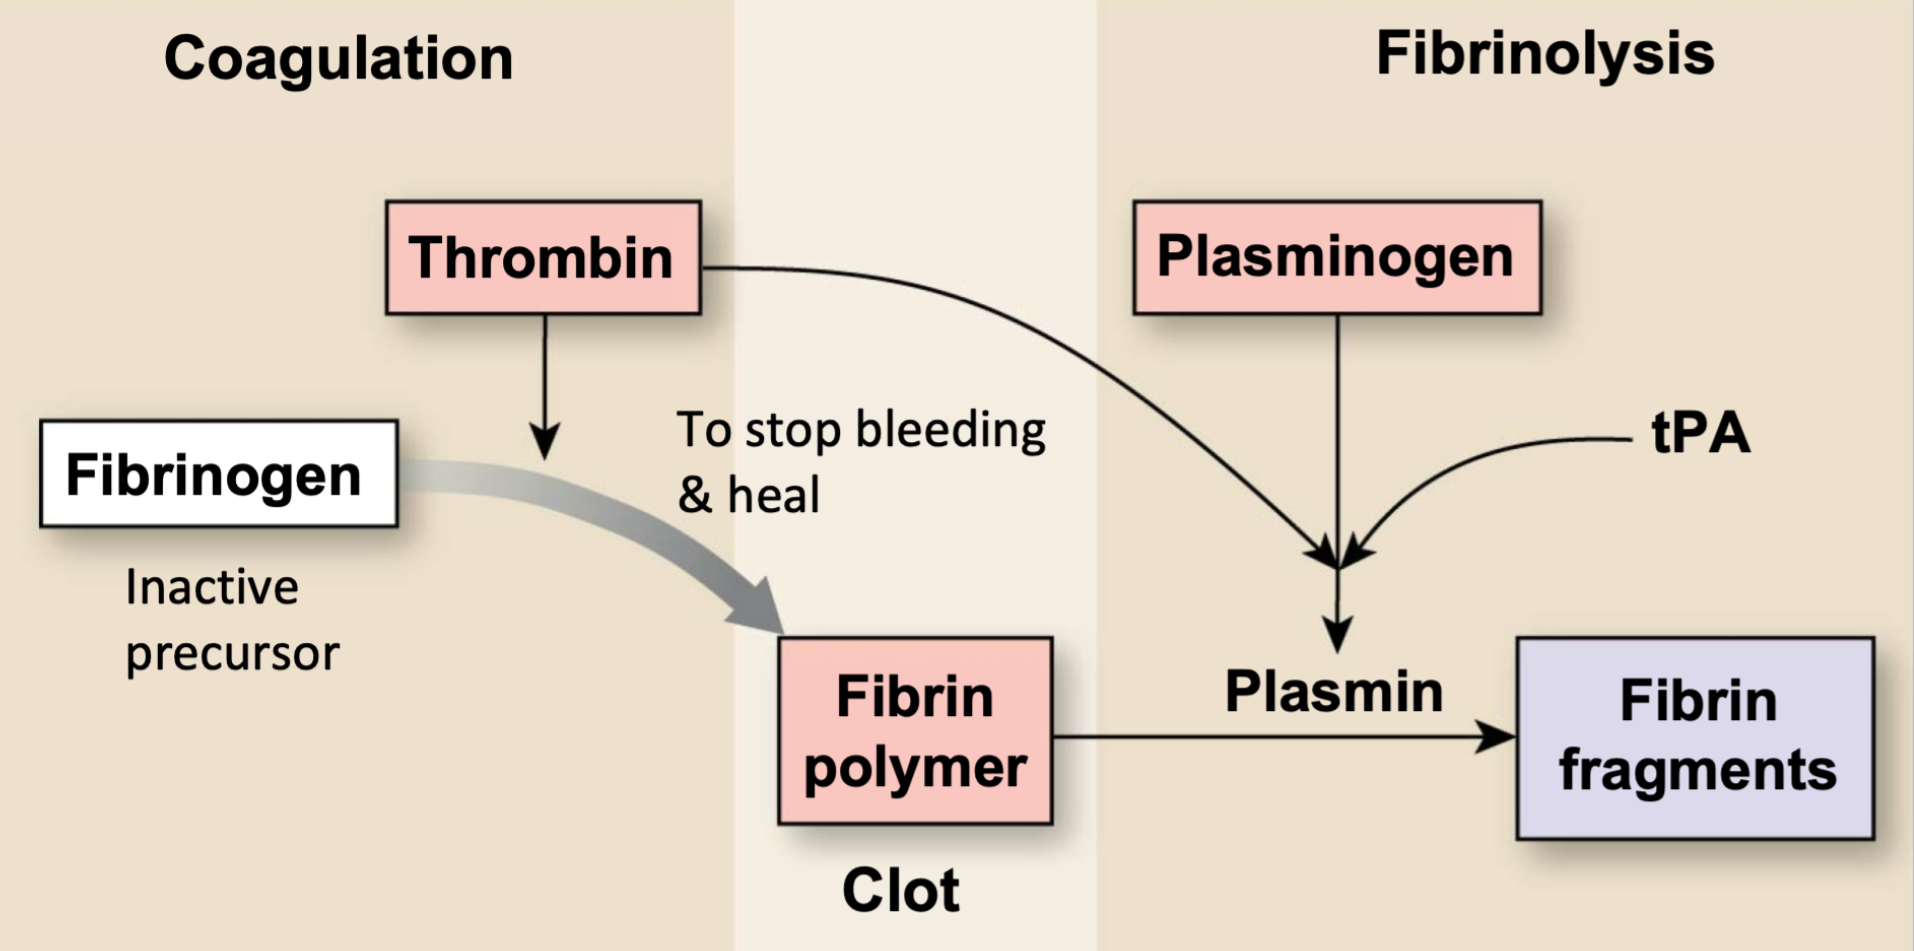
Conversion of Fibrinogen
1. Fibrin rapidly forms a clot after a wound
1. Joins with thrombin
2. Fibrinolysis during healing
10
New cards
Formed Elements in the Blood
Erythrocytes

11
New cards
Erythrocytes
1. Formed elements in blood
1. Make up 45% of blood
2. AKA Red blood cells (RBCs)
3. Flattened, biconcave discs
4. **Carry oxygen**
1. Oxygen transport
5. NO nuclei and mitochondria
6. Approximately 5 million/mm3 blood
7. 120-day life span
8. Each contain about 280 million hemoglobin molecules
9. Anemia
12
New cards
Anemia
1. Abnormally low RBC count/low hemoglobin content within RBC
2. Reduces O2 carrying capacity
13
New cards
Hemoglobin
1. Protein/molecule found in erythrocytes (RBC’s)
2. 280 million hemoglobin found in one RBC
3. Each hemoglobin molecule can carry 4 oxygen
14
New cards
Hematocrit
1. Percentage/volume of total blood that is RBCs
2. Measures oxygen carrying capacity of blood
3. Can tell if someone’s blood is
1. Normal
2. Anemic
3. Polycythemic
15
New cards
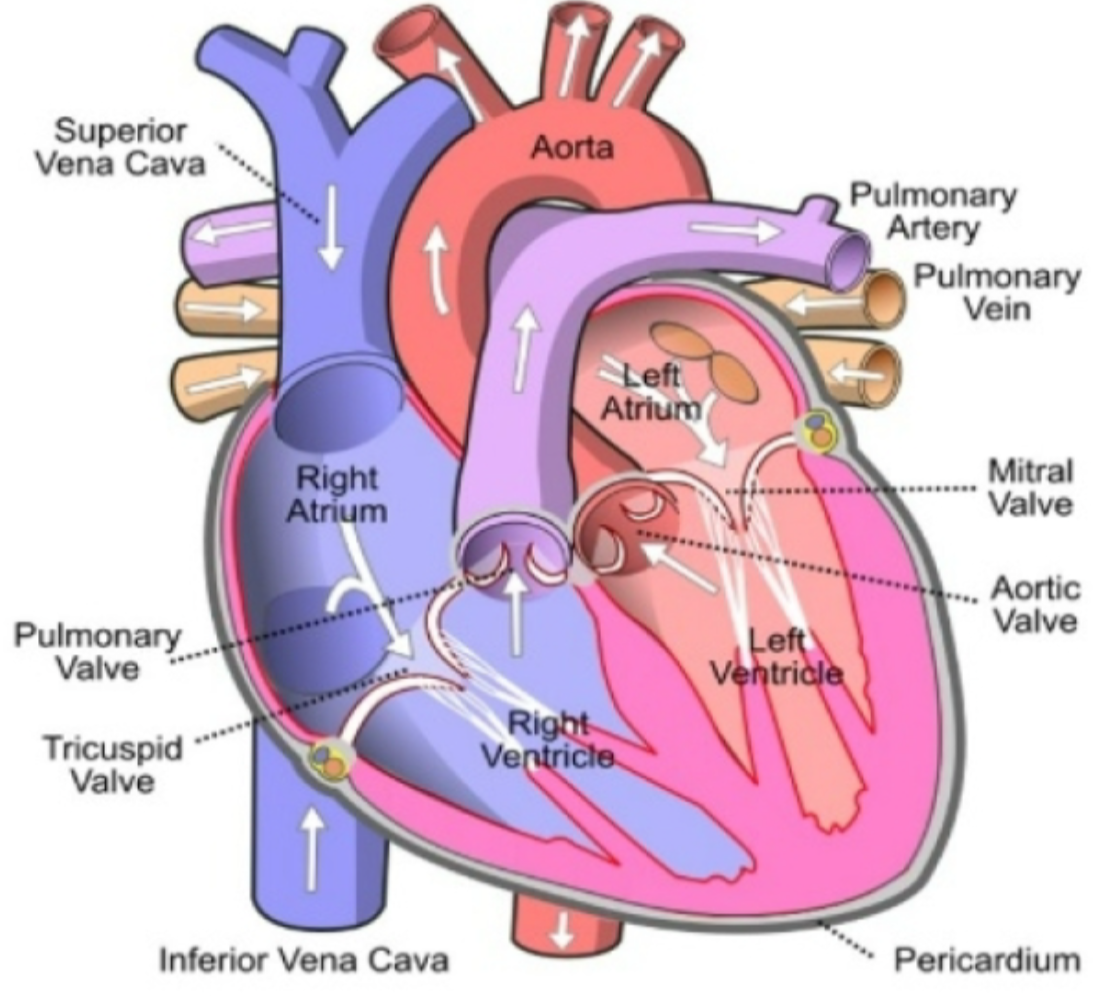
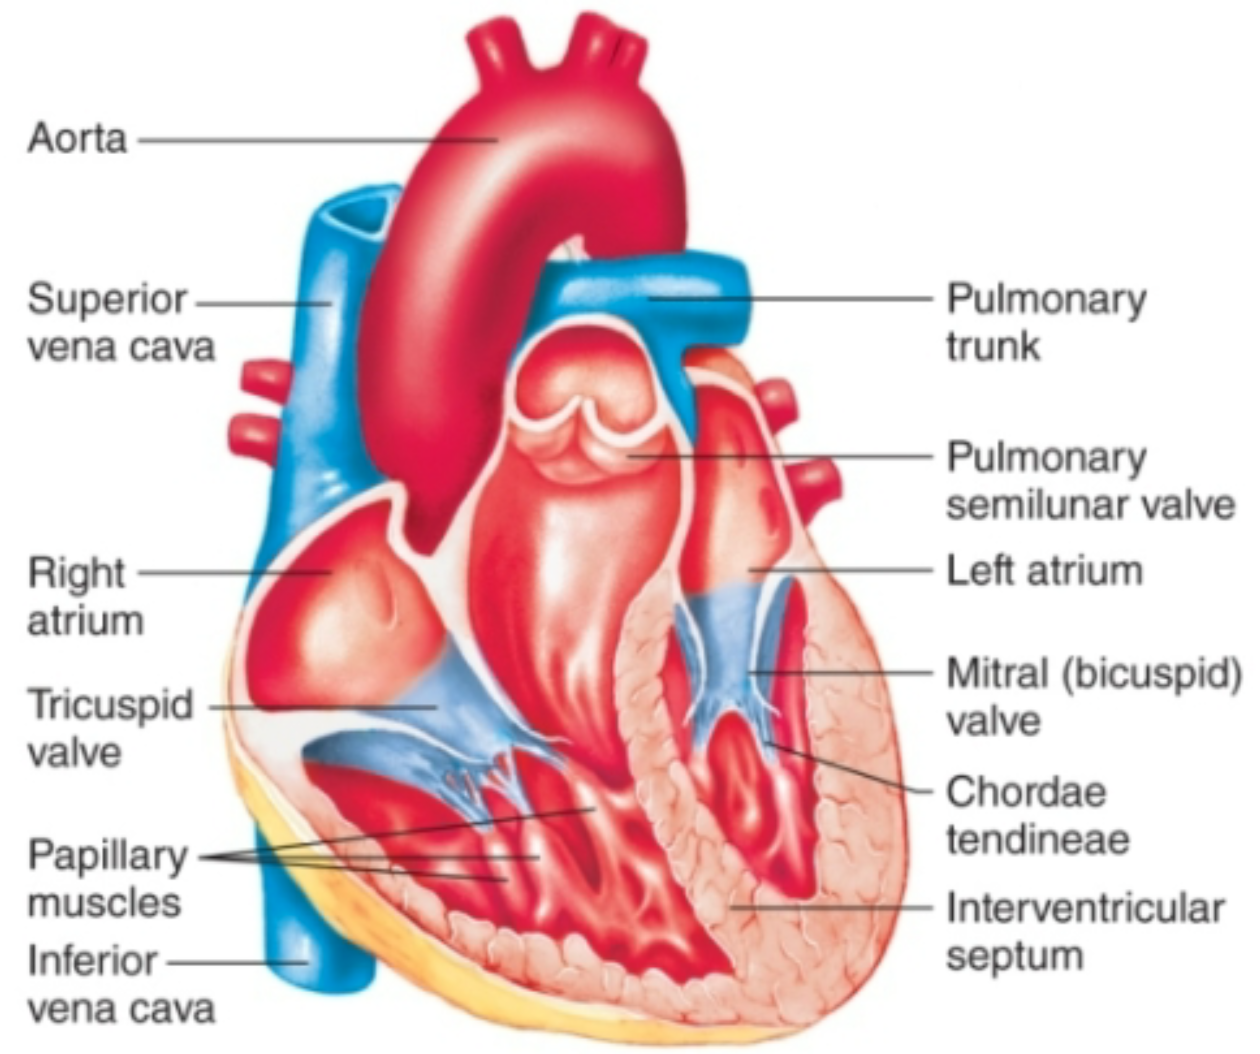
Chambers of Heart
1. Four chambers
1. Right atrium
1. Receives **deoxygenated** blood from body and pumps it to right ventricle via tricuspid valve
2. Right ventricle
1. Receives **deoxygenated** blood from right ventricle and pumps it to lungs via pulmonary valve
3. Left atrium
1. Receives **oxygenated** blood from lungs and pumps it to left ventricle via mitral valve
4. Left ventricle
1. Receives **oxygenated** blood from left atrium and pumps oxygenated blood to body via aortic valve
16
New cards
Fibrous Skeleton of Heart
1. Separates atria from ventricles
1. Atria work as one unit
2. Ventricles work as another unit
2. Forms annuli fibrosi rings
1. Hold in heart valves
17
New cards
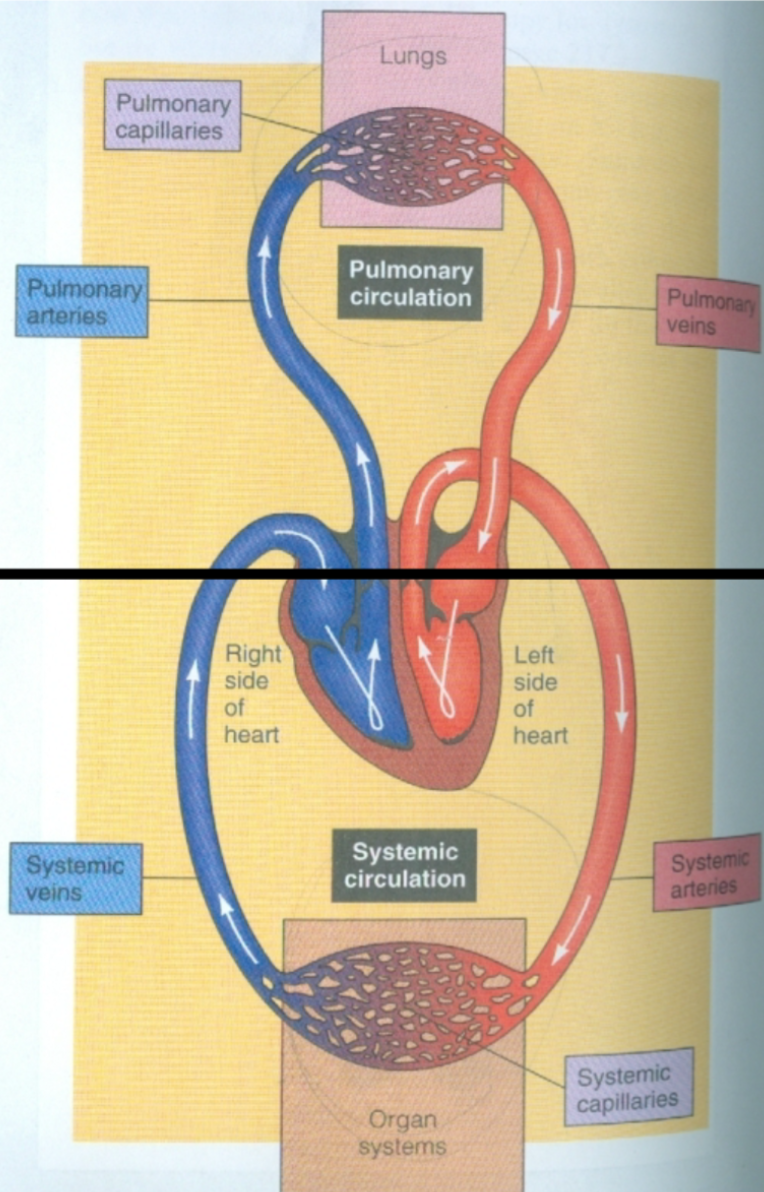
Pulmonary Circulation
1. Between heart and lungs
1. Blood pumps to lungs via pulmonary arteries
2. Blood returns to heart via pulmonary veins
2. Arteries carry low O2 blood to lungs
3. Veins carry high O2 blood to heart
4. Source = right ventricle
5. Termination = left atrium
18
New cards
Systemic Circulation
1. Between heart and body tissues
1. Blood pumps to body tissues via aorta
2. Blood returns to heart via superior and inferior vena cava
2. Arteries carry high O2 blood to tissues
3. Veins carry low O2 blood to heart
4. Source = left ventricle
5. Termination = right atrium

19
New cards
Atrioventricular (AV) Valves
1. Located between atria and ventriclesa.
2. **Tricuspid valve**
1. Between right atrium and right ventricle
3. **Bicuspid/mitral valve**
1. Between left atrium and left ventriclec
4. Papillary muscles and chordae tendineae prevent valves from everting
1. Hold everything in place

20
New cards
Semilunar Valves
1. Located between ventricles and arteries leaving heart
2. **Pulmonary valve**
1. Between right ventricle and pulmonary artery
3. **Aortic valve**
1. Between left ventricle and aorta
4. At exit from ventricles
21
New cards
How do valves in the heart open?
1. Valves open one way only
2. Pressure high on leading side = valve will open
3. Pressure low on leading side = valve will close
4. Valves control blood flow
22
New cards
Heart Sounds
1. Produced by closing valves
2. “Lub”
1. Closing of left and right AV valves
2. Occurs at start of ventricular systole, end of ventricular diastole
3. “Dub”
1. Closing of aortic and pulmonic valves
2. Occurs at end ventricular systole, beginning of ventricular diastole
23
New cards
Cardiac Cycle
1. Contains
1. Systole
2. Diastole
2. Pumping is periodic
1. Cardiac activity characterized by repeated cycles of active contraction followed by resting
3. Heart generates pressure when it contracts, pumping blood out of ventricle and into arteries
4. Ejection of blood during contraction = high pressure
1. Volume high and decreases
5. Filling of blood during relaxation = very low pressure
1. Volume low and increases
24
New cards
Systole
Contraction of heart muscle
25
New cards
Diastole
Relaxation of heart muscle
26
New cards
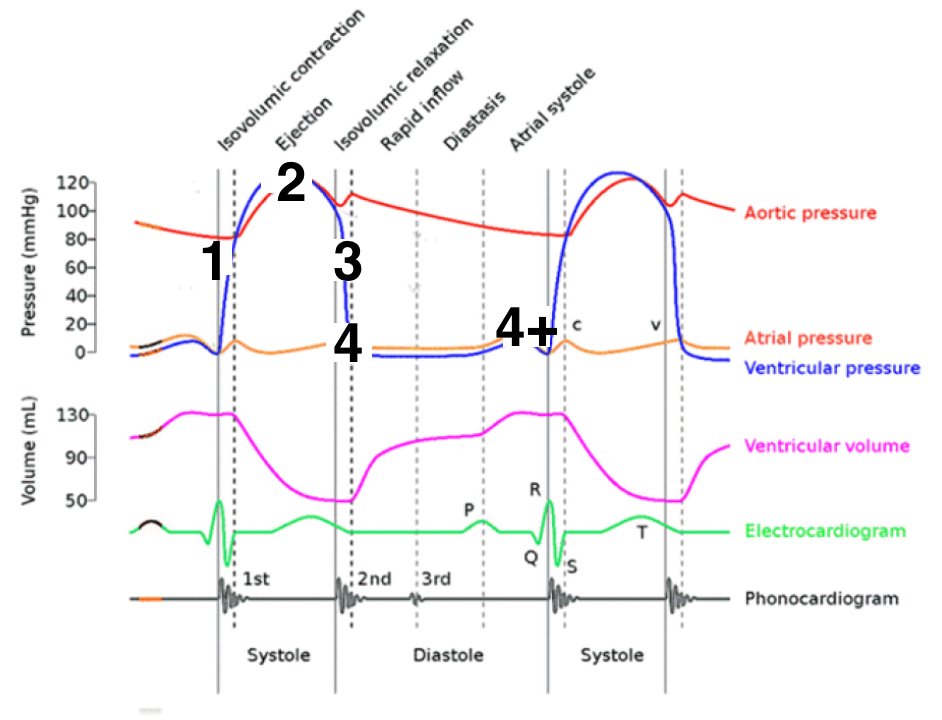
Phases of Cardiac Cycle
1. All blood flow events the heart accomplishes in one complete heartbeat
2. Filling
1. Ventricular/rapid filling
2. Late filling
3. Isovolumetric Contraction
4. Ejection
5. Isovolumetric Relaxation
6. Repeat
27
New cards
Ventricular or Rapid Filling
1. First half of **first phase** of cardiac cycle
2. Ventricles relaxed
1. Ventricle pressure below atria pressure
3. Very low pressure
4. Volume increases
5. Atria relaxed
6. AV valves open
7. (VENTRICULAR) DIASTOLE
28
New cards
Late Filling (Atrial Contraction)
1. Second half of **first phase** of cardiac cycle
1. AKA 4+
2. Atria contract
1. Sends last of blood to ventricles
3. Volume increases
4. Ventricles relaxed
5. (VENTRICULAR) DIASTOLE
29
New cards
Isovolumetric Contraction
1. **Second phase** of cardiac cycle
2. Ventricles start contraction
3. Increasing/developing pressure (pressure rises)
4. Volume stays the same
5. AV valves closed (lub)
1. NO VALVES OPEN
6. Atria relaxed
7. (VENTRICULAR) SYSTOLE
30
New cards
Ejection
1. **Third phase** of cardiac cycle
2. Pressure increases = high pressure
3. Volume decreases
4. Ventricles contract
5. Aortic and pulmonary valves open
6. Blood is ejected out of ventricles and into arteries
7. Atria relaxed
8. (VENTRICULAR) SYSTOLE
31
New cards
Isovolumetric Relaxation
1. **Fourth phase** of cardiac cycle
2. Start of relaxation or diastole
3. Ventricles relaxed
1. Pressure falls in ventricles
4. Volume stays the same
5. Atria relaxed
6. Aortic and pulmonary valves close (dub)
1. NO VALVES OPEN
7. (VENTRICULAR) DIASTOLE
32
New cards
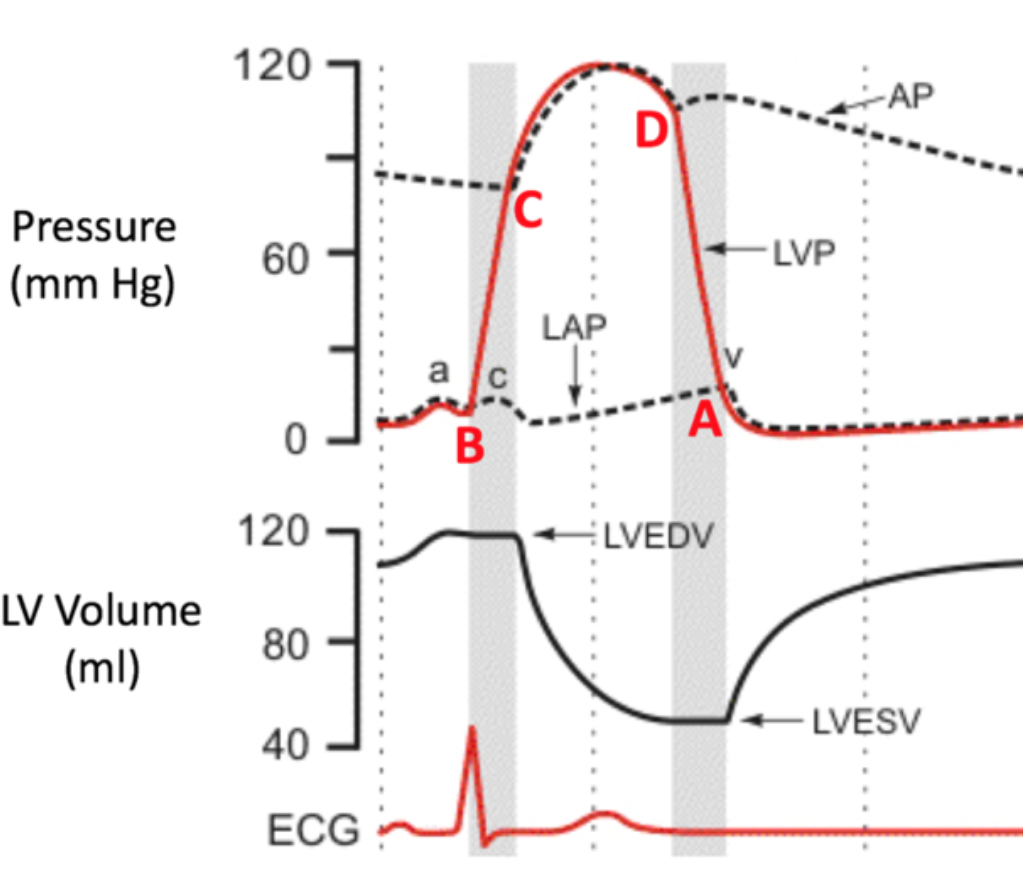
End-Diastolic Volume (EDV)
1. Total volume of blood in ventricles at end of filling
2. DIASTOLE
33
New cards
End-Systolic Volume (ESV)
1. Amount of blood left in left ventricle after ejection
2. SYSTOLE

34
New cards
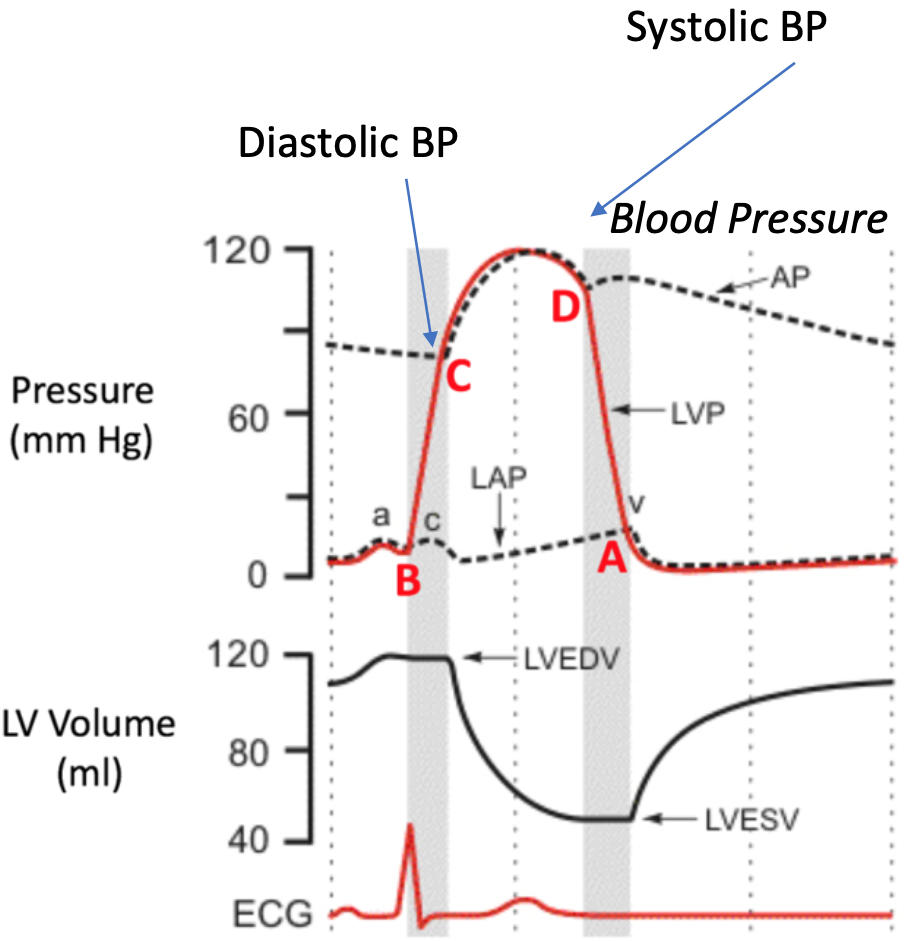
Wigger’s Diagram
1. Shows the four phases on the cardiac cycle
2. Pressure changes
35
New cards
Cardiac Muscle Cells
1. Interconnected by gap junctions at intercalated discs
2. Once AP is initiated, AP flows from cell to cell through gap junctions
3. Cells in atria are connected via gap junctions
1. Contract as unit
4. Cells in ventricles are connected together
1. Contract as unit
5. NO gap junctions between atria and ventricles
6. Fibrous skeleton
1. Separates atria and ventricles
7. The Atria and Ventricles are a functional syncytium
36
New cards
Myocardium
1. Area of the heart that contracts together from one stimulation event
2. AKA functional syncytium
1. Includes ventricles and atria
37
New cards
Contractile Cells
1. Cardiac muscle cell
1. Myocytes
2. Striated myofibers organized into sarcomeres
3. Force production
4. Pressure
38
New cards
Autorhythmic Cells
1. AKA pacemaker cells
2. Cell in heart
3. Initiate Action Potential
4. Smaller and fewer contractile fibers
5. No organized sarcomere
39
New cards
Electrical Conduction
1. Electrical signals in the heart are generated and propagated NOT by nerves
1. Done by autorhythmic pacemaker cells

40
New cards
Automaticity
1. Automatic nature of the heartbeat
2. Ability for cardiac cells to generate spontaneous action potentials
3. Autonomic control of heart rate occurs by changing slope of pacemaker potential
41
New cards
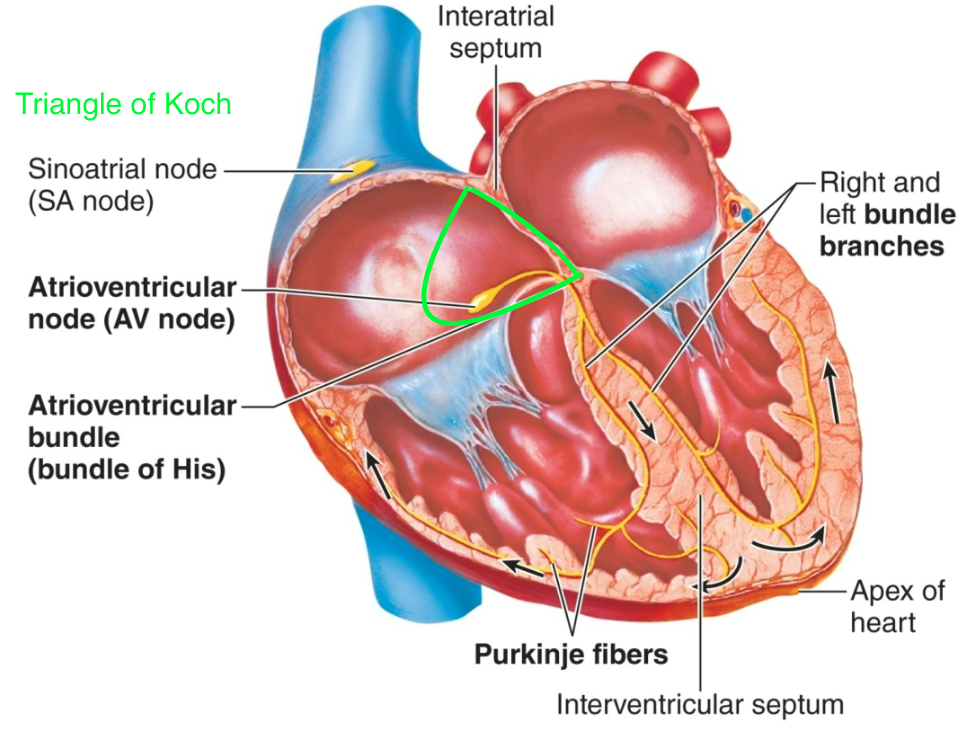
Sinoatrial (SA) Node
1. AKA pacemaker of heart
2. AKA sinus node
3. Located in right atrium

42
New cards
Atrioventricular (AV) Node
1. AKA secondary pacemaker
1. Can take over for SA node if necessary
2. Located in triangle of Koch
3. Slower rate than “sinus rhythm”
43
New cards
Purkinje Fibers
1. AKA secondary pacemaker
1. Can take over for SA node if necessary
2. Located in inner ventricular walls of heart
3. Slower rate than “sinus rhythm”

44
New cards
Bundle of His
1. AKA common bundle
2. AKA atrioventricular bundle
3. Located on wall of right atrium
1. Connects AV node to the purkinje fibers

45
New cards
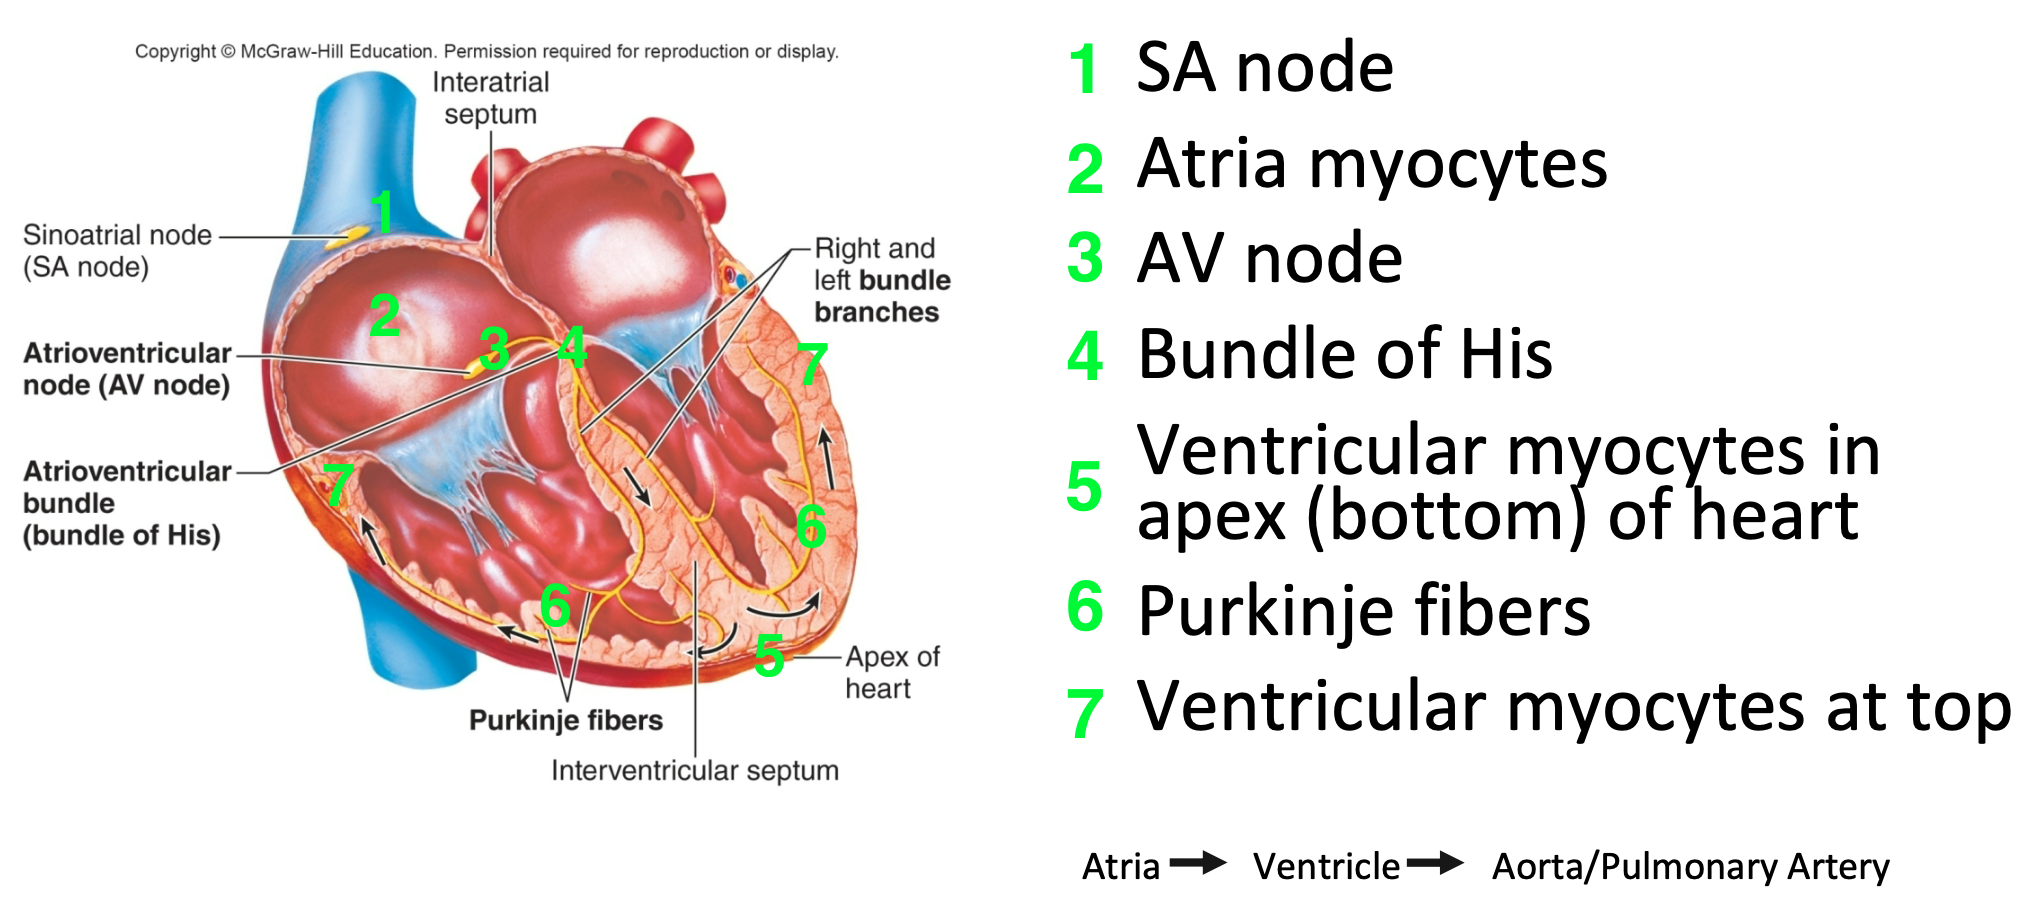
Electrical Conduction in the Heart
1. SA node
2. Atria myocytes
3. AV node
4. Bundle of His
5. Ventricular myocytes in apex (bottom) of heart
6. Purkinje fibers
7. Ventricular myocytes at top
46
New cards
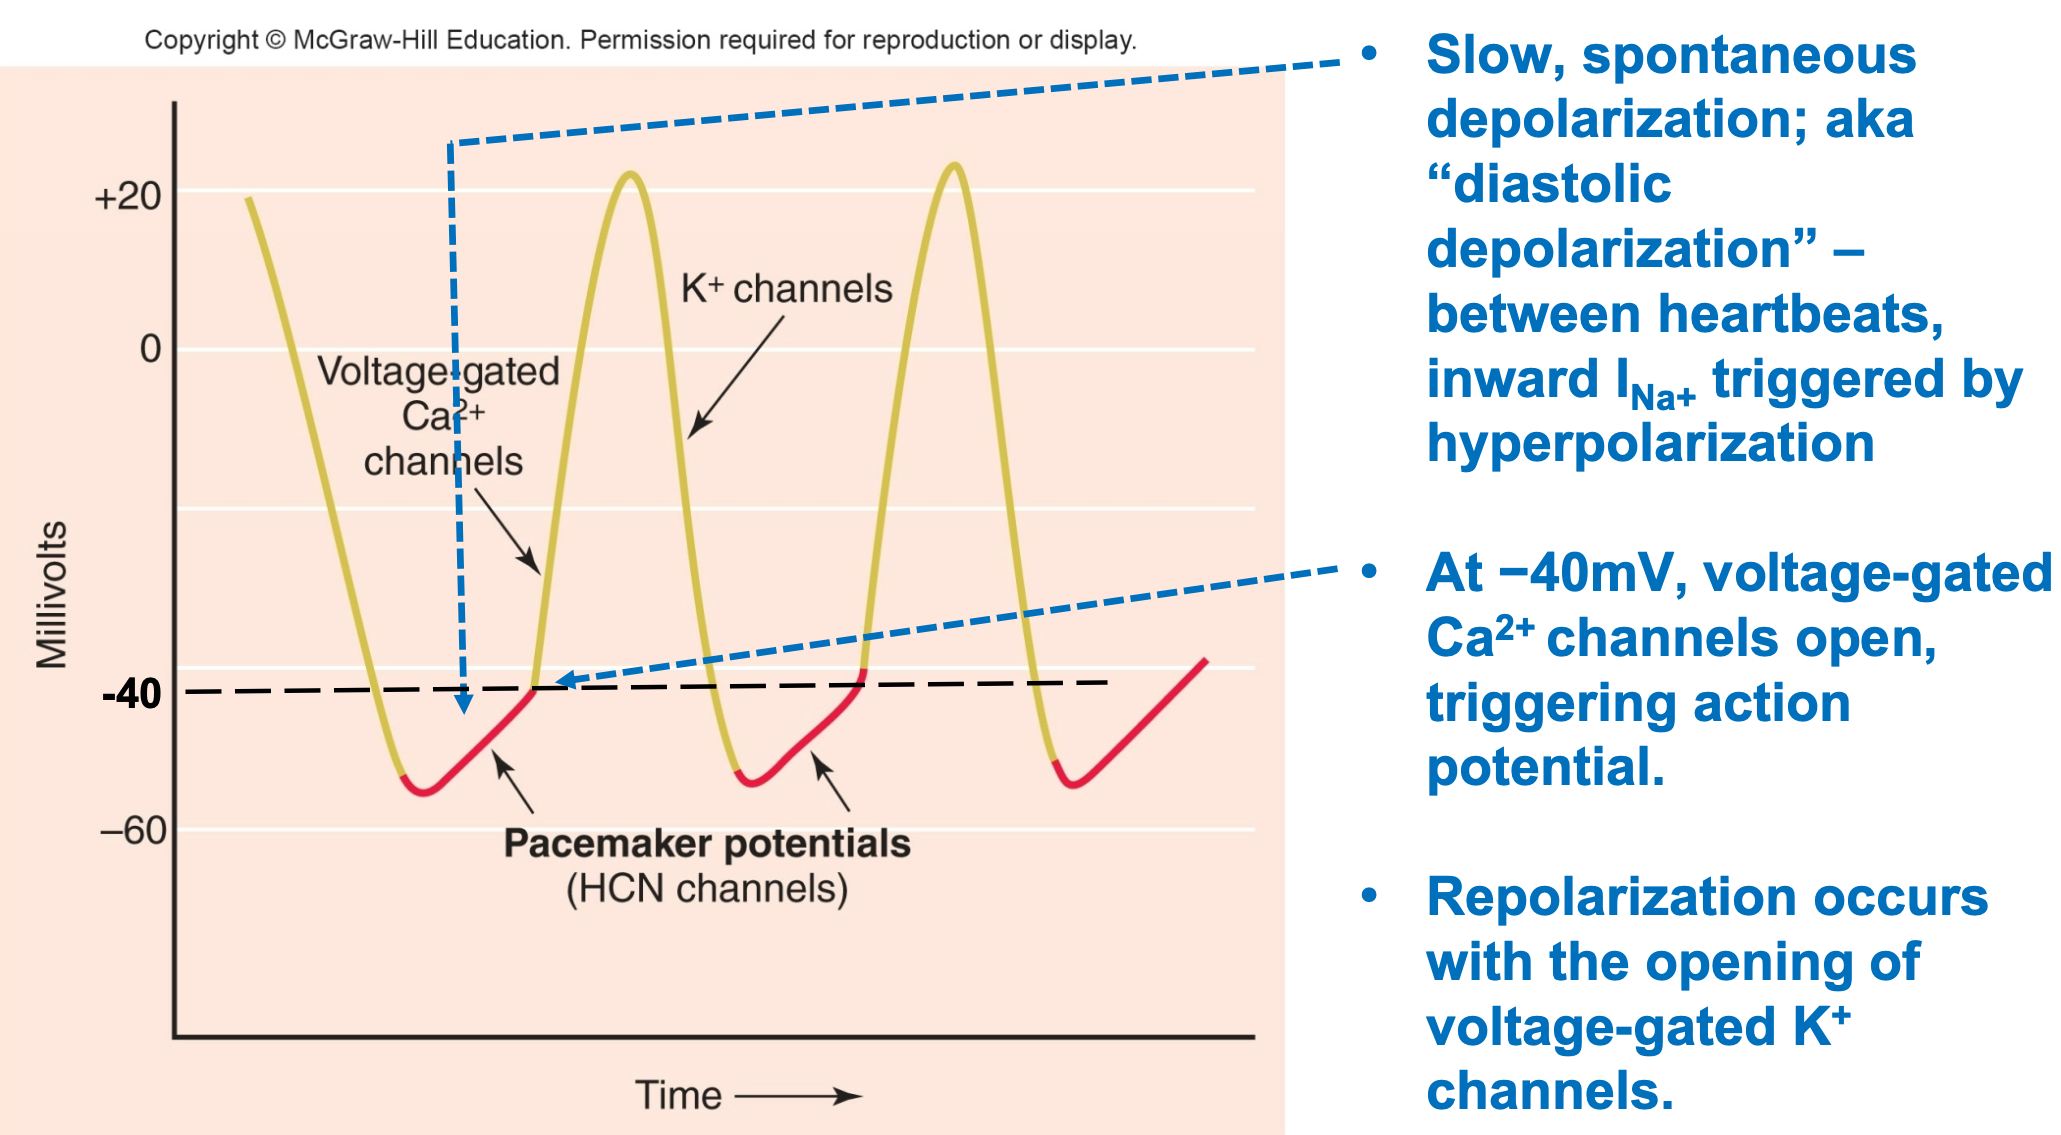
Pacemaker Cells: Action Potential
1. Autorythmic
2. Slow, spontaneous depolarization
1. AKA “diastolic depolarization”
3. Between heartbeats, influx of Na+ triggered by hyperpolarization
4. At −40mV, voltage-gated Ca2+ channels open, triggering action potential
5. Repolarization occurs with opening of voltage-gated K+ channels
1. Efflux of K+
47
New cards
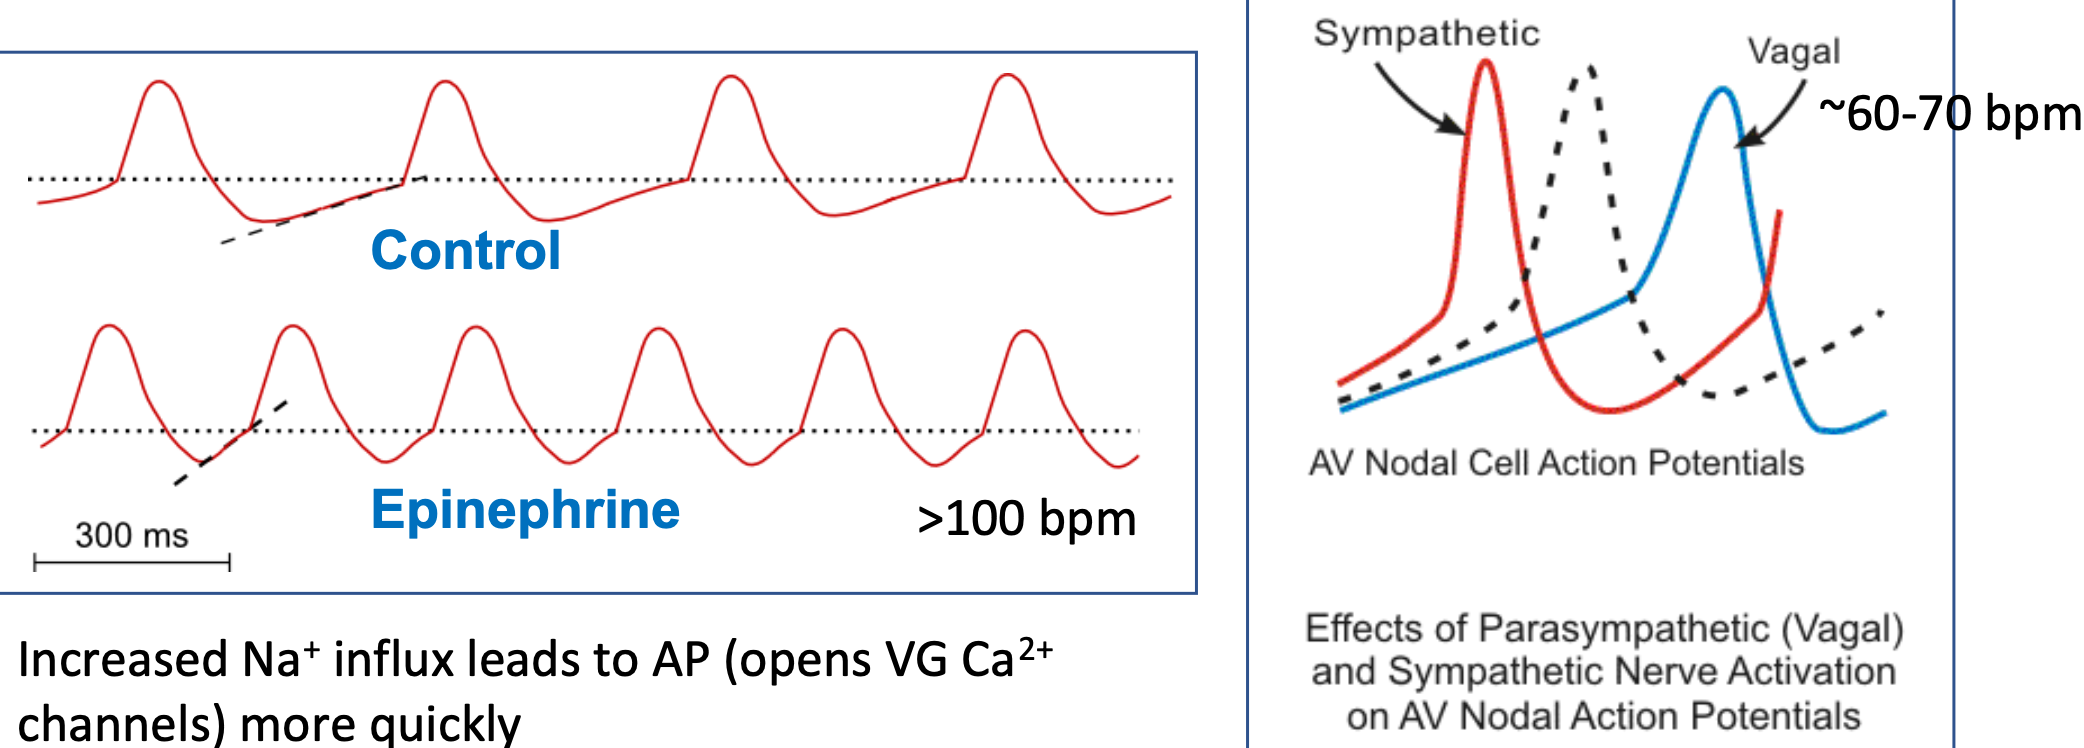
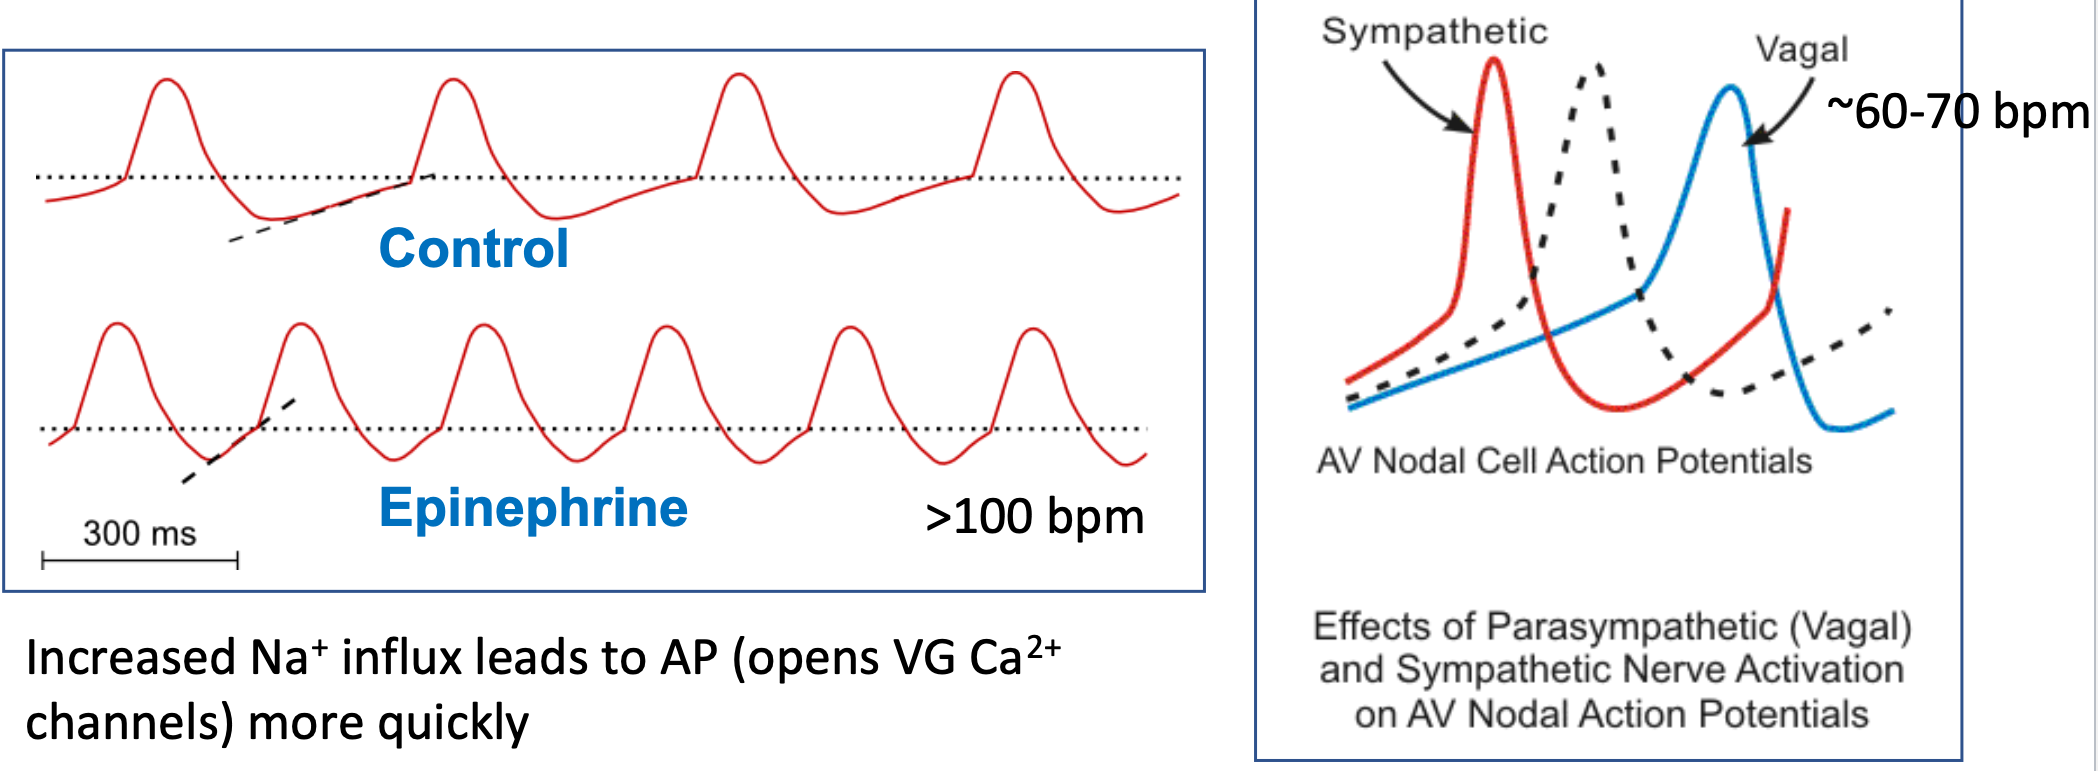
Pacemaker Potential (HR)
1. Pacemaker cells in sinoatrial node depolarize spontaneously
2. Rate can be modulated
1. Sympathetic cells
2. Parasympathetic cells
3. Autonomic control of heart rate occurs by changing slope of pacemaker potential
1. Increased Na+ influx leads to AP
1. Opens VG Ca2+ channels more quickly
2. Vagal nerve stimulation slows SA node pacemaker to “resting heart rate”

48
New cards
Pacemaker Sympathetic Cells
1. Release of epinephrine/norepinephrine
2. Epinephrine/norepinephrine binds to B1 receptors
3. Opens HCN “pacemaker” channels
1. Called HCN channels – hyperpolarization-activated cyclic nucleotide-gated Na+ channels
4. **Influx of Na+** (Sodium in)
5. **Speeds up heart rate** (due to increased Na+ influx)
6. Quicker AP (increased slope of pacemaker potential)

49
New cards
Pacemaker Parasympathetic Cells
1. Neurons secrete acetylcholine
2. Acetylcholine binds M. AchR receptors
3. Opens K+ channels
4. **K+ efflux** (potassium out)
1. K+ efflux works against Na+ influx to slow depolarization to threshold
5. **Slows down heart rate** (due to K+ efflux)
6. Slower AP (decreasing slope of pacemaker potential)
50
New cards
SA Node Pacemaker Potential (HR)
1. Autonomic control of heart rate occurs by changing the slope of the pacemaker potential
2. Increased Na+ influx leads to AP
1. Opens VG Ca2+ channels more quickly
3. Vagal nerve stimulation slows the SA node pacemaker to “resting heart rate”
51
New cards
Heart Rate During Exercise
1. HR increases to help supply working tissues \n (esp. skeletal muscles) with more blood
2. Maximum Heart Rate: About 220-Age
3. Target Heart Rate Zone: 50-80% max heart rate
52
New cards
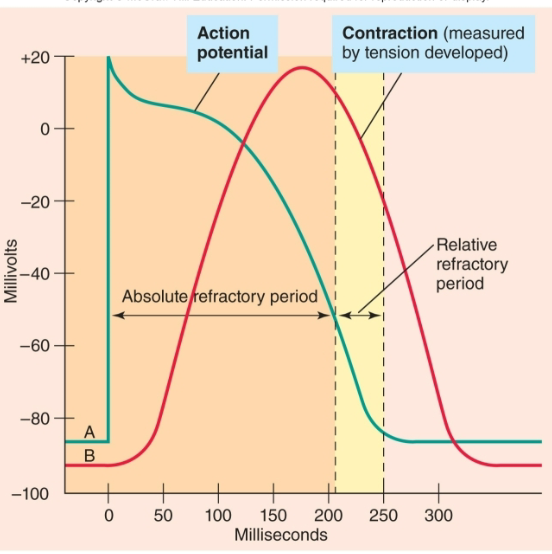
Cardiac Myocyte Action Potential
1. Cardiac muscle cells resting potential = −85mV
2. Depolarized to threshold by AP originating in SA node
3. Voltage-gated Na+ channels open
1. Rapid Na+ in
4. Membrane potential plateaus for 200−300 msec.
1. Due to slow influx of Ca2+
5. Voltage-gated K+ channels open
6. Repolarization occurs
7. Long plateau from V.G. Ca2+ channels
1. Prevents summation and tetanus
2. Get twitch contraction of cardiac muscle cells (rapid cycling of contraction and relaxation)
53
New cards
Conducting Tissues of the Heart
1. AP’s spread at intercalated discs via gap junctions
2. SA node to atrial cells stimulate atrial contraction
3. AV node at base of right atrium and bundle of His conduct stimulation to ventricles
4. In the septum, the bundle of His divides into right and \n left bundle branches
5. Branch bundles become Purkinje fibers, which \n stimulate ventricular cells for ventricular contraction
54
New cards
Conduction of Impulses (Speed)
1. Action potentials from SA node spread rapidly
1. 0.8–1.0 meters/second
2. At AV node, things slow down
1. 0.03−0.05 m/sec
2. This accounts for half of time delay between \n atrial and ventricular contraction
3. Speed picks up in bundle of His
1. 5 m/sec in Purkinje fibers
4. Ventricles contract 0.1–0.2 seconds after atria
55
New cards
Electrocardiogram (ECG or EKG)
1. Noninvasive measurement of flow of cardiac electrical activity passing through heart
2. ECG records electrical activity of heart by picking up movement of ions in body tissues in response to electrical spread
3. Does NOT record action potentials, but does record the wave of depolarization spreading from cell to cell
4. Does NOT record contraction or relaxation, but does record the electrical events leading to contraction and relaxation
56
New cards
How an EKG or ECG Works
1. Inside of cardiomyocytes normally negative relative to outside
2. During excitation, spread of AP’s moves through myocytes (depolarization) from one region to another
3. As electrical excitation passes through heart, that current spread through body fluids--can be measured by electrodes placed on body’s surface
4. General conventions
1. Wave of depolarization or repolarization gives a deflection (change) in signal
2. A baseline signal means electrical signal is not currently changing in the mass of cells (either cells are at RMP or group of cells depolarized)
57
New cards
Basic EKG
1. Complexes and waves: Denote start of depolarization or repolarization in cardiac myocytes of different regions of heart
2. Segments: Denote time intervals during which wave of current move through conduction system and myocardium
3. Low total cell mass of conduction system results in no apparent signal
4. “Flat” line does NOT mean nothing is happening
1. During PR interval, wave of depolarization is propagated through AV node, bundle of His, and Purkinje network
58
New cards
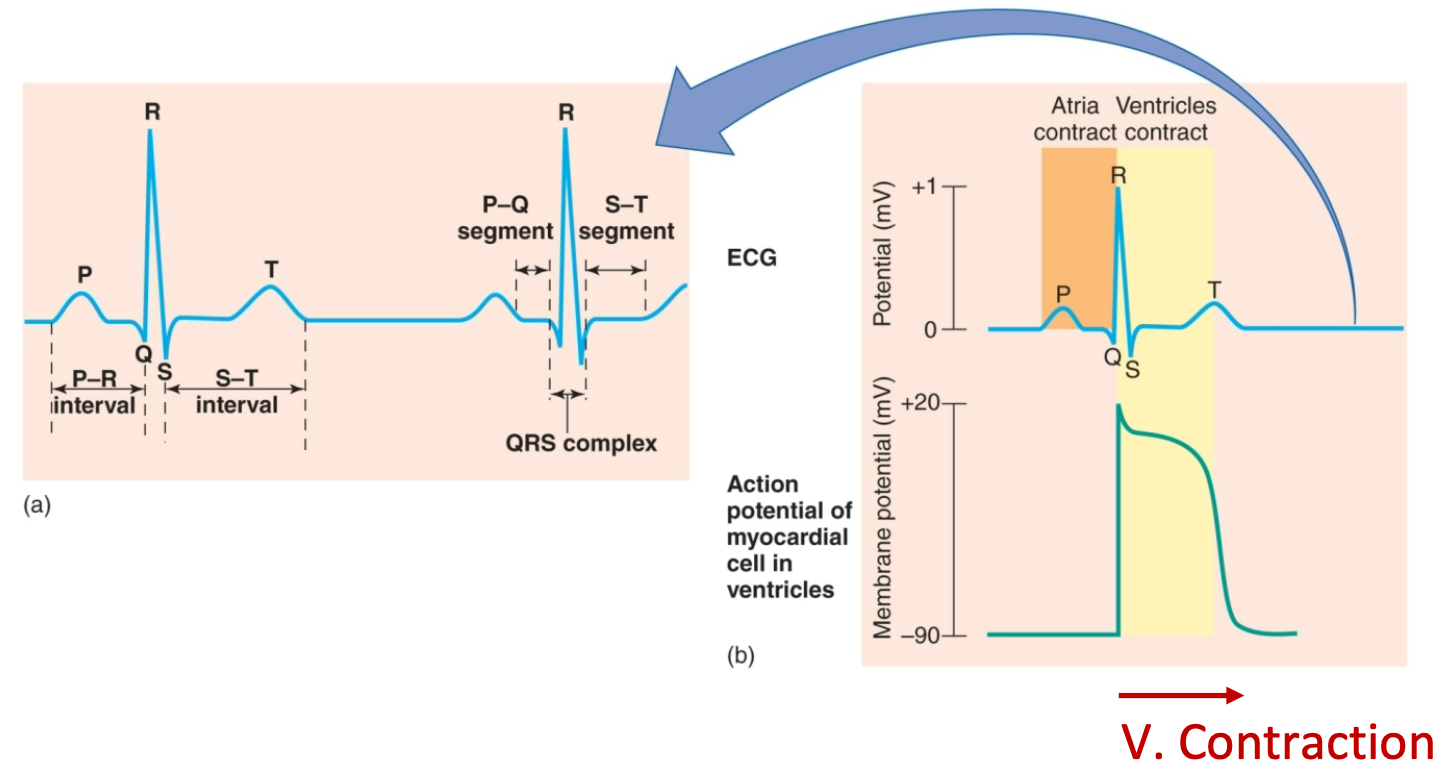
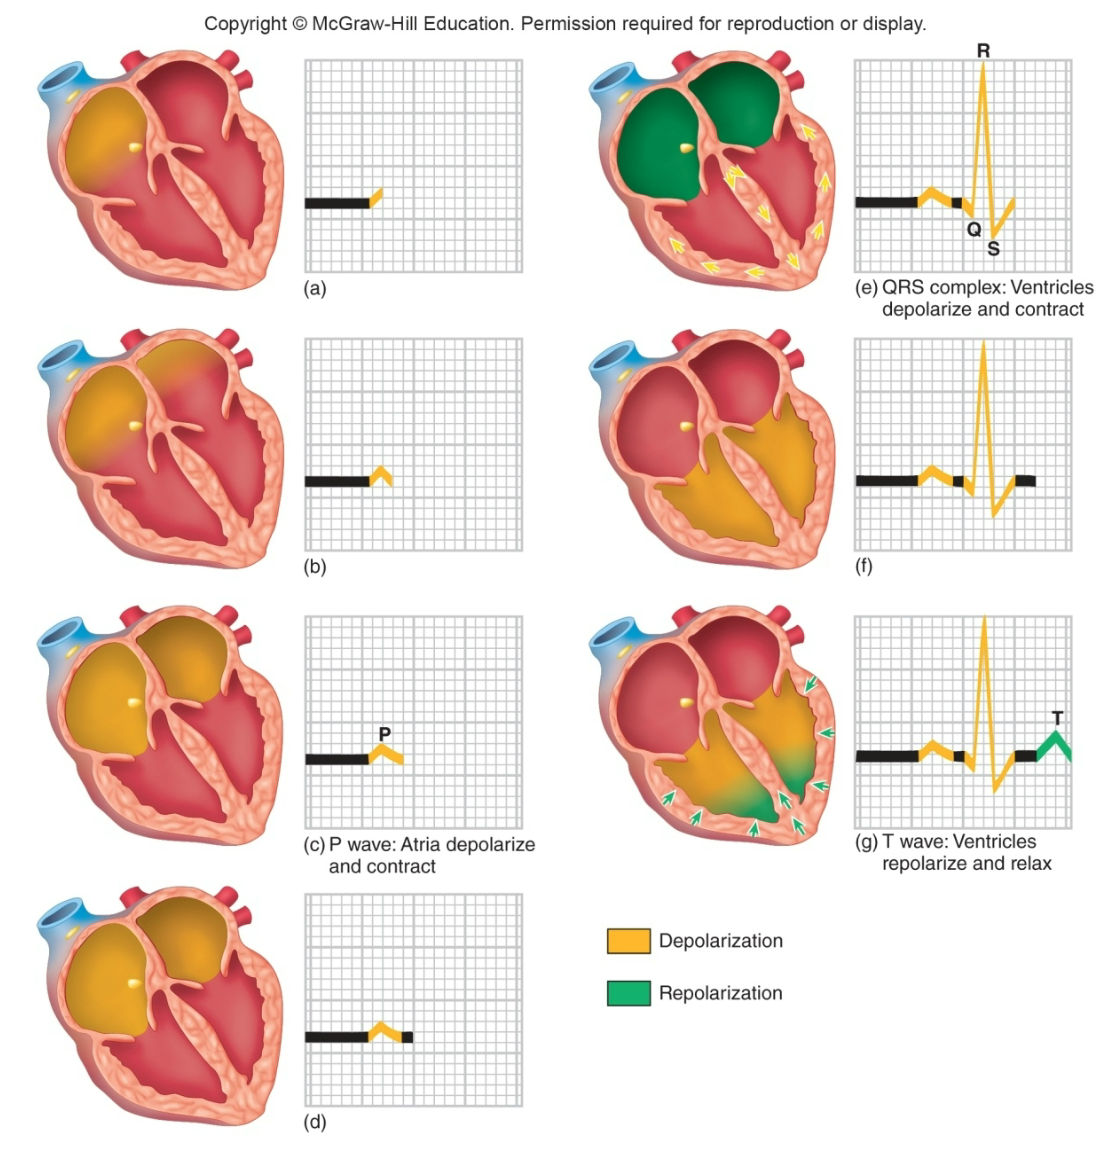
Electrocardiogram Waves, Intervals, and Segments
1. P wave: Atrial depolarization
2. P-Q interval: Atrial contraction
3. QRS wave: Ventricular depolarization (brings about contraction)
4. S-T segment: Plateau phase, ventricular contraction (systole)
5. S-T interval: Ventricular myocytes are depolarized
6. T wave: Ventricular repolarization terminates contraction (contraction/systole/ejection phase ends so relaxation begins)
7. Contraction
59
New cards
Relationship Between Impulse Conduction and ECG
1. P wave
2. T wave
3. QRS complex
60
New cards
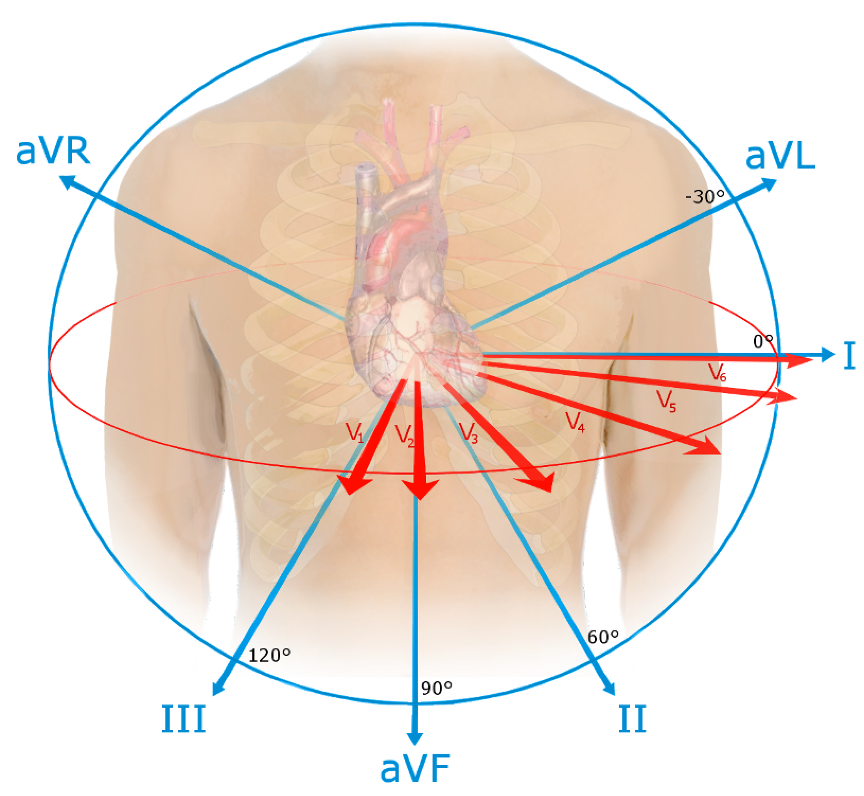
12 Leads on and ECG (EKG)
1. 3-D structure in 2-D
2. ECG is single snapshot of flow of electricity through heart at 12 different angles
1. Laterally, frontally, anteriorly, posteriorly
3. If you only took a single view you might miss something
4. What can be observed from the 12 leads:
1. HR Rhythm or Arrythmia
2. Normal conduction pattern
3. Conduction block due to damaged/abnormally functioning cells
4. Altered orientation of heart
5. Hypertrophy (enlargement (elevated BP?))
6. Atrophy (reduction in size (heart attack?))
5. Leads most parallel to ventricles have biggest QRS
6. Leads most perpendicular to ventricles have smallest QRS
61
New cards
Standard EKG (ECG) Electrode Positions
1. 12 leads
2. 6 limb leads: I, II, II, aVR, aVL, aVF
3. 6 precordial (chest) leads: V1-V6
4. All are recording at same time, just at different angles
62
New cards
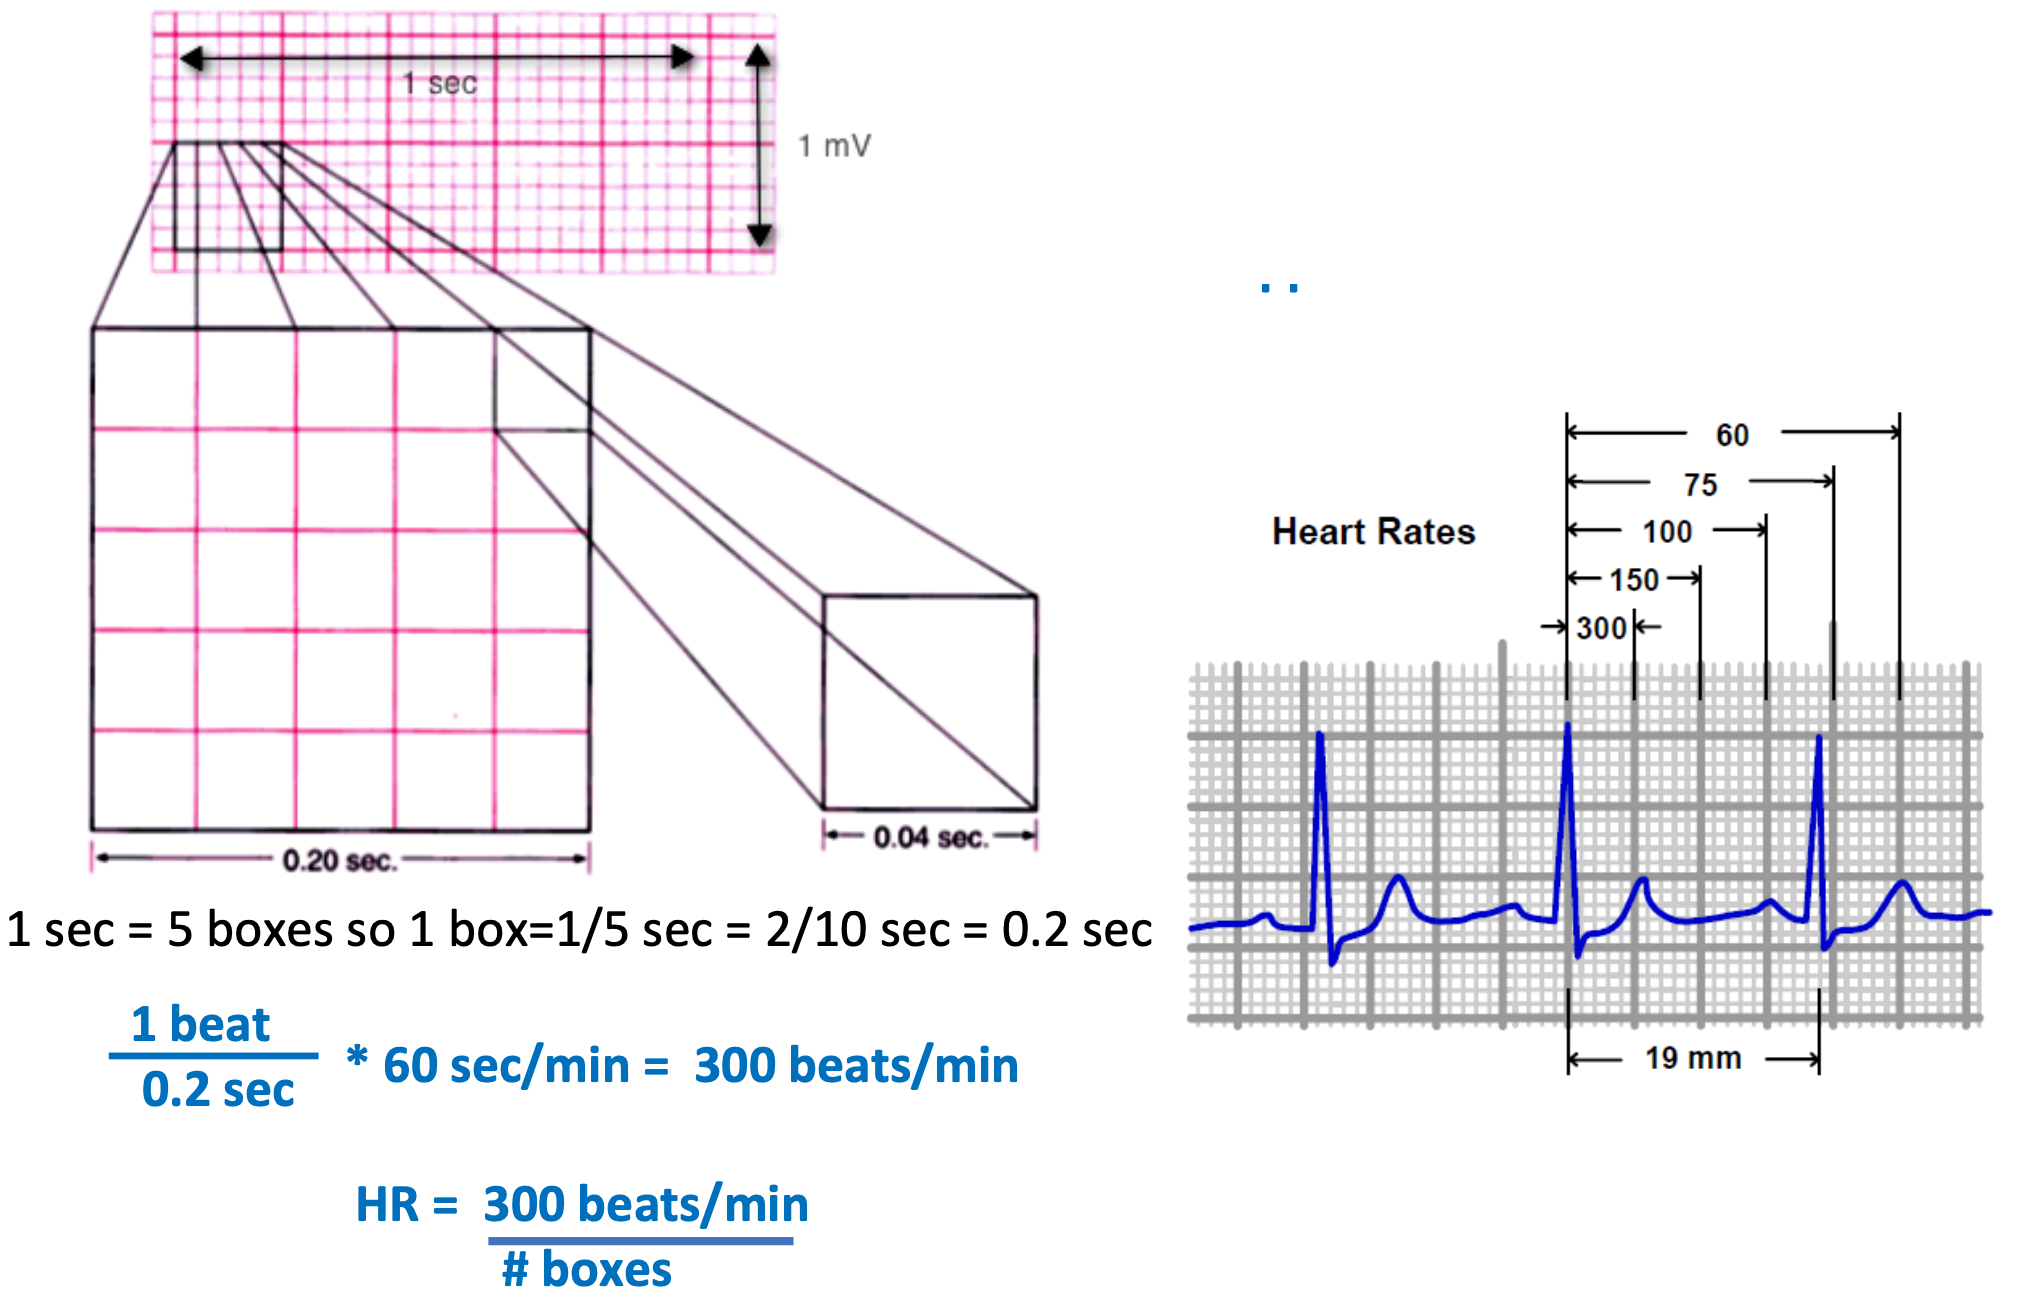
R-R Interval Time: How to Estimate HR from EKG
1. Quick estimation
2. Steps
1. Start with an R wave aligned with line of a large box
2. Assign values of 300, 150, 100 to next 3 \n boxes
3. Assign values of 75, 60, 50 to next 3 boxes after that
4. Assign H.R. based on where next R wave appears
63
New cards
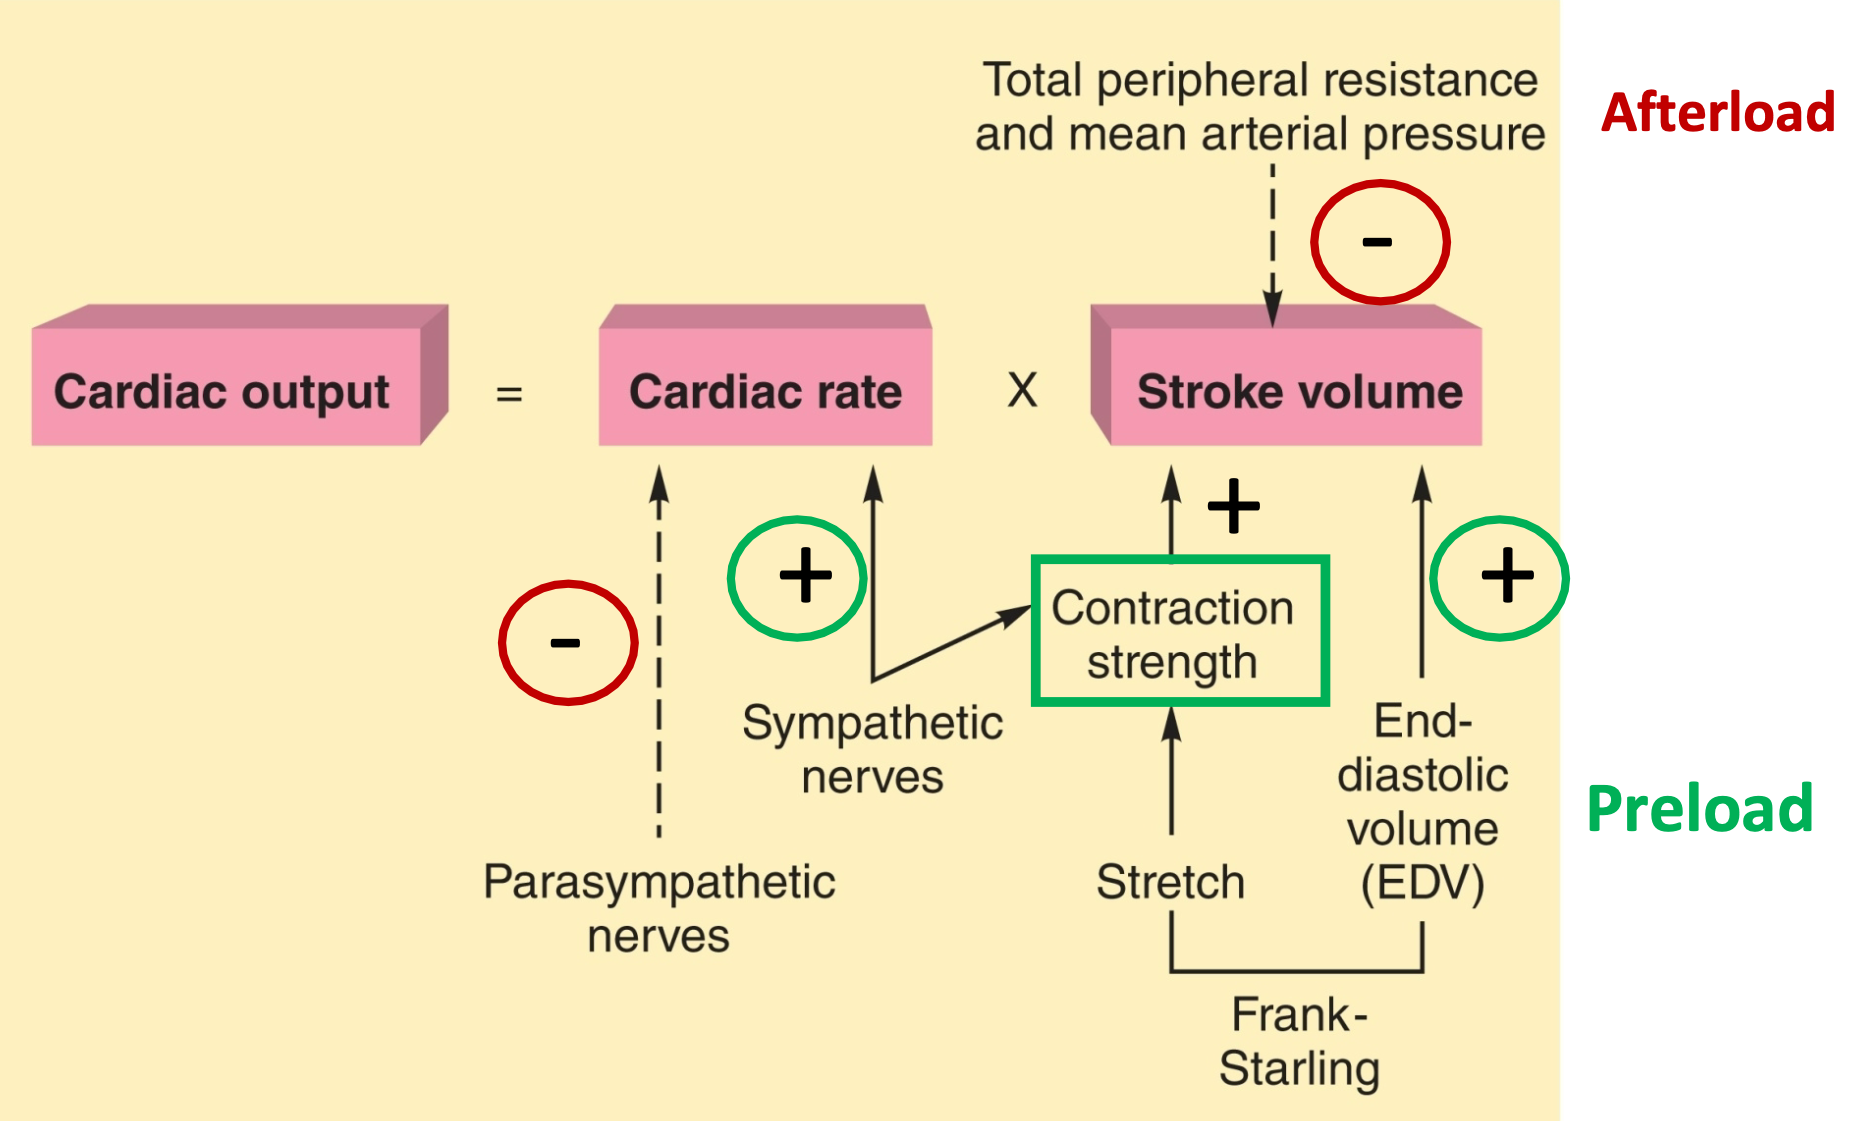
Regulation of Cardiac Output
1. Cardiac output = heart rate \* stroke volume
1. CO = amount of blood ejected per minute
2. SV = amount of blood ejected per beat
2. Heart rate:
1. Intrinsic: autorhythmic (pacemaker) activity
2. Extrinsic: autonomic signals modulate pacemaker rate
3. Stroke volume:
1. Intrinsic: Frank-Starling relationship
2. Extrinsic: autonomic signals
1. Sympathetic NS modulates contraction strength, preload (venous return & filling volume) and afterload (aortic pressure)
4. Tissues care about cardiac output!
64
New cards
Cardiac Output (CO)
1. Volume of blood pumped each minute by each ventricle
1. Equivalent to total blood volume
2. CO (ml/min) = SV (ml/beat) X HR (beats/min)
1. Average cardiac output = 5,500 ml/min
2. Average stroke volume = 70−80 ml/beat
3. Average heart rate = 70 bpm
3. CORV = COLV
1. Lungs get 100% of CO from RV
2. Other organs share CO from LV
4. Pulmonary circulation has high flow and low pressure
5. Systemic circulation has shared flow and higher pressure
6. Mean Arterial Pressure pulmonary = 10-20 mm Hg
7. Mean Arterial Pressure systemic = 70-105 mm Hg
65
New cards
Regulation of Cardiac Rate (HR)
1. Spontaneous depolarization occurs at SA node when HCN channels open allowing Na+ in
1. Open due to hyperpolarization at end of preceding action potential
2. Sympathetic NE/Epi open more HCN channels, increasing heart rate
3. Parasympathetic acetylcholine opens K+ channels, slowing heart rate
4. Controlled by cardiac center of medulla oblongata that is affected by higher brain centers
66
New cards
Excitation-Contraction Coupling
1. Electrical activity regulates contractile activity
2. Steps
1. Current spreads through gap junctions to contractile cell
2. Action potentials travel along plasma membrane and T tubules
3. Ca2+ channels open in plasma membrane and SR
4. Ca2+ induces Ca2+ release from SR
5. Ca2+ binds to troponin, exposing myosin binding sites
6. Crossbridge cycle begins
7. Muscle fiber contracts
8. Ca2+ is actively transported back into the SR and ECF
9. Tropomyosin blocks myosin-binding sites
10. Muscle fiber relaxes
67
New cards
CO: Regulation of Stroke Volume
1. Regulated by three variables:
1. PRELOAD: End diastolic volume
1. (EDV): volume of blood in ventricles at end of diastole (filling)
1. More filling = more stretch of ventricle
2. Stroke volume increases with increased EDV (Frank-Starling)
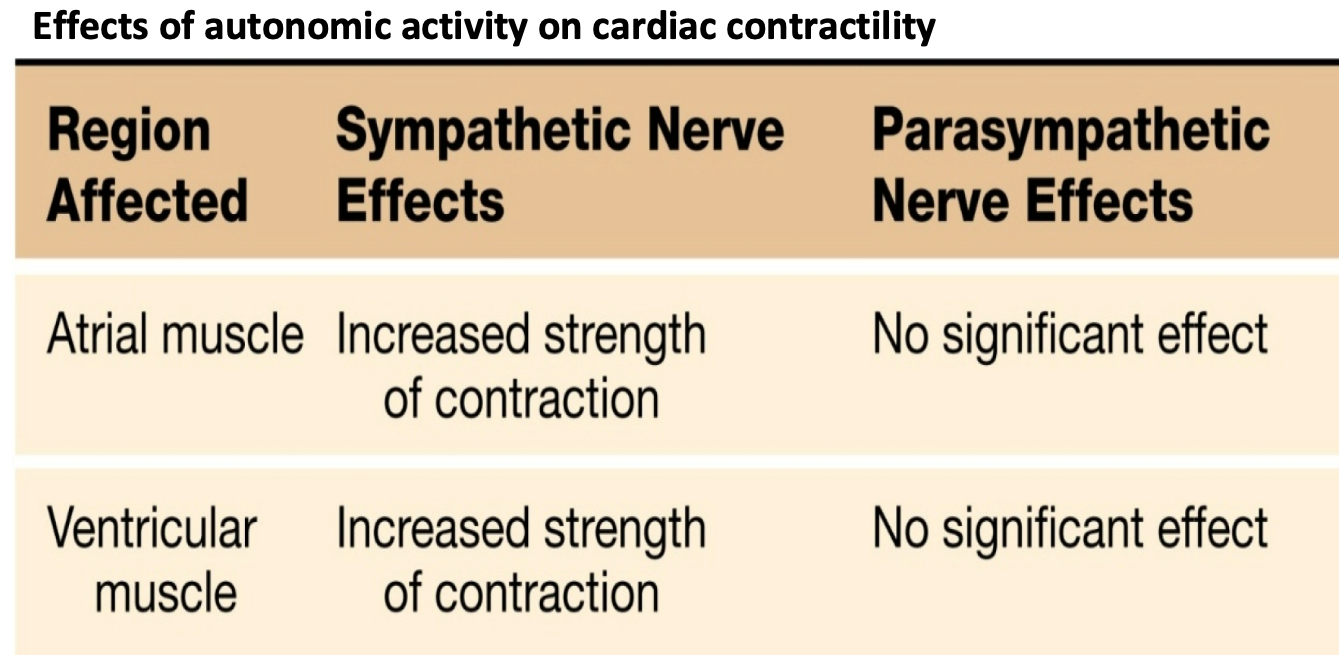
2. CONTRACTILITY: Strength of ventricular contraction
1. Stroke volume increases with contractility
3. AFTERLOAD: Systemic Artery Pressure (Aortic Pressure)
1. Inversely related to stroke volume \n as blood pressure increases, SV decreases
2. Strength of ventricular contraction increases as EDV increases
68
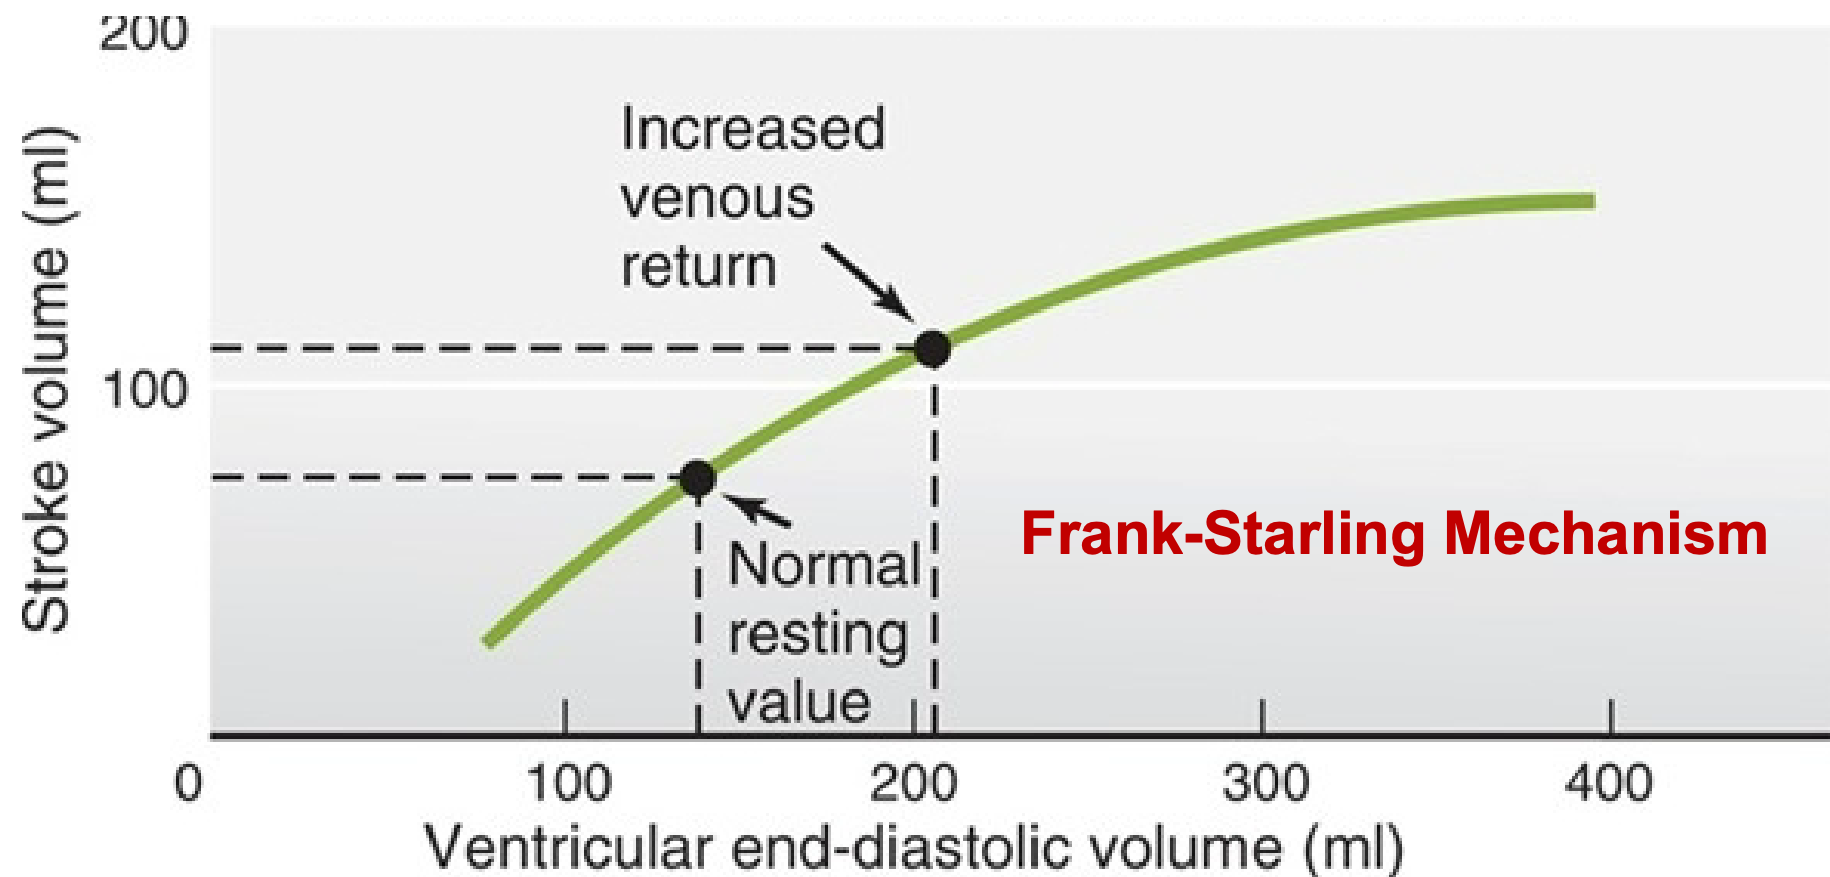
New cards
Frank-Starling Law of the Heart
1. Increased EDV = increased contraction = increased stroke volume
2. Fill the heart more fully with blood
1. Increased stretch of ventricle
1. Stretch myocytes
2. Optimizes overlap between actin, and myosin filaments
3. SV increases
69
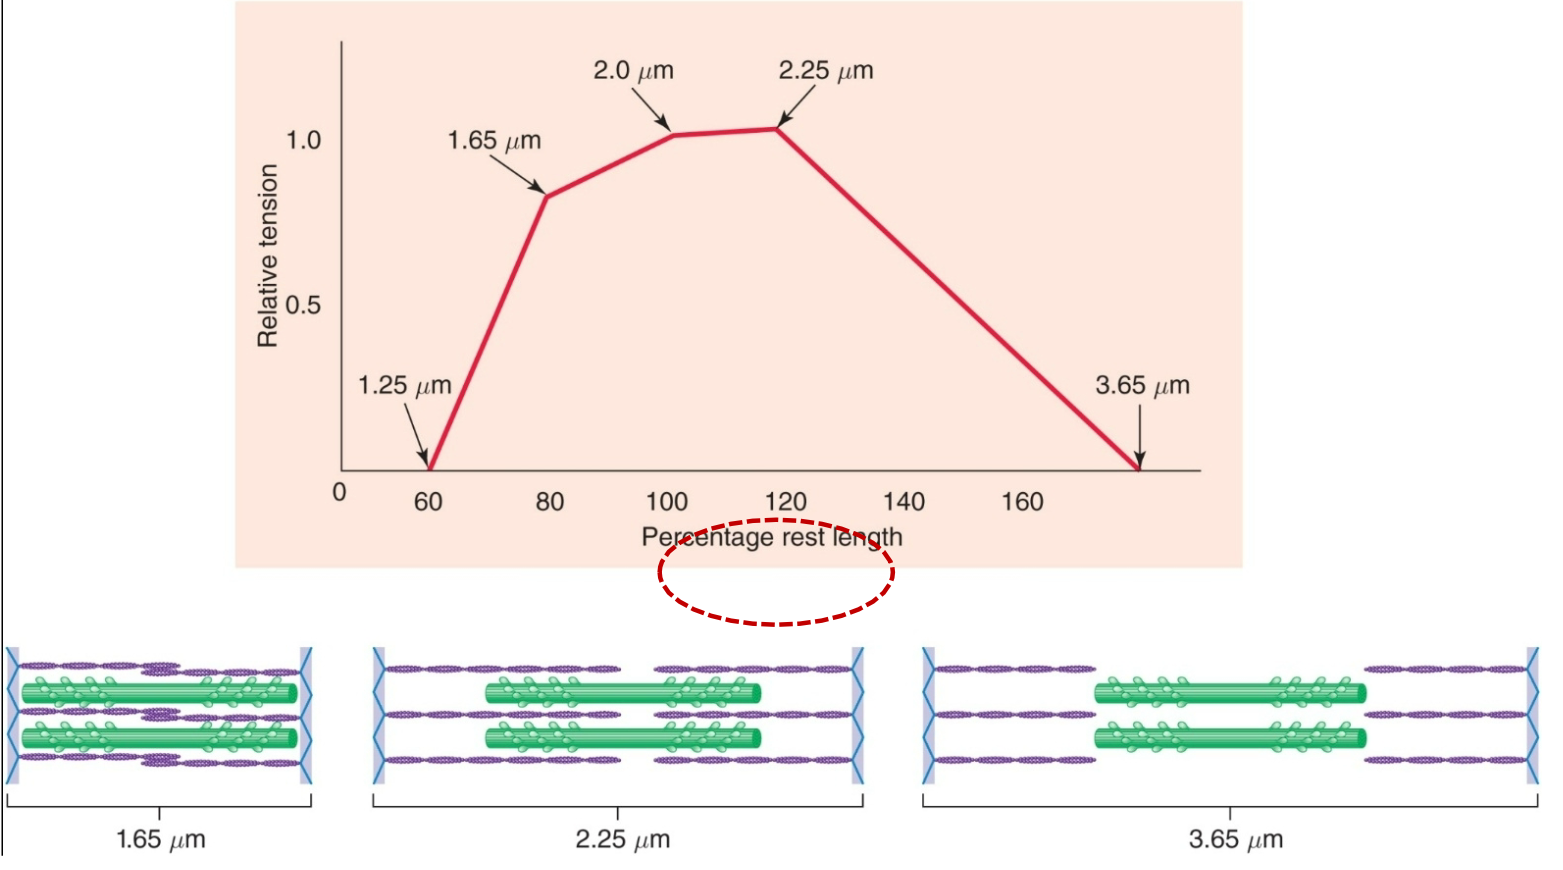
New cards
Length-Tension Relationship
Maximum tension generated when muscle is 100-120% of its resting length
70
New cards
Intrinsic Control of Contractility
1. Due to myocardial stretch
1. Increased filling volume (EDV)
1. Stretches myocardium
2. Increases contraction strength
2. Due to increased myosin and actin overlap and increased sensitivity to Ca2+ in cardiac muscle cells
71
New cards
Venous Return
1. Ventricular filling (EDV) controlled by factors that affect venous return
1. Total blood volume
2. Venous pressure (driving force for blood return)
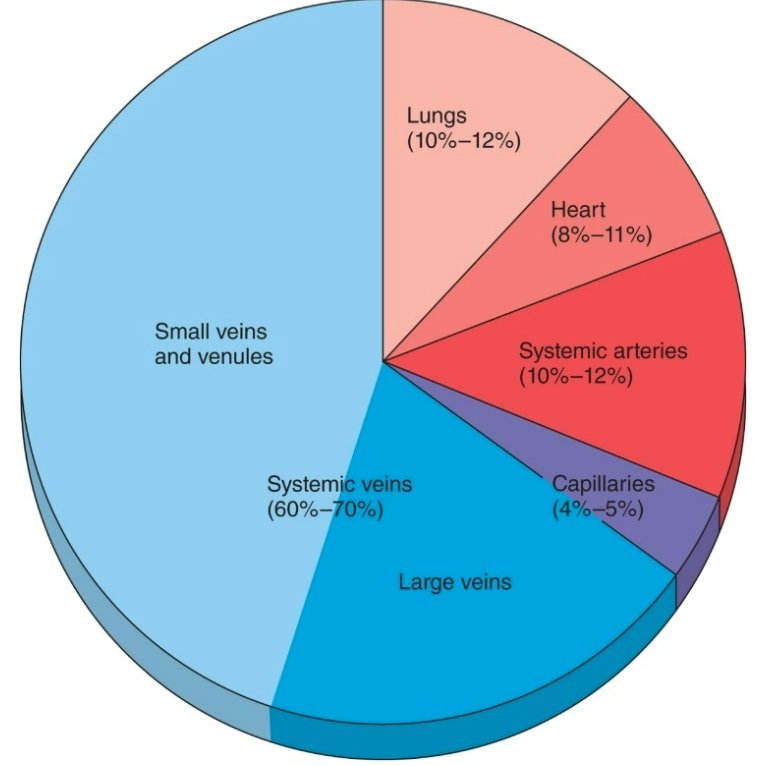
2. Veins have thinner walls than arteries and can stretch more
3. 2/3 of the total blood volume is in veins (under resting conditions)
4. Veins have one-way valves so one-way flow to heart
5. Veins are volume reservoirs
6. Venoconstriction decreases volume veins can hold so send more blood to heart
72
New cards
Factors in Venous Return
1. Pressure gradient in vasculature
1. Flow
2. Sympathetic nerve activity to stimulate smooth muscle contraction to constrict veins and lower volume that the veins can hold
1. Blood volume
73
New cards
Control of Contractility
1. Contractility – strength of contraction at any given length
2. Sympathetic norepinephrine and adrenal epinephrine increase contractility:
1. more force (pressure) for a given filling volume \n beta-1 receptors on cardiac myocytes
2. Steeper response to increased sarcomere length
3. Note: there is not a direct effect of parasympathetic stimulation on contractility
74
New cards
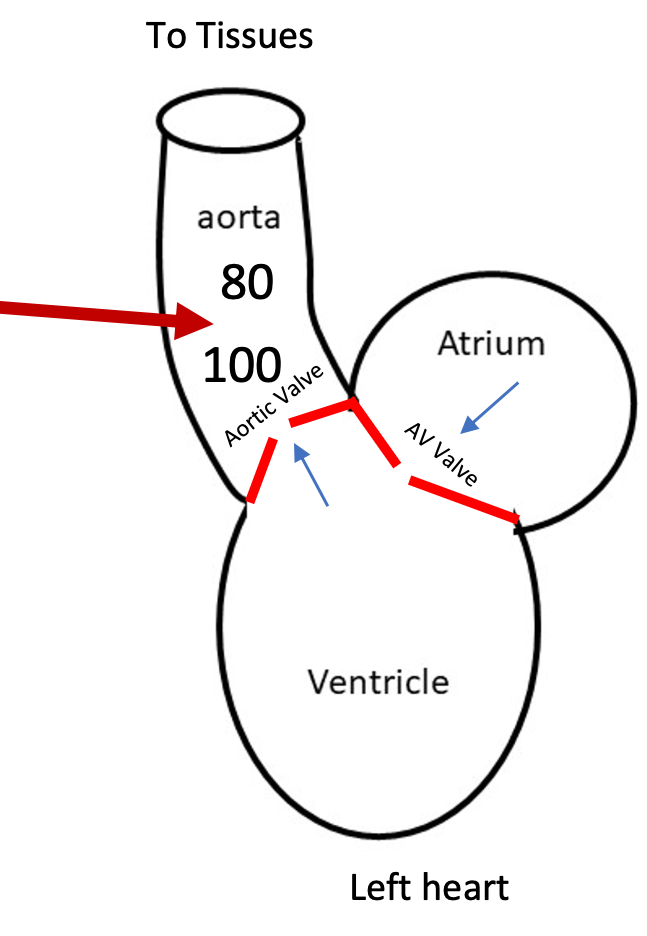
Increased Artery Pressure
1. Sympathetic nerve activity stimulates smooth muscle contraction to constrict arterioles (vasculature) so systemic blood pressure increases
2. Aortic pressure increases
1. Aortic valve only opens when ventricular pressure goes above aortic pressure
2. Ventricle must generate more pressure to go above higher aortic pressure to open aortic valve to eject blood
3. When pressure is higher on the leading side the valve will open
75
New cards
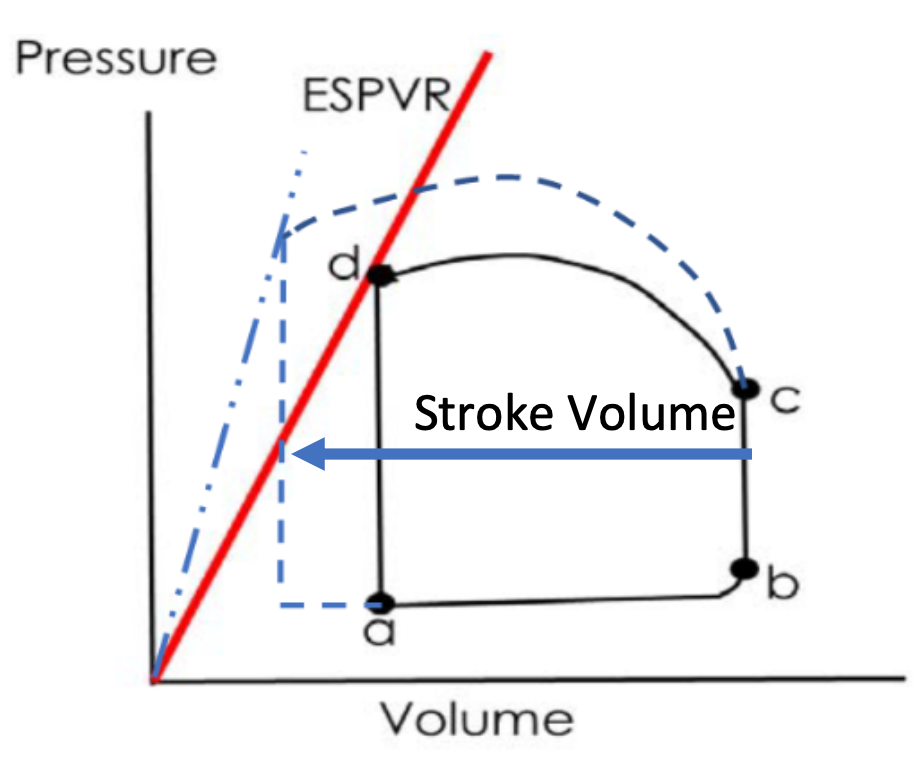
How is ventricular function altered by increased \n contractility?
1. Contractility steepens ESPVR and increases SV
2. Sympathetic stimulation (Epi/NE)
1. Steepens ESPRV
2. Increases strength of contraction
3. Increased pressure at a given volume
3. ESPVR
1. Origin to end-systole (d)
2. Big pressure at lowest volume
1. Index of contractility
76
New cards
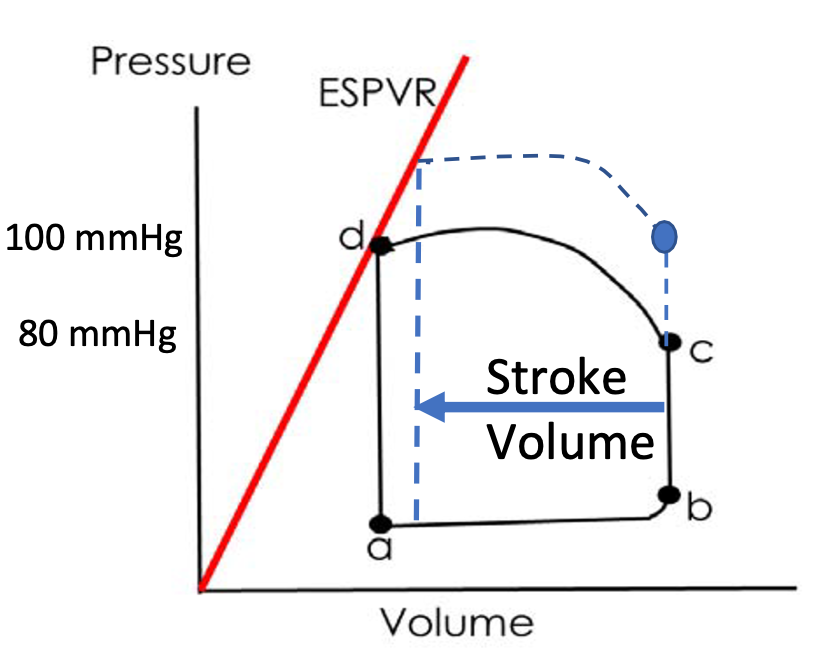
How is ventricular function altered by increased \n blood pressure?
1. Afterload inversely related to stroke volume
2. Ventricle has to work (contract) harder to overcome higher aortic pressure
3. Afterload: pressure at C
4. Arterial Blood Pressure = Afterload
77
New cards
Blood Vessels
1. Conduit/delivery system
1. Plumbing
2. Consists of
1. Arteries, arterioles, capillaries, veins
3. Pulmonary and systemic circulation
78
New cards
Veins
1. Blood vessel
2. Function as storage for blood
1. Volume reservoir
3. Veins return blood back to the heart
4. At rest, majority blood volume (60-70%) is in veins
5. Veins have lower pressure (2) than arteries (100)
6. Thinner walls than arteries, larger lumen, less elastic, some smooth muscle
1. Venous valves: ensure one-way directional flow \n to heart
2. Skeletal muscle pumps: contraction of muscles surrounding veins help force blood towards heart, important during exercise
7. Contraction of smooth muscle in veins
1. Constricts veins (decreases diameter)
2. Less space for blood to be stored in veins
3. Sends more blood back to heart
1. Increases venous return
2. Increases filling of ventricle/preload
8. Sympathetic stimulation will increase venous return
79
New cards
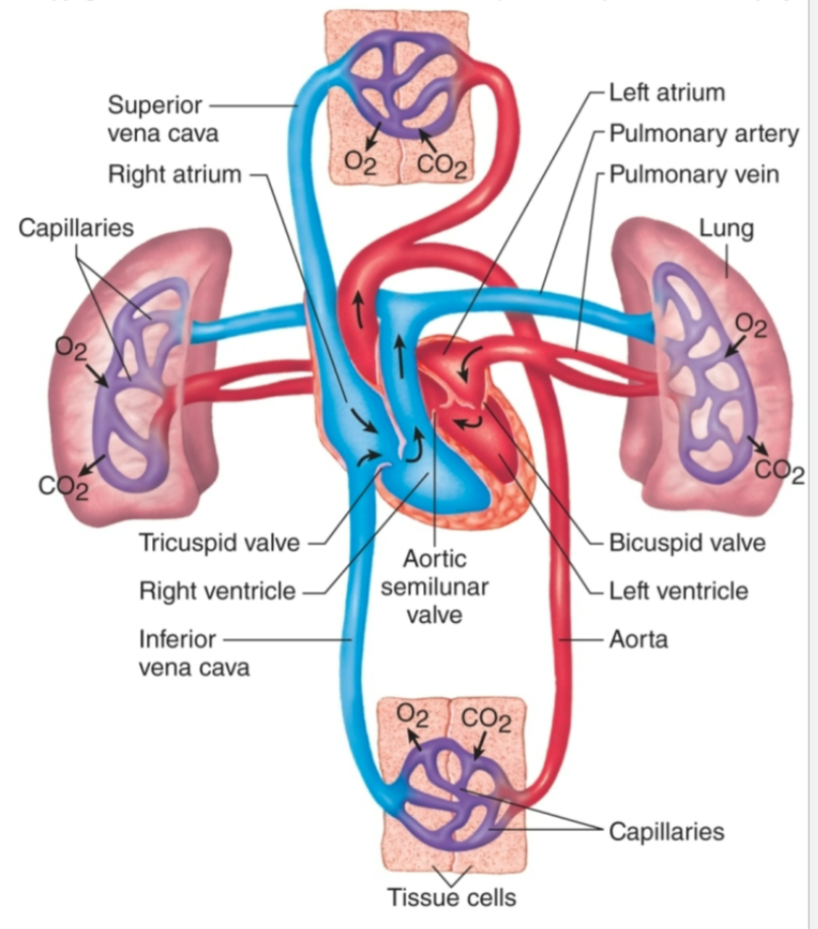
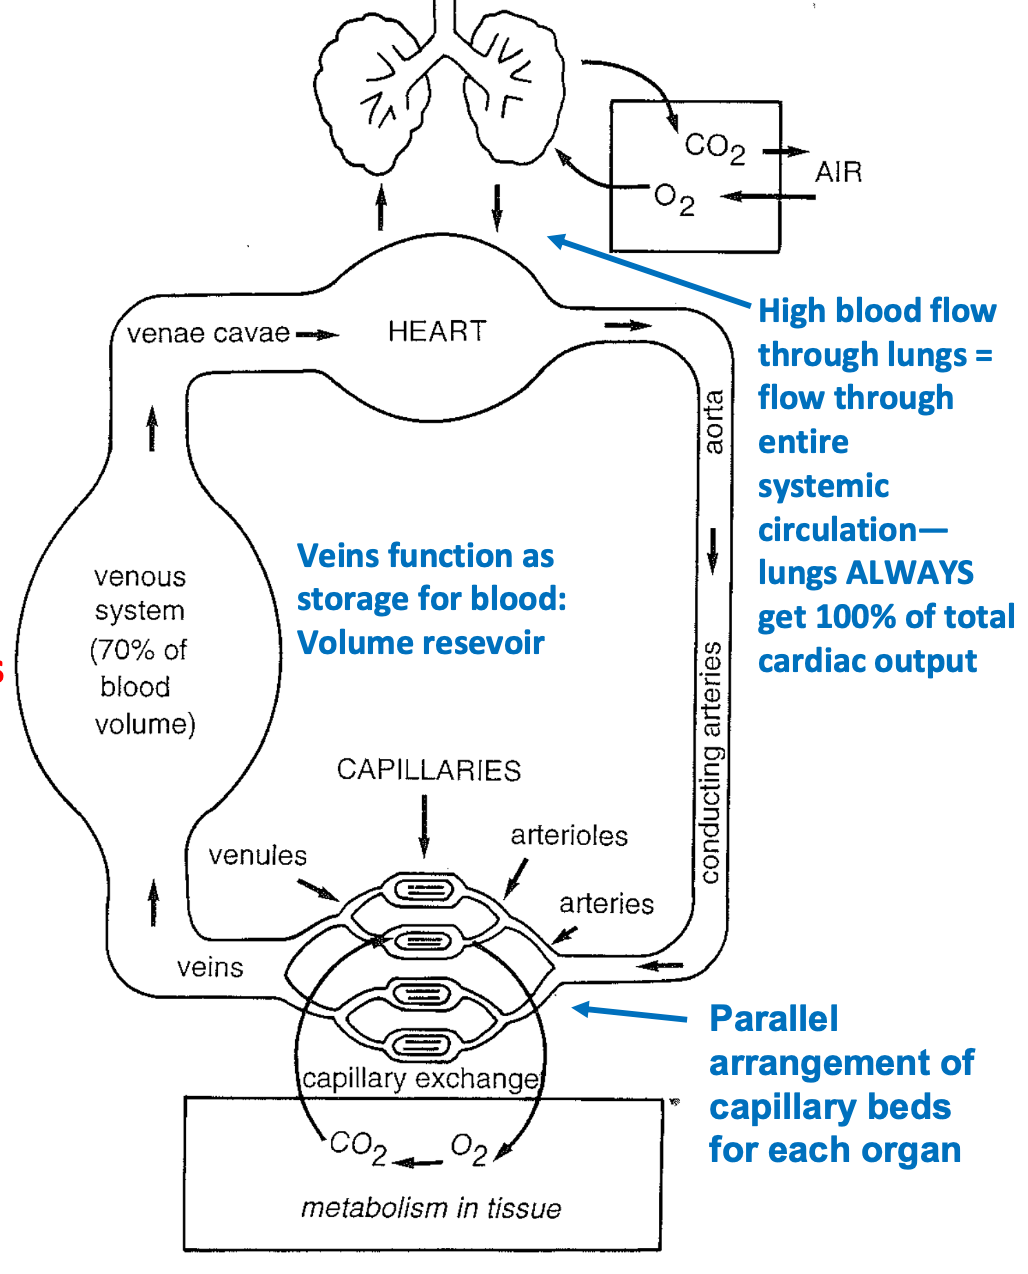
Relation of Heart to Circulatory System
1. Right heart pumps deoxygenated \n blood to lungs
1. Drop off CO2
2. Pick up O2
3. High blood flow through lungs = flow through \n entire systemic circulation
4. Lungs ALWAYS get 100% of total cardiac output
2. Left heart pumps newly oxygenated blood to systemic circulation
1. Aorta>other arteries>arterioles>capillaries
3. Progressively branching arteries \n lead to capillary beds and gas exchange
1. Drop off O2
2. Pick up CO2
4. Veins return blood back to heart to begin cycle again
1. Venules
80
New cards
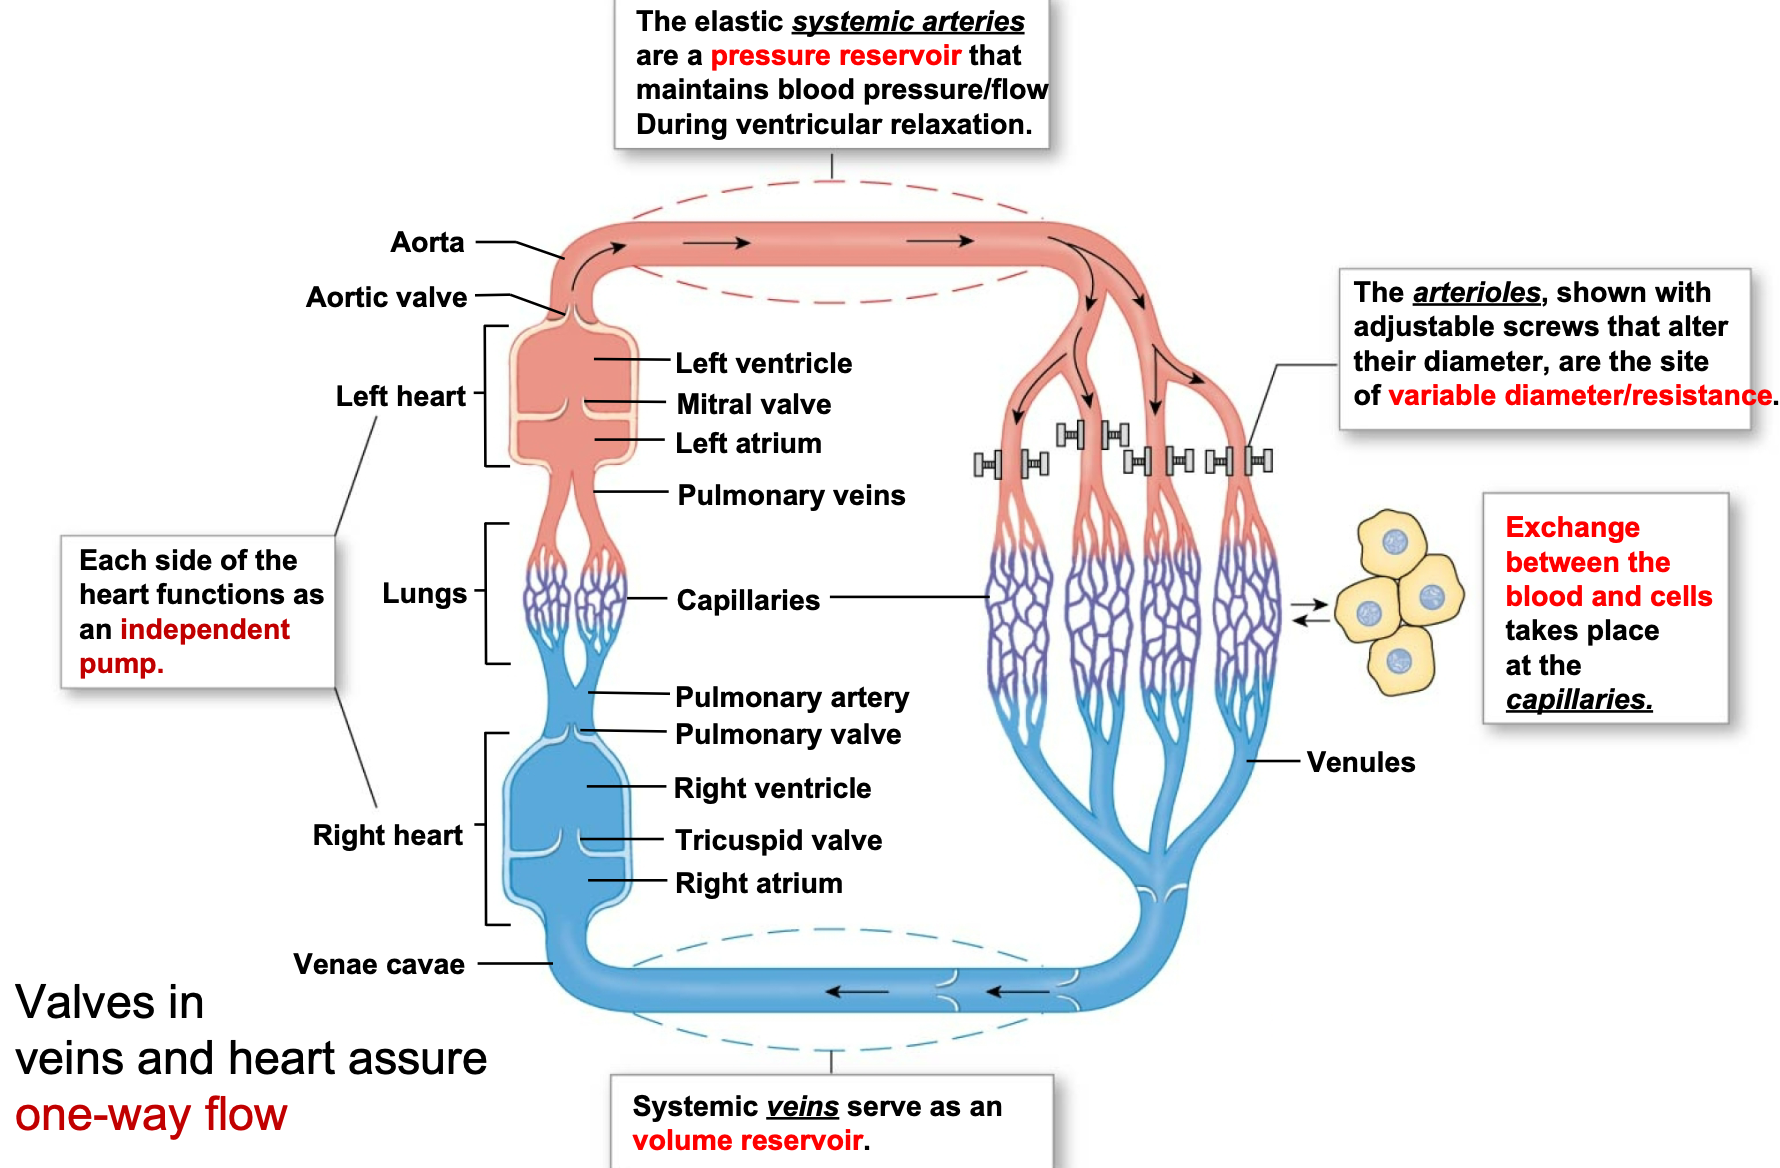
Functions of the Plumping Parts of the Heart
1. Elastic systemic arteries are a pressure reservoir that \n maintains blood pressure/flow during ventricular relaxation
2. Arterioles are the site of variable diameter/**resistance**
1. Contraction or relaxation of smooth muscle in arterioles (increases or decreases diameter) regulates blood pressure and flow to capillary beds
3. Capillaries are the site of the exchange between blood and cells
4. Systemic veins are a volume reservoir
5. Each side of the heart functions as an independent pump
6. Valves in veins and heart assure one-way flow
81
New cards
Large Arteries (Aorta)
1. Pressure reservoir
2. Elastic arteries are closer to the heart
1. Stretch as blood is pumped into them
2. Recoil when ventricles relax
3. Maintains pressure and constant blood flow in circulation
4. Systolic BP
1. At end of Systole (ejection)
2. Aortic pressure is highest
5. Diastolic BP
1. At end of IVC (just before next ejection)
2. Aortic pressure is lowest
82
New cards
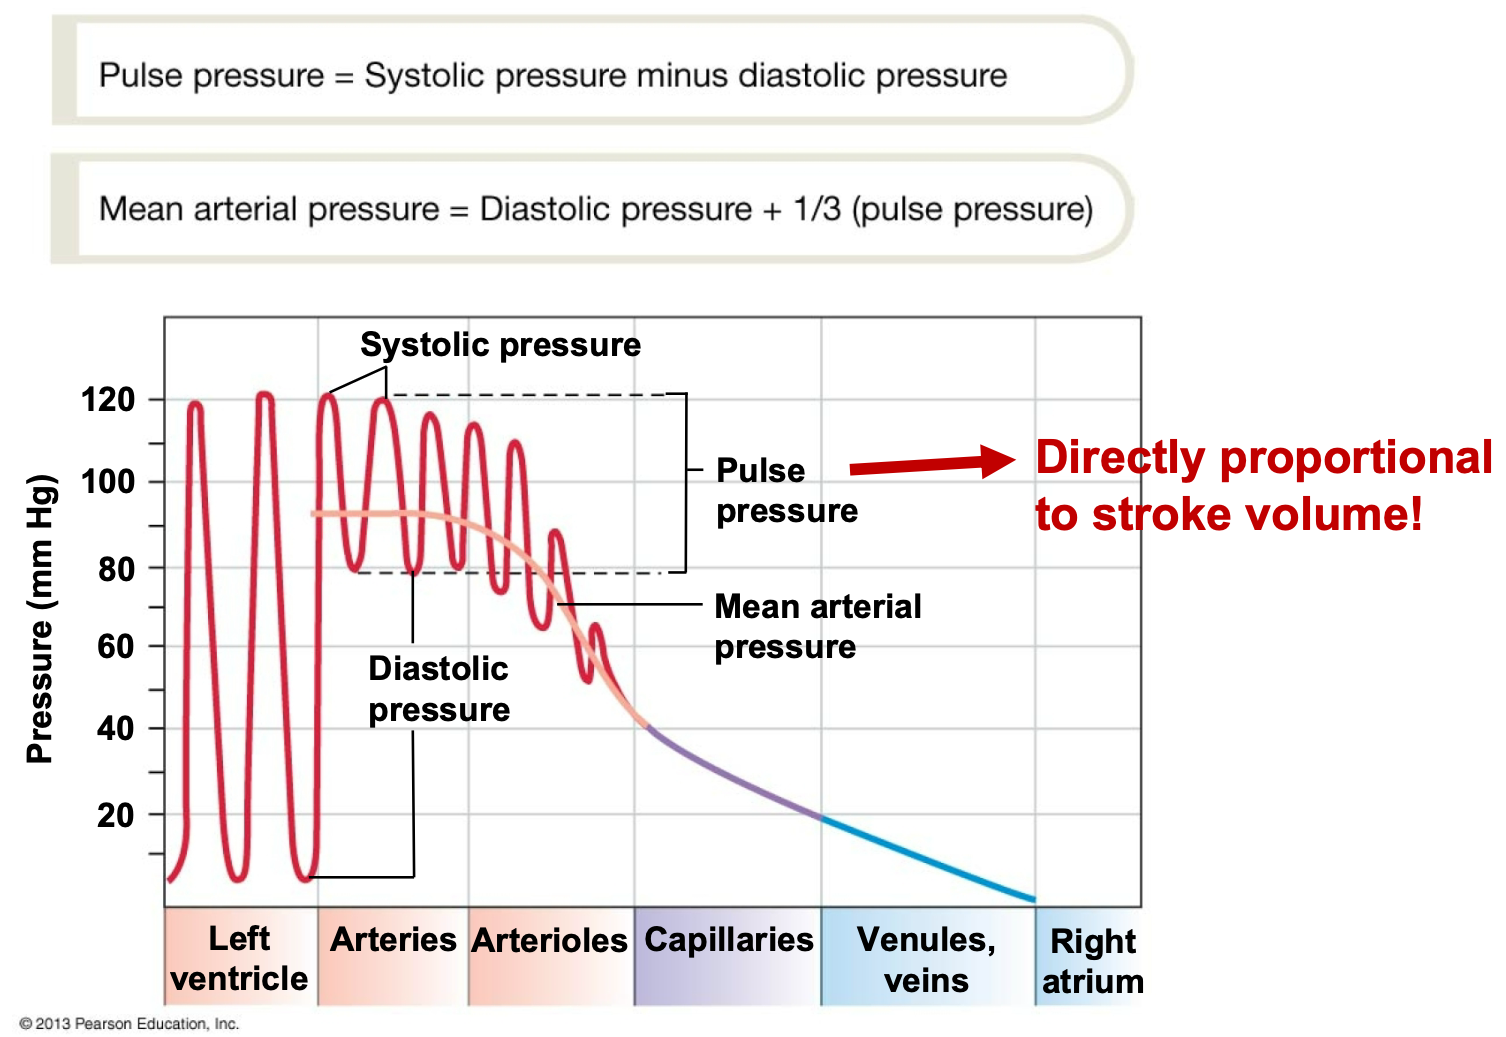
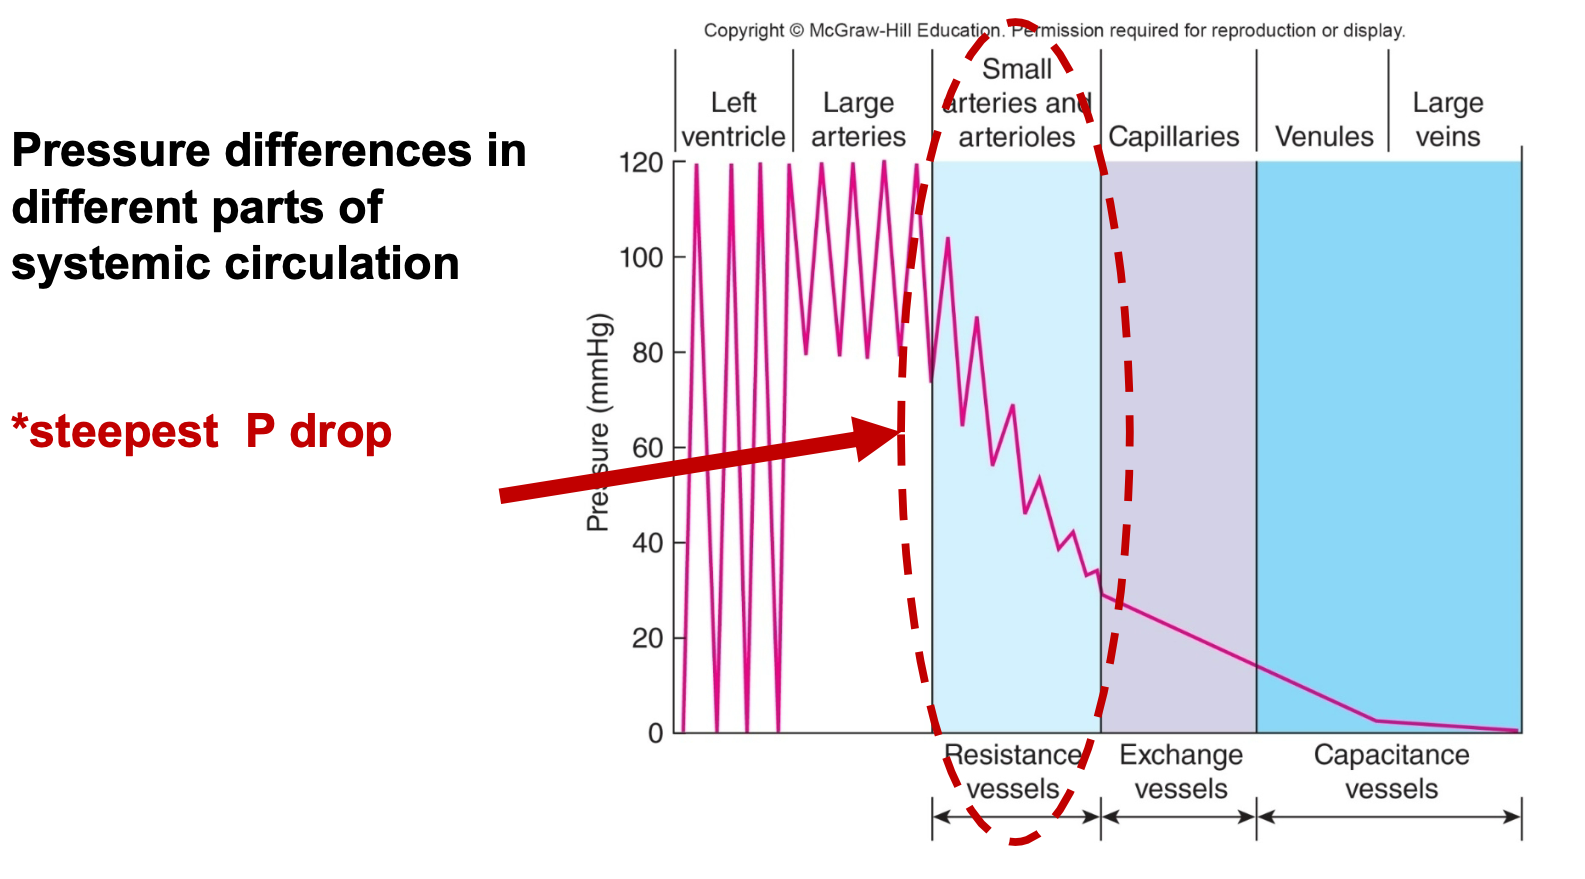
SYSTEMIC CIRCULATION PRESSURES
1. Pressure waves created by ventricular contraction travel into blood vessels
2. Pressure in arterial side of circulation cycles, but pressure waves diminish in amplitude with distance and disappear at capillaries
3. Pulse pressure is directly proportional to stroke volume
83
New cards
Muscular Arteries/Arterioles
1. Farther from heart
1. Have more smooth muscle in proportion to diameter
2. Have more resistance due to smaller lumen
2. Contraction or relaxation of smooth muscle in arterioles (increases or decreases diameter) regulates blood \n pressure and flow to capillary beds
84
New cards
Arterioles
1. 20−30 μm in diameter
2. Provide greatest resistance to flow
3. Sets blood pressure and controls blood flow to \n capillaries via smooth muscle
1. RESISTANCE
4. Contraction or relaxation of smooth muscle in arterioles (increases or decreases diameter) regulates blood \n pressure and flow to capillary beds
5. Small arterioles have the steepest pressure drop

85
New cards
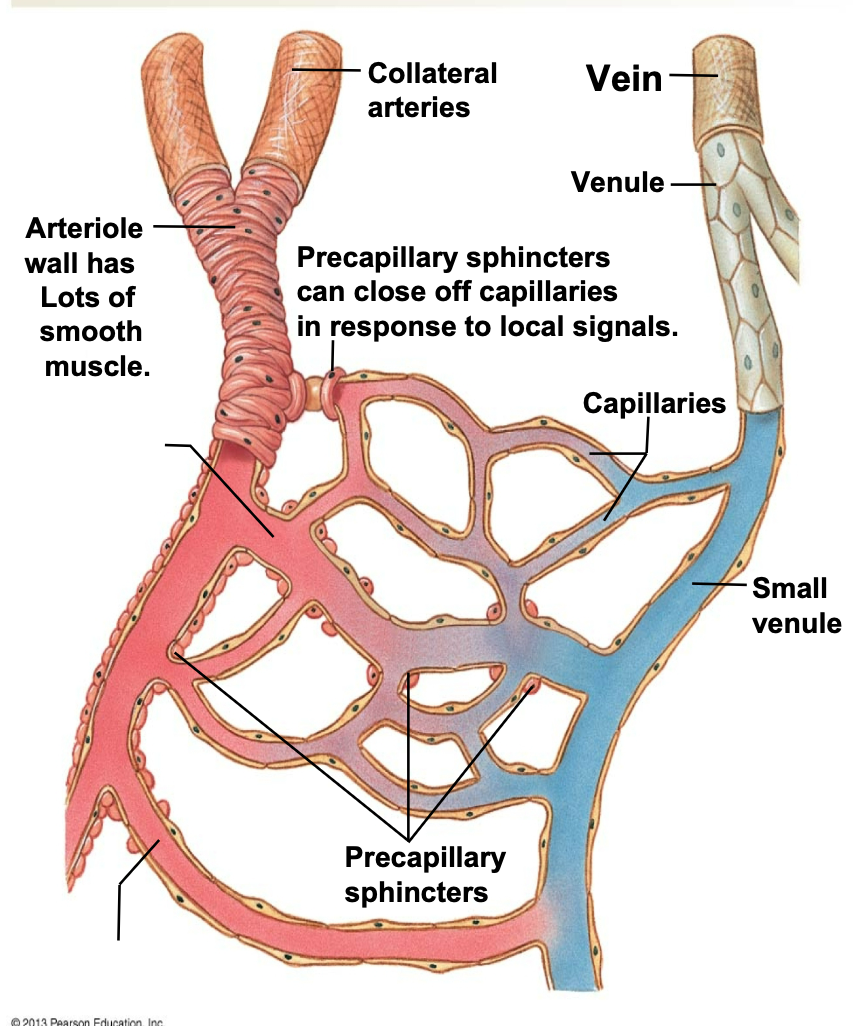
Capillaries
1. Exchange nutrients and gases between blood and ISF/cells
1. Capillaries are leaky vessels for exchange
2. Blood flow to capillaries is regulated by
1. Vasoconstriction and vasodilation of arteriole smooth muscle
2. Precapillary sphincters – affected by local signals
1. e.g. O2/CO2 levels, pH levels
86
New cards
Capillary Exchange
1. Exchange between plasma and interstitial fluid
2. Small dissolved solutes and gases move by diffusion, depending on concentration gradient
3. Larger solutes and proteins move mostly by bulk flow
1. Mass movement in response to hydrostatic or osmotic pressure gradient
4. Uses
1. Filtration
2. Absorption
87
New cards
Filtration
1. Used in capillary exchange
2. Fluid movement out of capillaries
3. Caused by hydrostatic pressure
1. Blood pressure gradient
4. Net filtration at arterial end (beginning) so fluid flows out of capillary to ISF surrounding cells
88
New cards
Absorption
1. Used in capillary exchange
2. Fluid movement into capillaries
3. Net absorption at venous end (end)
4. Caused by colloid osmotic pressure
1. Blood proteins (albumin) drawback the fluid
2. Fluid goes back into capillaries from the ISF
89
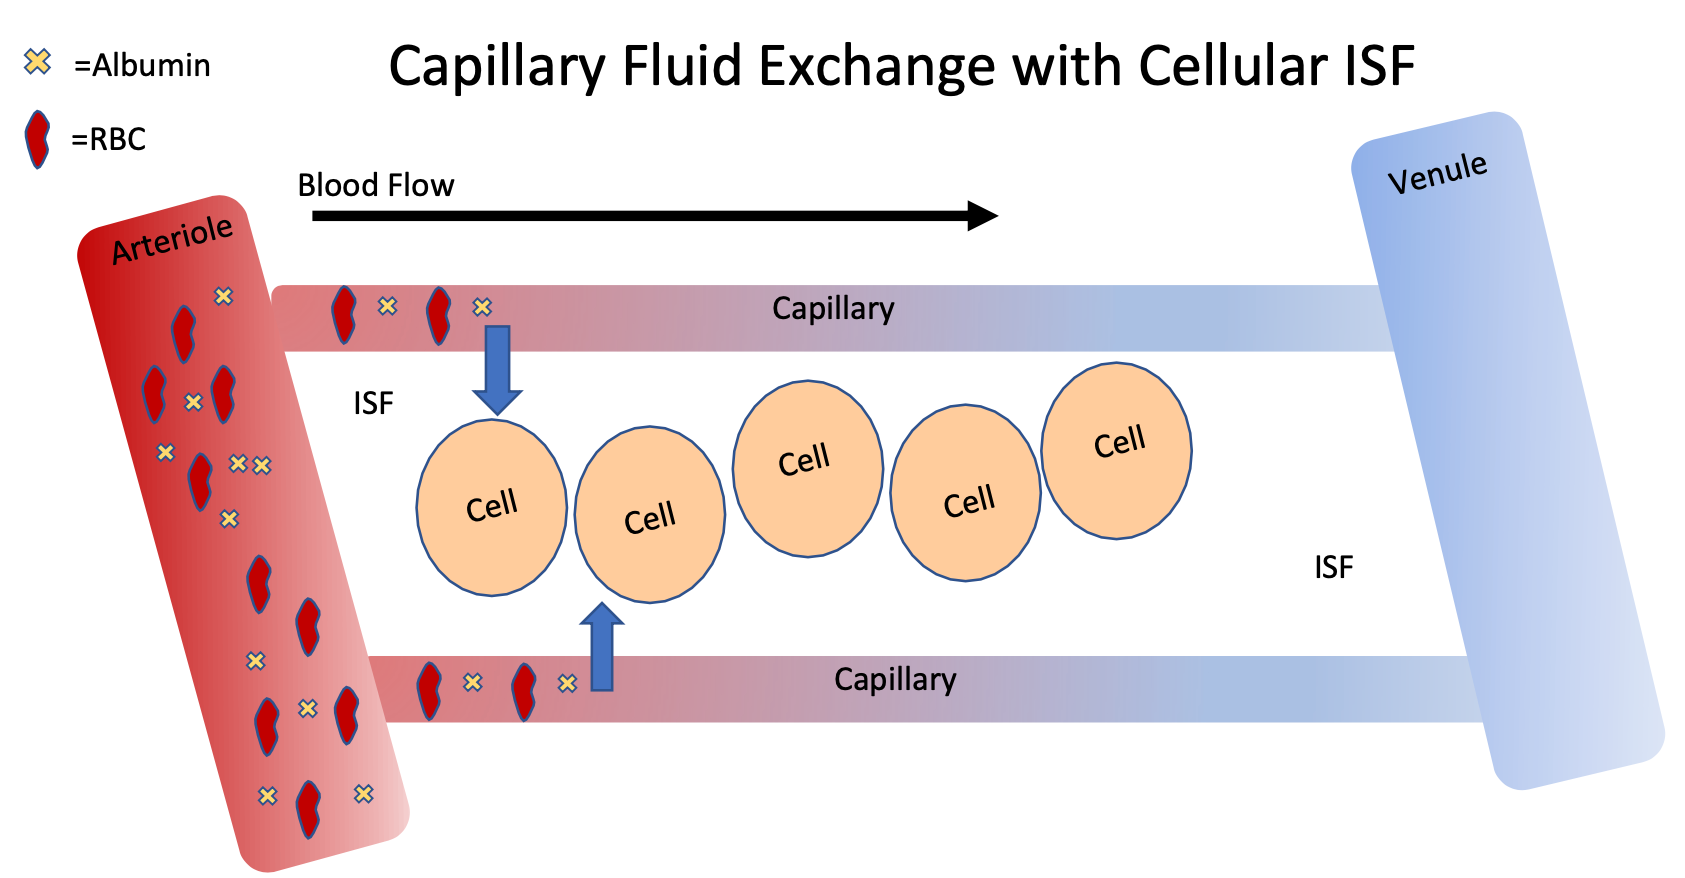
New cards
Capillary Fluid Exchange with Cellular ISF
1. Order of vasculature
2. Components of blood
1. Plasma, RBCs, protein (albumin), glucose, Amino acids, gases (O2 and CO2)
3. Capillary walls are “leaky” so plasma can filter out to ISF, but RBCs and protein are too big to be filtered out
4. Starling forces determine how much fluid can be filtered
90
New cards
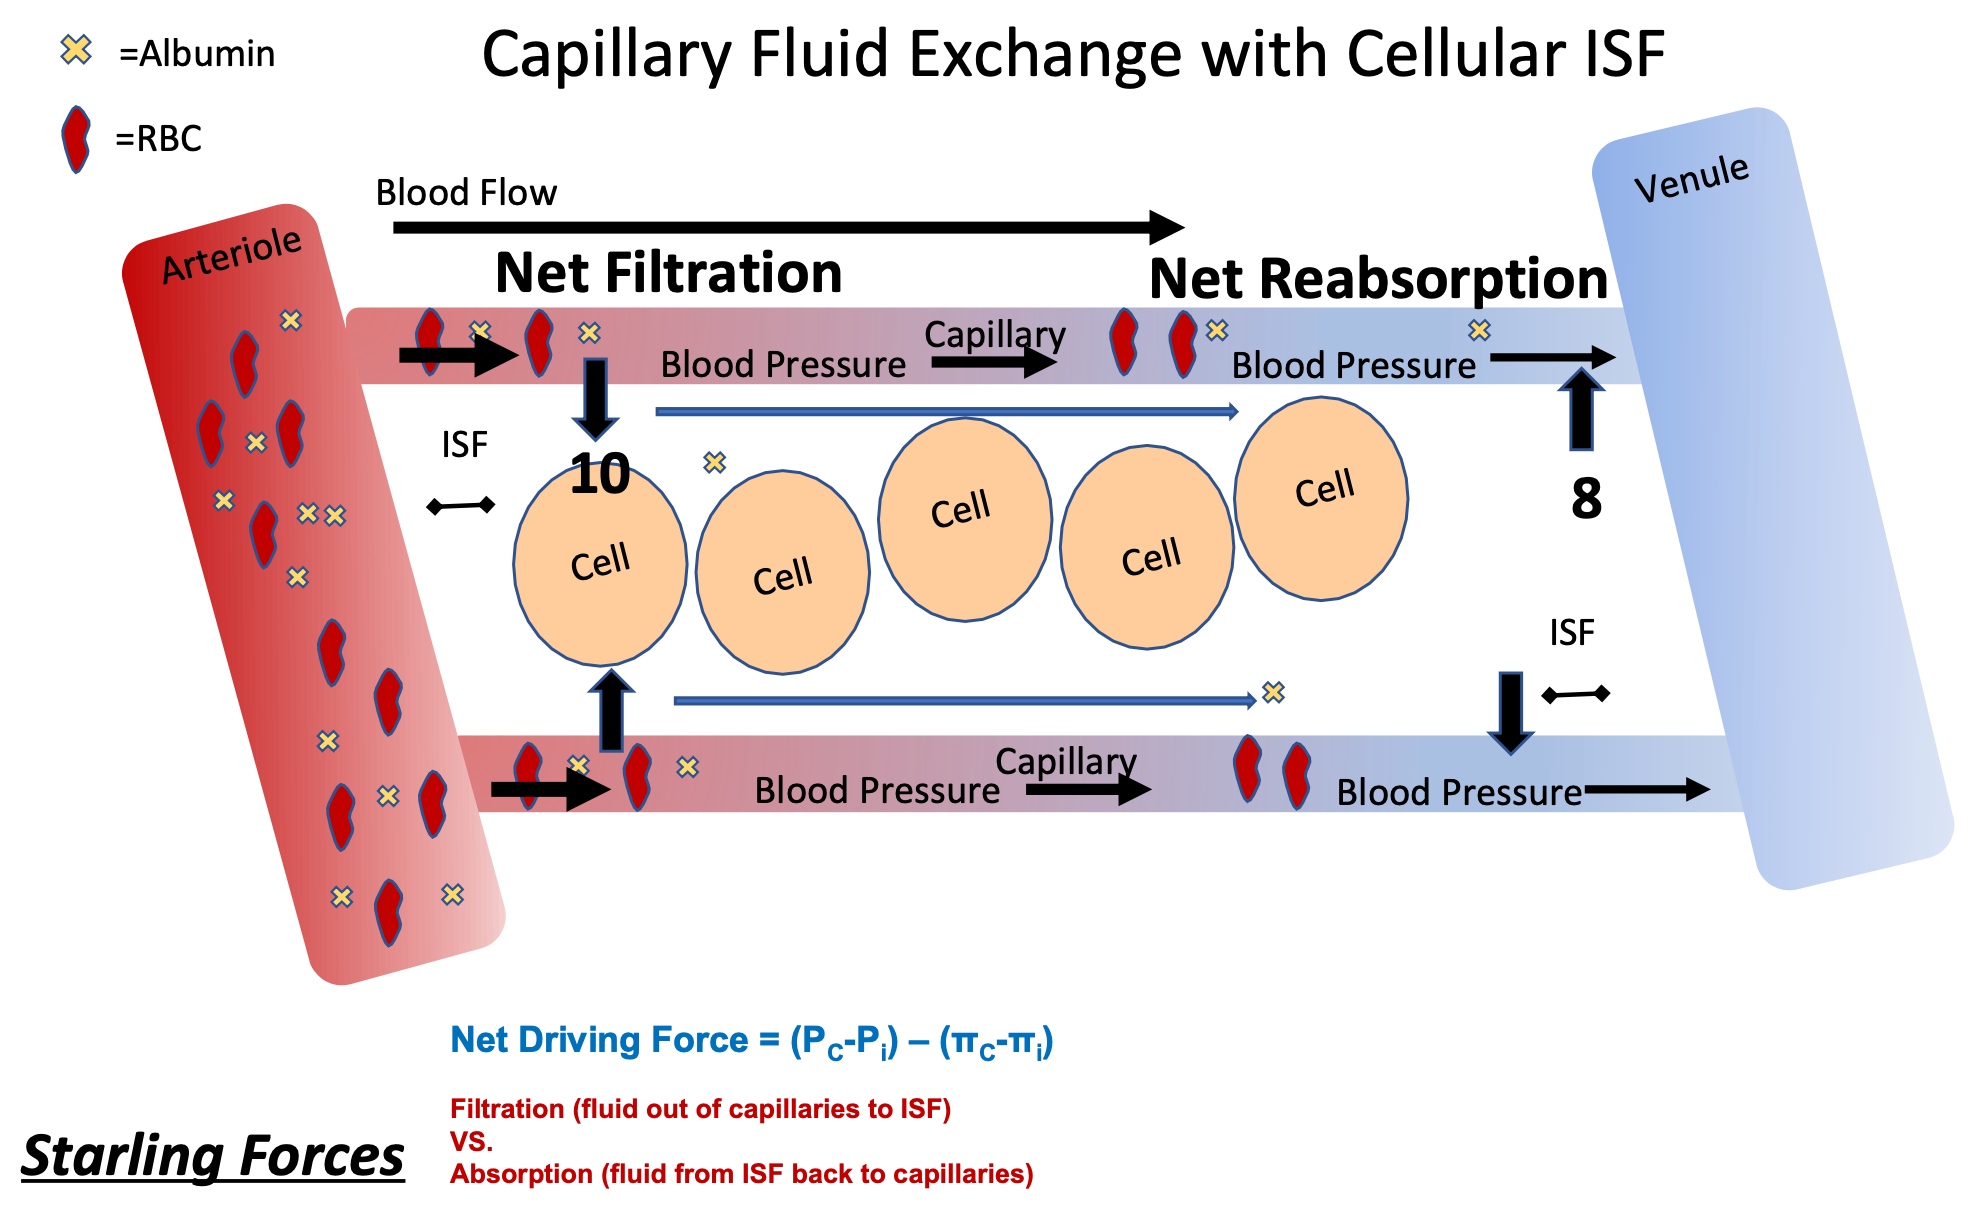
Starling Forces
1. Net driving force = (PC-Pi) – (πC-πi)
2. Hydrostatic Pressure (P)
1. Fluid pressure
1. PC = capillary hydrostatic pressure: Blood Pressure at that point
2. Pi = interstitial hydrostatic pressure: ISF pressure at that point (usually low unless edema)
3. Oncotic Pressure (π)
1. Concentration of proteins
1. πC = capillary oncotic pressure: Plasma proteins (largely albumin)
2. πi = interstitial oncotic pressure: normally very little protein in ISF
4. When Hydrostatic is larger than Oncotic, fluid filters out of capillaries
5. When Hydrostatic is smaller than Oncotic, fluid reabsorbs back into capillaries
91
New cards
Capillary Fluid Exchange with Cellular ISF w/ Starling Forces
1. Hydrostatic (fluid) pressure
1. Compare blood pressure in capillary vs I.S.F. pressure at that spot
2. Oncotic pressure
1. Compare protein (albumin ) at that spot
3. Net Filtration to Net Reabsorption
92
New cards
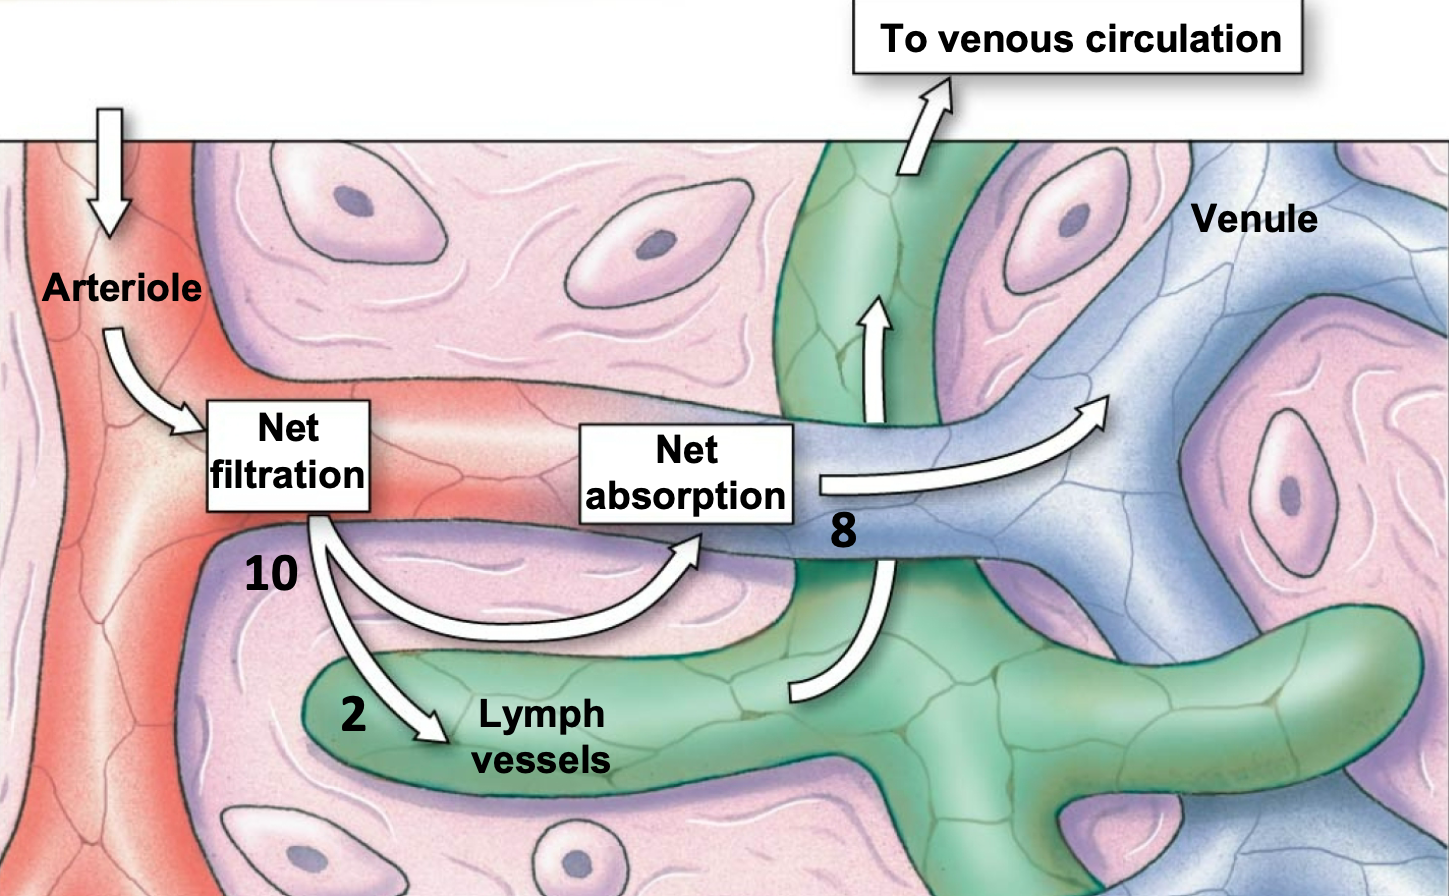
Lymphatic Vessels
1. Just slightly more fluid is filtered on arteriole side than reabsorbed on venule side of the capillaries
2. The remaining fluid is retuned to blood via lymphatic vessels
3. A net average of 3 L/day of fluid filters out of the capillaries
1. Excess water and solutes that filter out of the capillary are picked up by the lymph vessels and returned to the circulation near vena cava
93
New cards
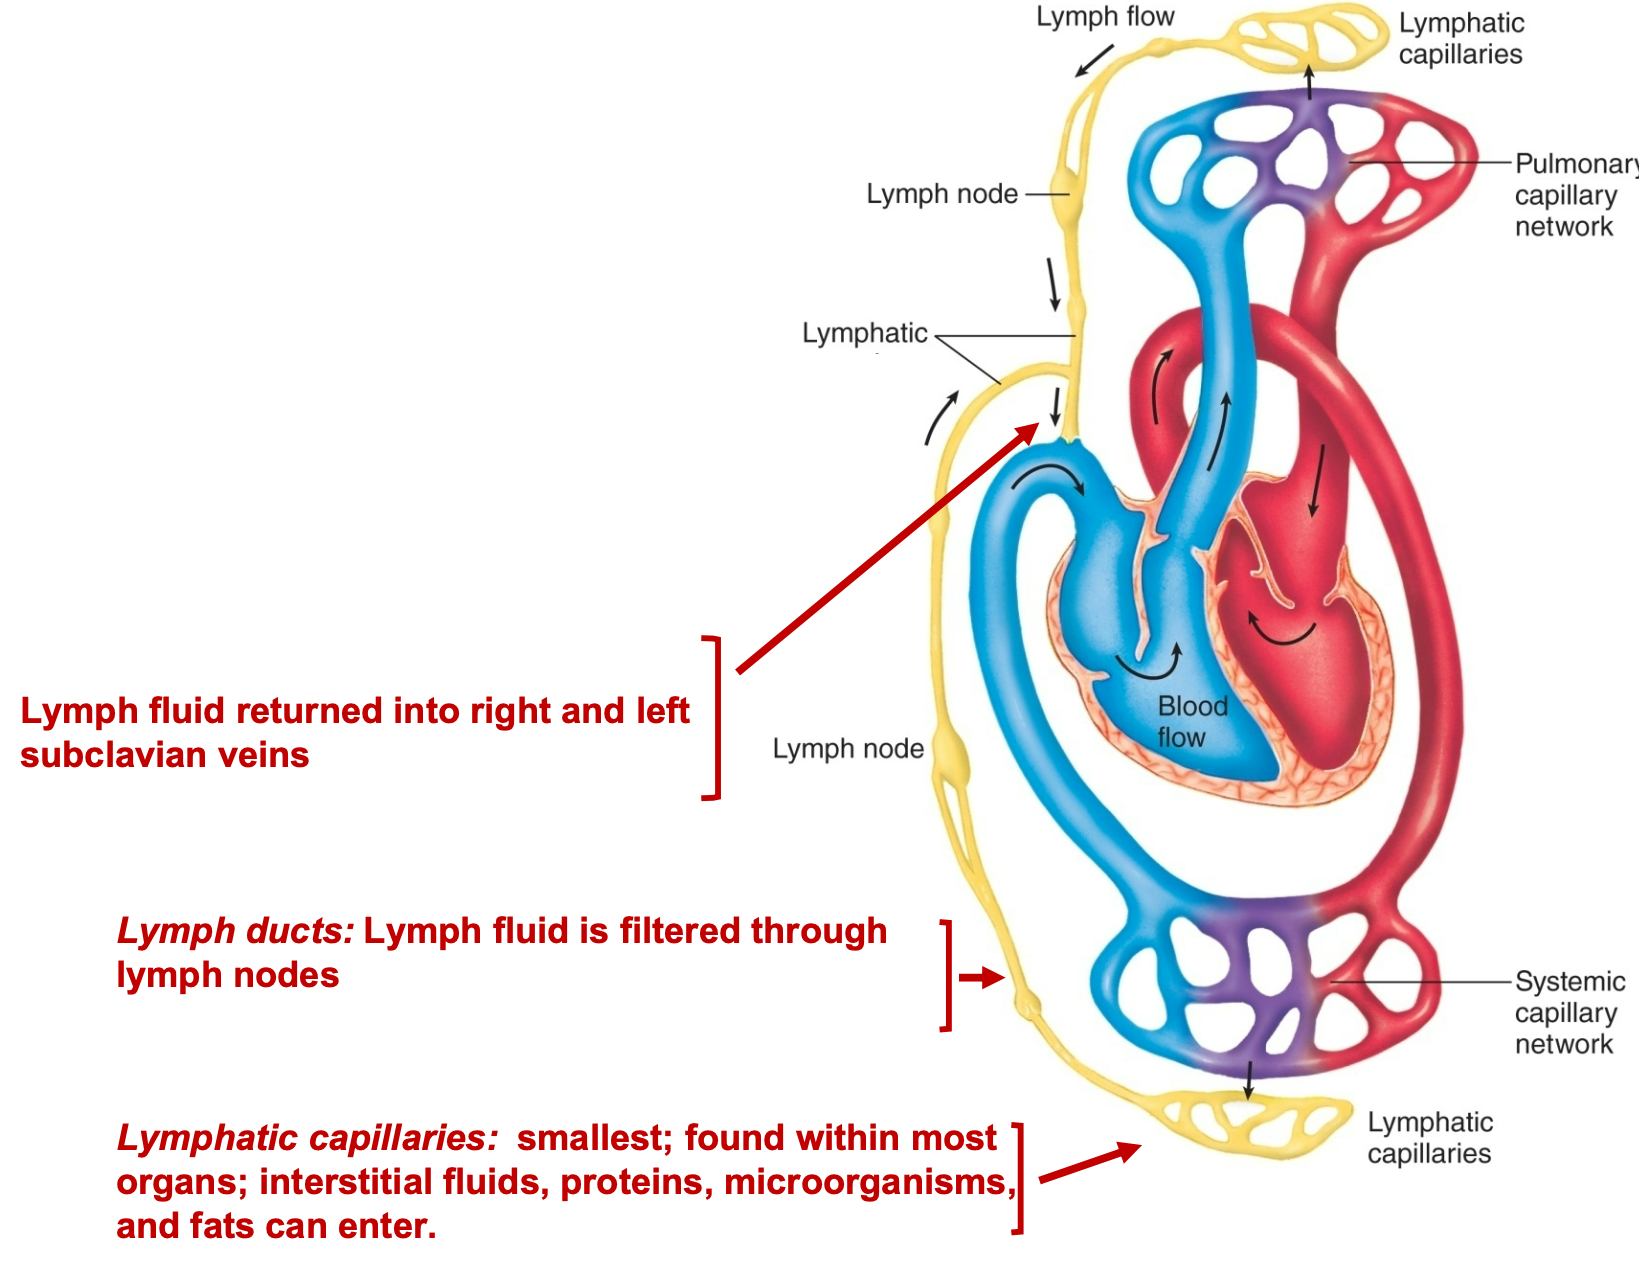
Lymphatic System
1. Returns fluid and proteins to circulatory system, lymphatic cell junctions are very porous, and so is much “leakier” than vascular cell junctions
2. Transports absorbed fat from intestines to blood
3. Serve as filter for pathogens
4. Produces & houses lymphocytes for the immune response
5. Lymphatic capillaries: smallest; found within most \n organs; interstitial fluids, proteins, microorganisms, \n and fats can enter
6. Lymph ducts: Lymph fluid is filtered through lymph nodes
7. Lymph fluid returned into right and left subclavian veins
94
New cards
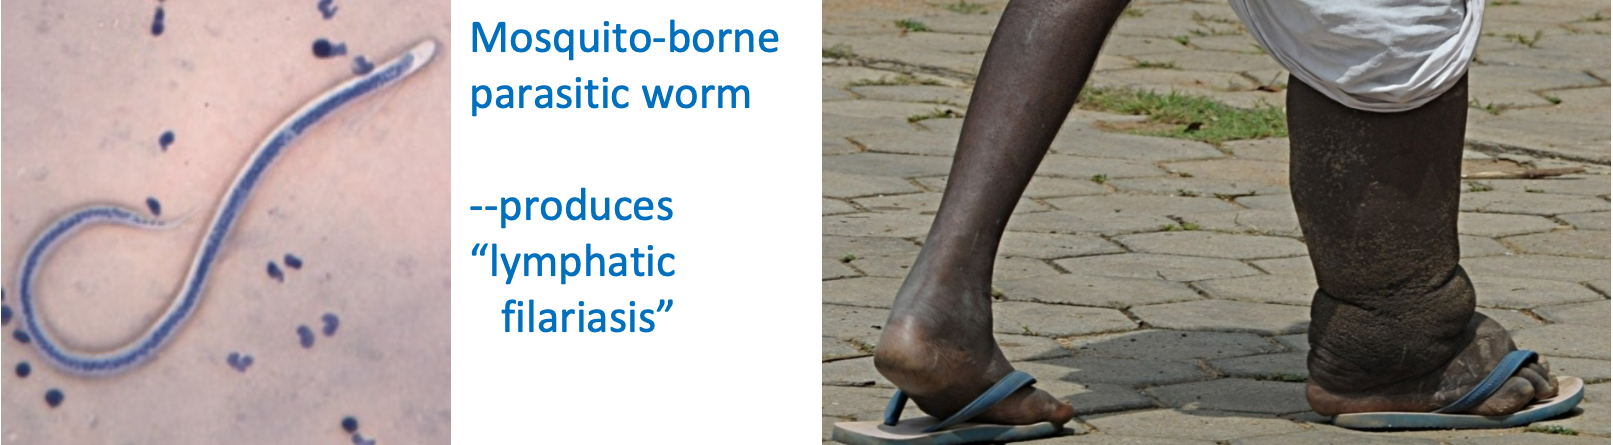
Edema and the Lymphatics
1. Normally, extra fluid that is filtered can be taken up by \n lymphatics and returned to plasma compartment at vena cava at right atria
2. Lymphatic obstruction = Edema
1. e.g. elephantiasis
1. Mosquito-borne parasitic worm
1. produces “lymphatic filariasis”
95
New cards
Starling’s Hypothesis
1. Imbalance in either hydrostatic (fluid pressure) or oncotic pressures (proteins) will result in altered balance between amount of plasma filtration and reabsorption
2. Filtration (fluid out of capillaries to ISF) VS. Absorption (fluid from ISF back to capillaries)
3. Edema: clinical sign of imbalance in these forces—result in increased net filtration (leakage) of water & solutes into the interstitial (ISF) compartment
96
New cards
Generalized Edema
1. Swelling in most dependent parts of body—due to combination of net imbalance between “Starling forces” and gravity \[Pressures expressed as mm Hg\]
2. Increase pressure in capillaries
1. Increase filtration
3. Decrease proteins made
1. Less reabsorption
4. Draws build to ISF
5. Generalized edema = expanded interstitial volume
![1. Swelling in most dependent parts of body—due to combination of net imbalance between “Starling forces” and gravity \[Pressures expressed as mm Hg\]
2. Increase pressure in capillaries
1. Increase filtration
3. Decrease proteins made
1. Less reabsorption
4. Draws build to ISF
5. Generalized edema = expanded interstitial volume](https://knowt-user-attachments.s3.amazonaws.com/45af7871b36647efb0965f4394b34fc9.jpeg)
97
New cards
Summary of Arteries, Veins, Arterioles, and Capillaries
1. Capillaries
1. Perfuse Cells
2. Single layer leaky wall
2. Arteries
1. Pressure Reservoir
2. Elastic walls maintains pressure and flow (when ventricle not ejecting)
3. Arterioles
1. Regulate Blood Pressure/Flow
1. Resistance
2. Smooth muscle contraction
4. Veins
1. Volume Reservoir
2. One-way valves
3. Smooth muscle contraction
4. Increases venous return
98
New cards
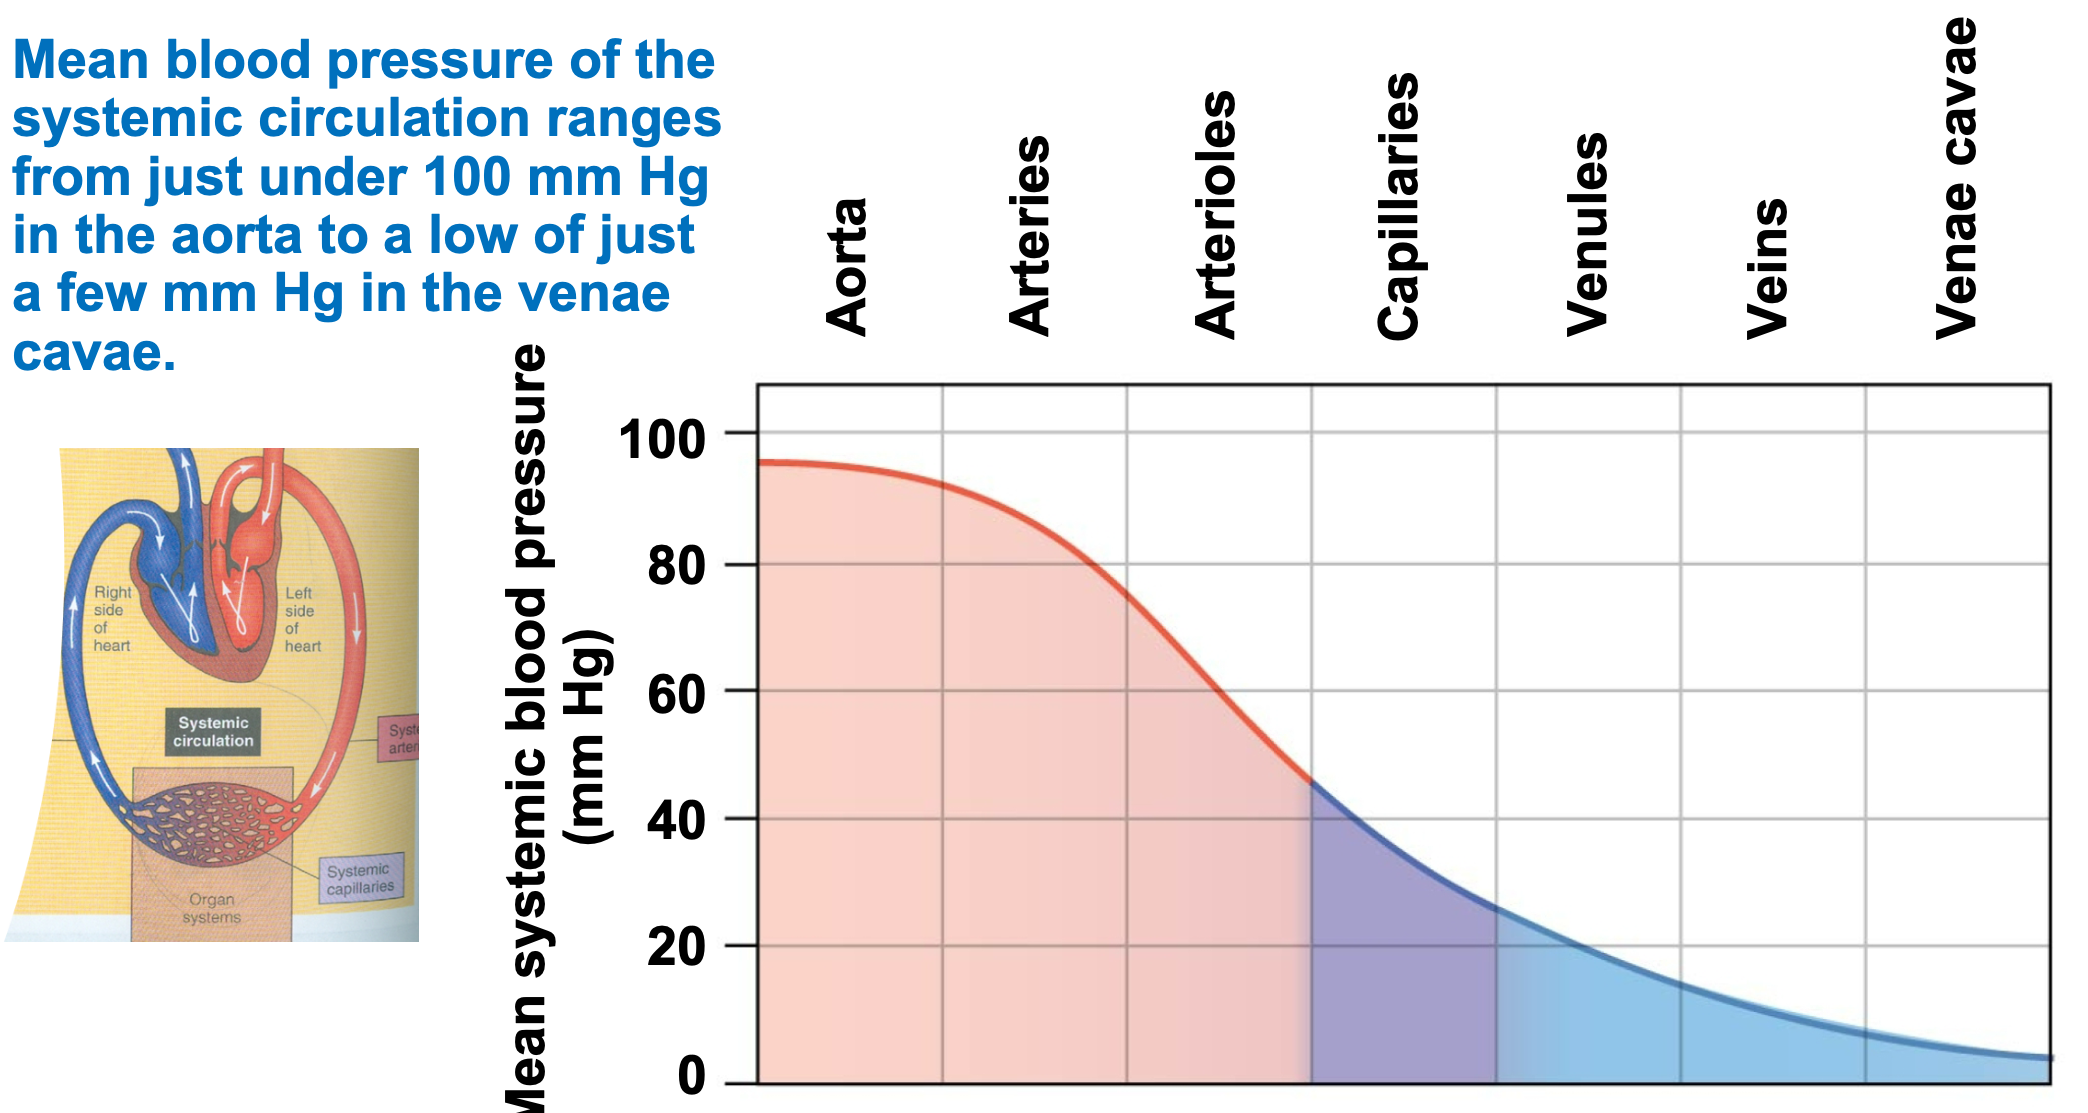
Physics of the Circulation
1. Pressure, volume, flow, and resistance
2. Blood flows down a pressure gradient
3. Mean blood pressure of systemic circulation ranges
1. Just under 100 mm Hg in aorta
2. Low of just a few mm Hg in the venae cavae
99
New cards
Pressure Differentials Drive Blood Flow
1. Resistance (small diameter) Opposes Blood Flow
2. Driving Force Pressure Gradient (ΔP)
1. Pressure created by contracting ventricles is transferred to blood
2. Driving pressure is created by the ventricles
3. Opposing Force: Resistance (R)
1. If blood vessels dilate, blood pressure decreases
2. If blood vessels constrict, blood pressure increases
4. Volume changes affect blood pressure in cardiovascular system
100
New cards
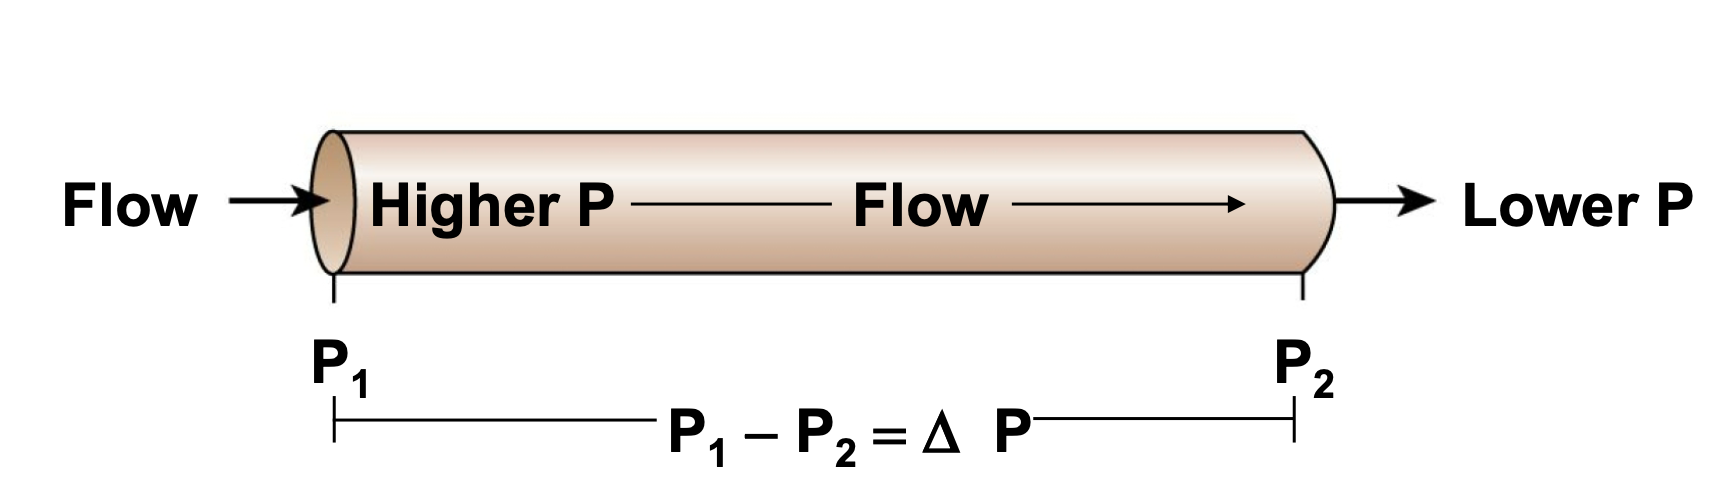
Fluid Flow through a Tube Depends on the Pressure \n Gradient
1. Fluids flow from high to low pressure (pressure \n gradient)
2. Flow through a tube is directly proportional to the pressure gradient
1. Flow is in relation to change in pressure
1. When one increases, the other will too
2. The higher the pressure gradient, the greater the fluid flow
3. Fluid flows only if there is a positive pressure gradient (ΔP)