Chapter 2 - Supply and Demand
1/66
Earn XP
Description and Tags
Name | Mastery | Learn | Test | Matching | Spaced | Call with Kai |
|---|
No analytics yet
Send a link to your students to track their progress
67 Terms
Competitive Market
A market in which there are many buyers and sellers of the same goods or services, none of whom can influence the price at which the good or service is sold.
The Supply and Demand Model
Simulates how a competitive market works.
There are five key elements in this model:
The demand curve
The supply curve
The set of factors that cause the demand curve to shift and the set of factors that cause the supply curve to shift
The market equilibrium, which includes the equilibrium price and equilibrium quantity
The way the market equilibrium changes when the supply curve or demand curve shifts
Demand Schedule
Shows how much of a good or service consumers will be willing and able to buy at different prices.
The quantity demanded
The actual amount of a good or service consumers are willing and able to buy at some specific price.
Demand Curve
A graphical representation of the demand schedule. It shows the relationship between quantity demanded and price.
The Demand Curve Graph
Ex.
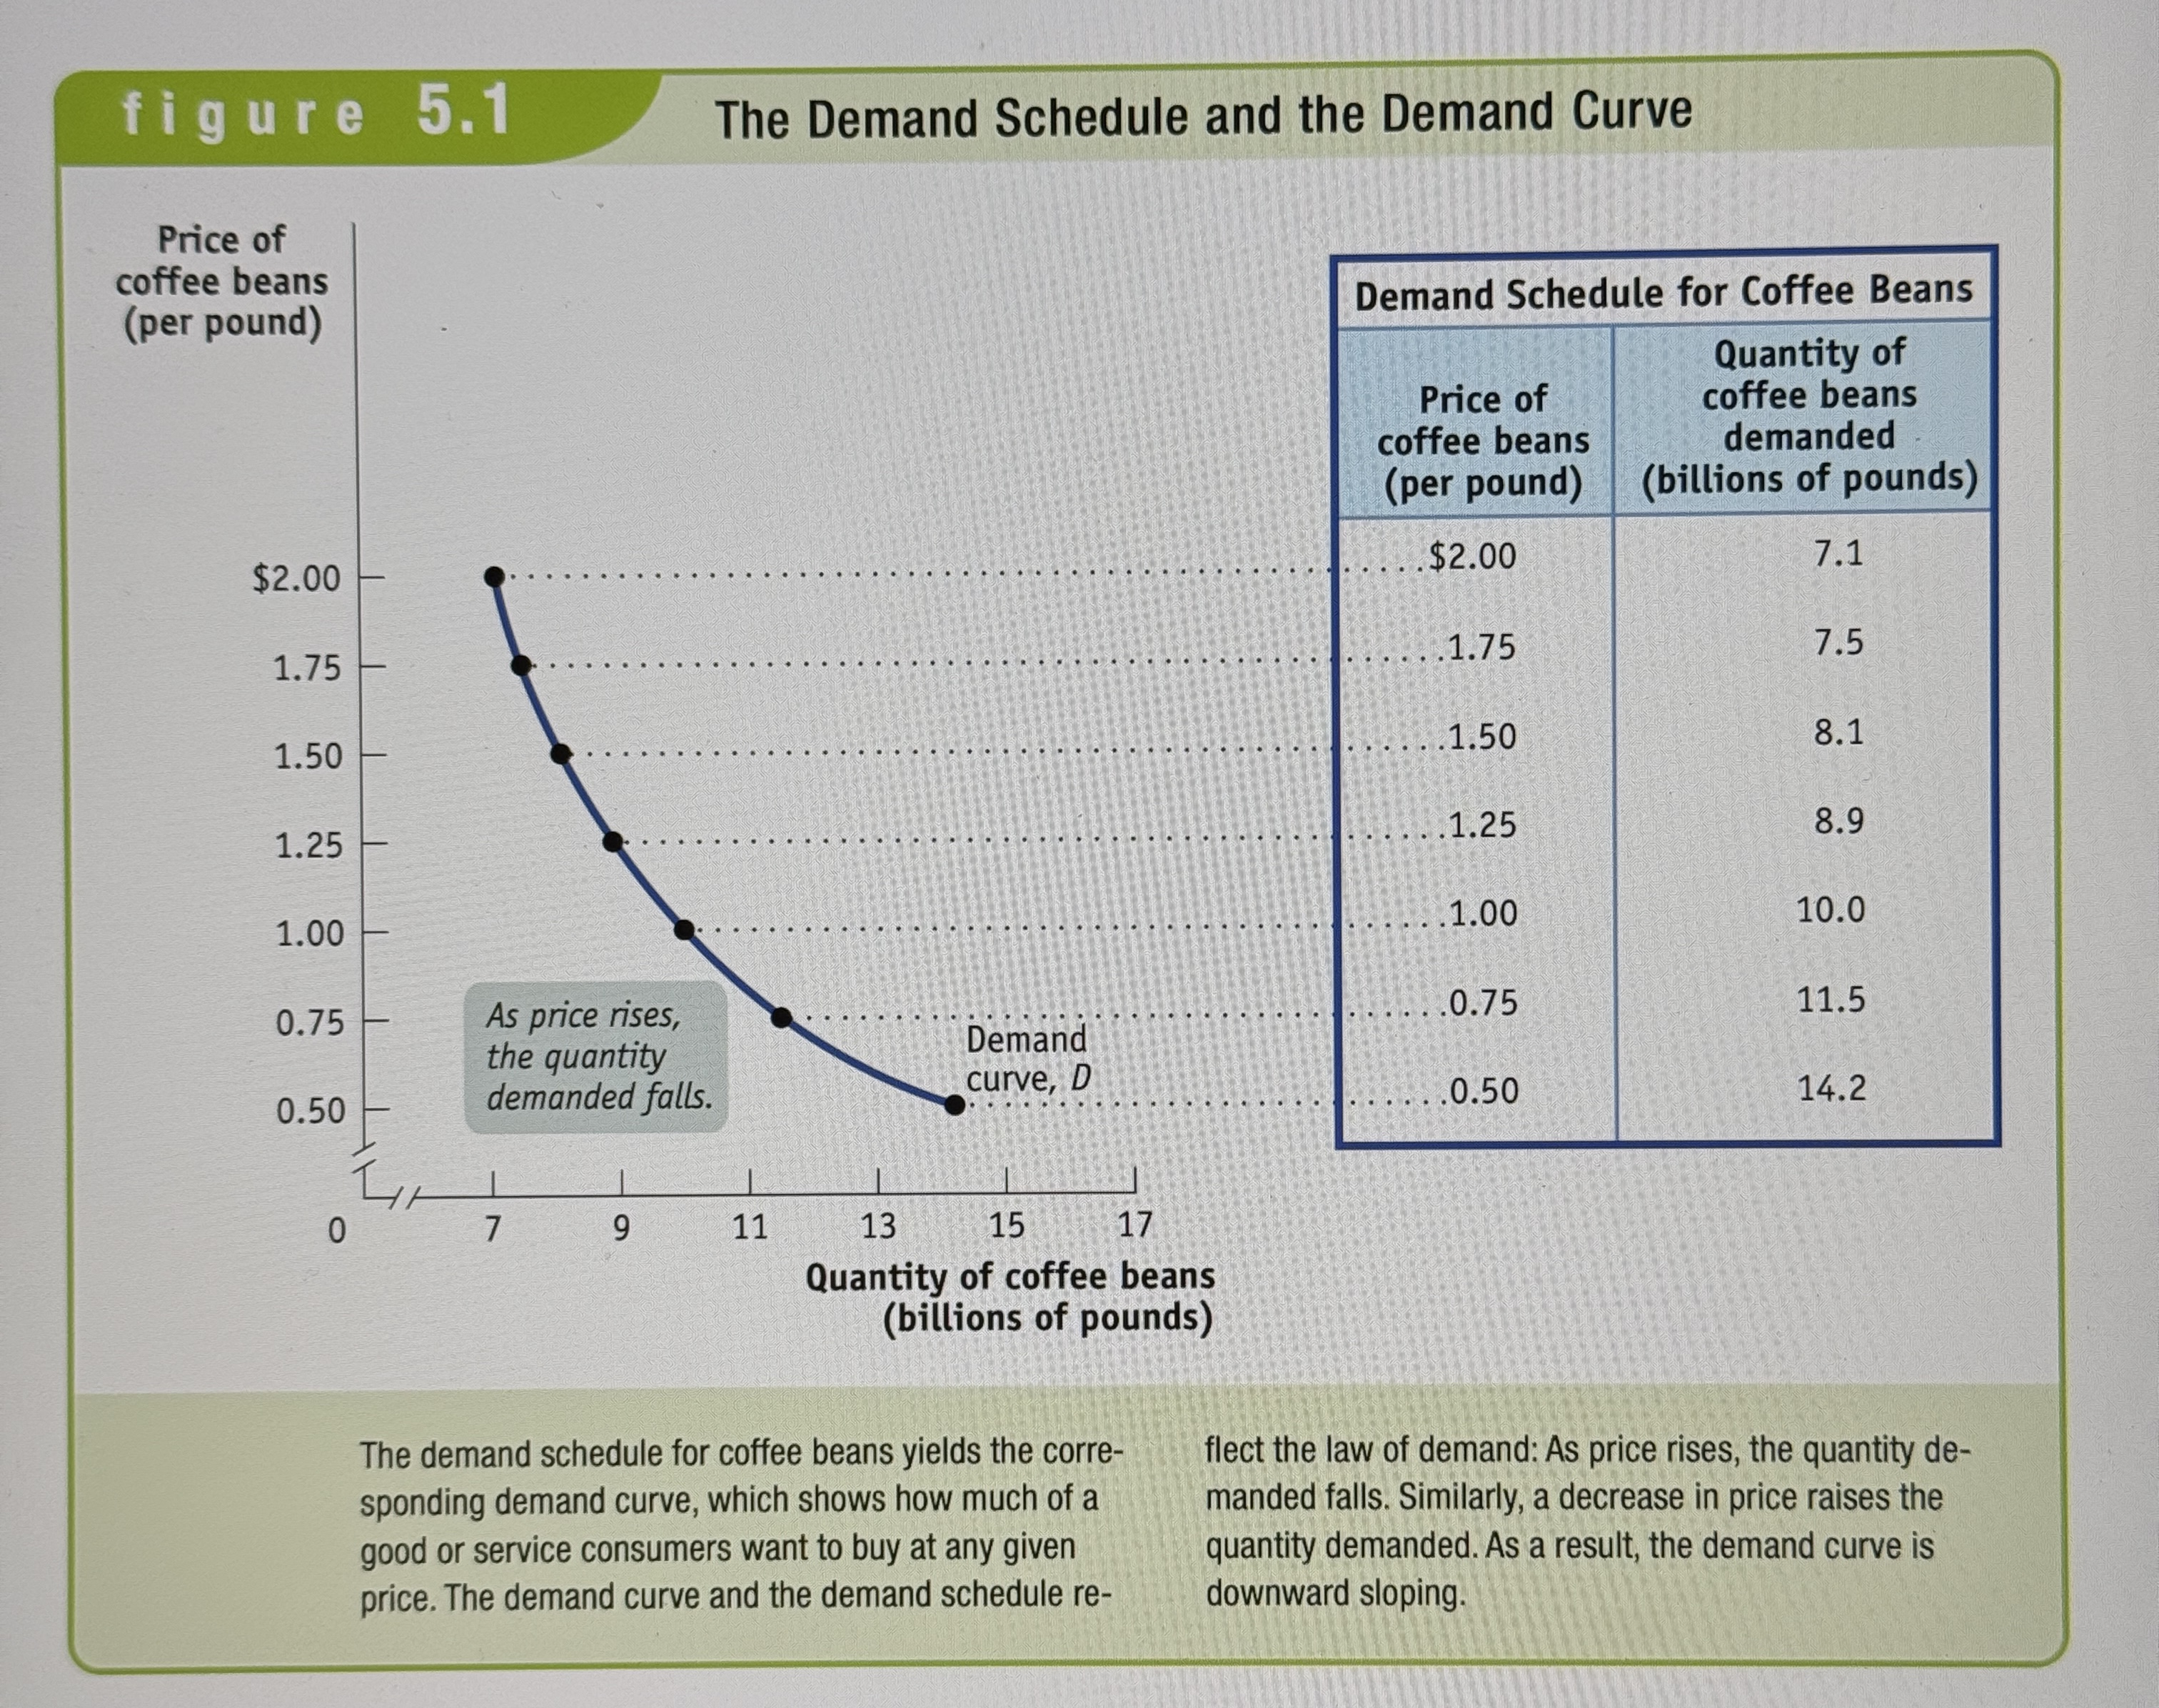
Law of Demand
States that a higher price for a good or service, all other things being equal, leads people to demand a smaller quantity of that good or service.
An Increase in Demand Graph
Ex.
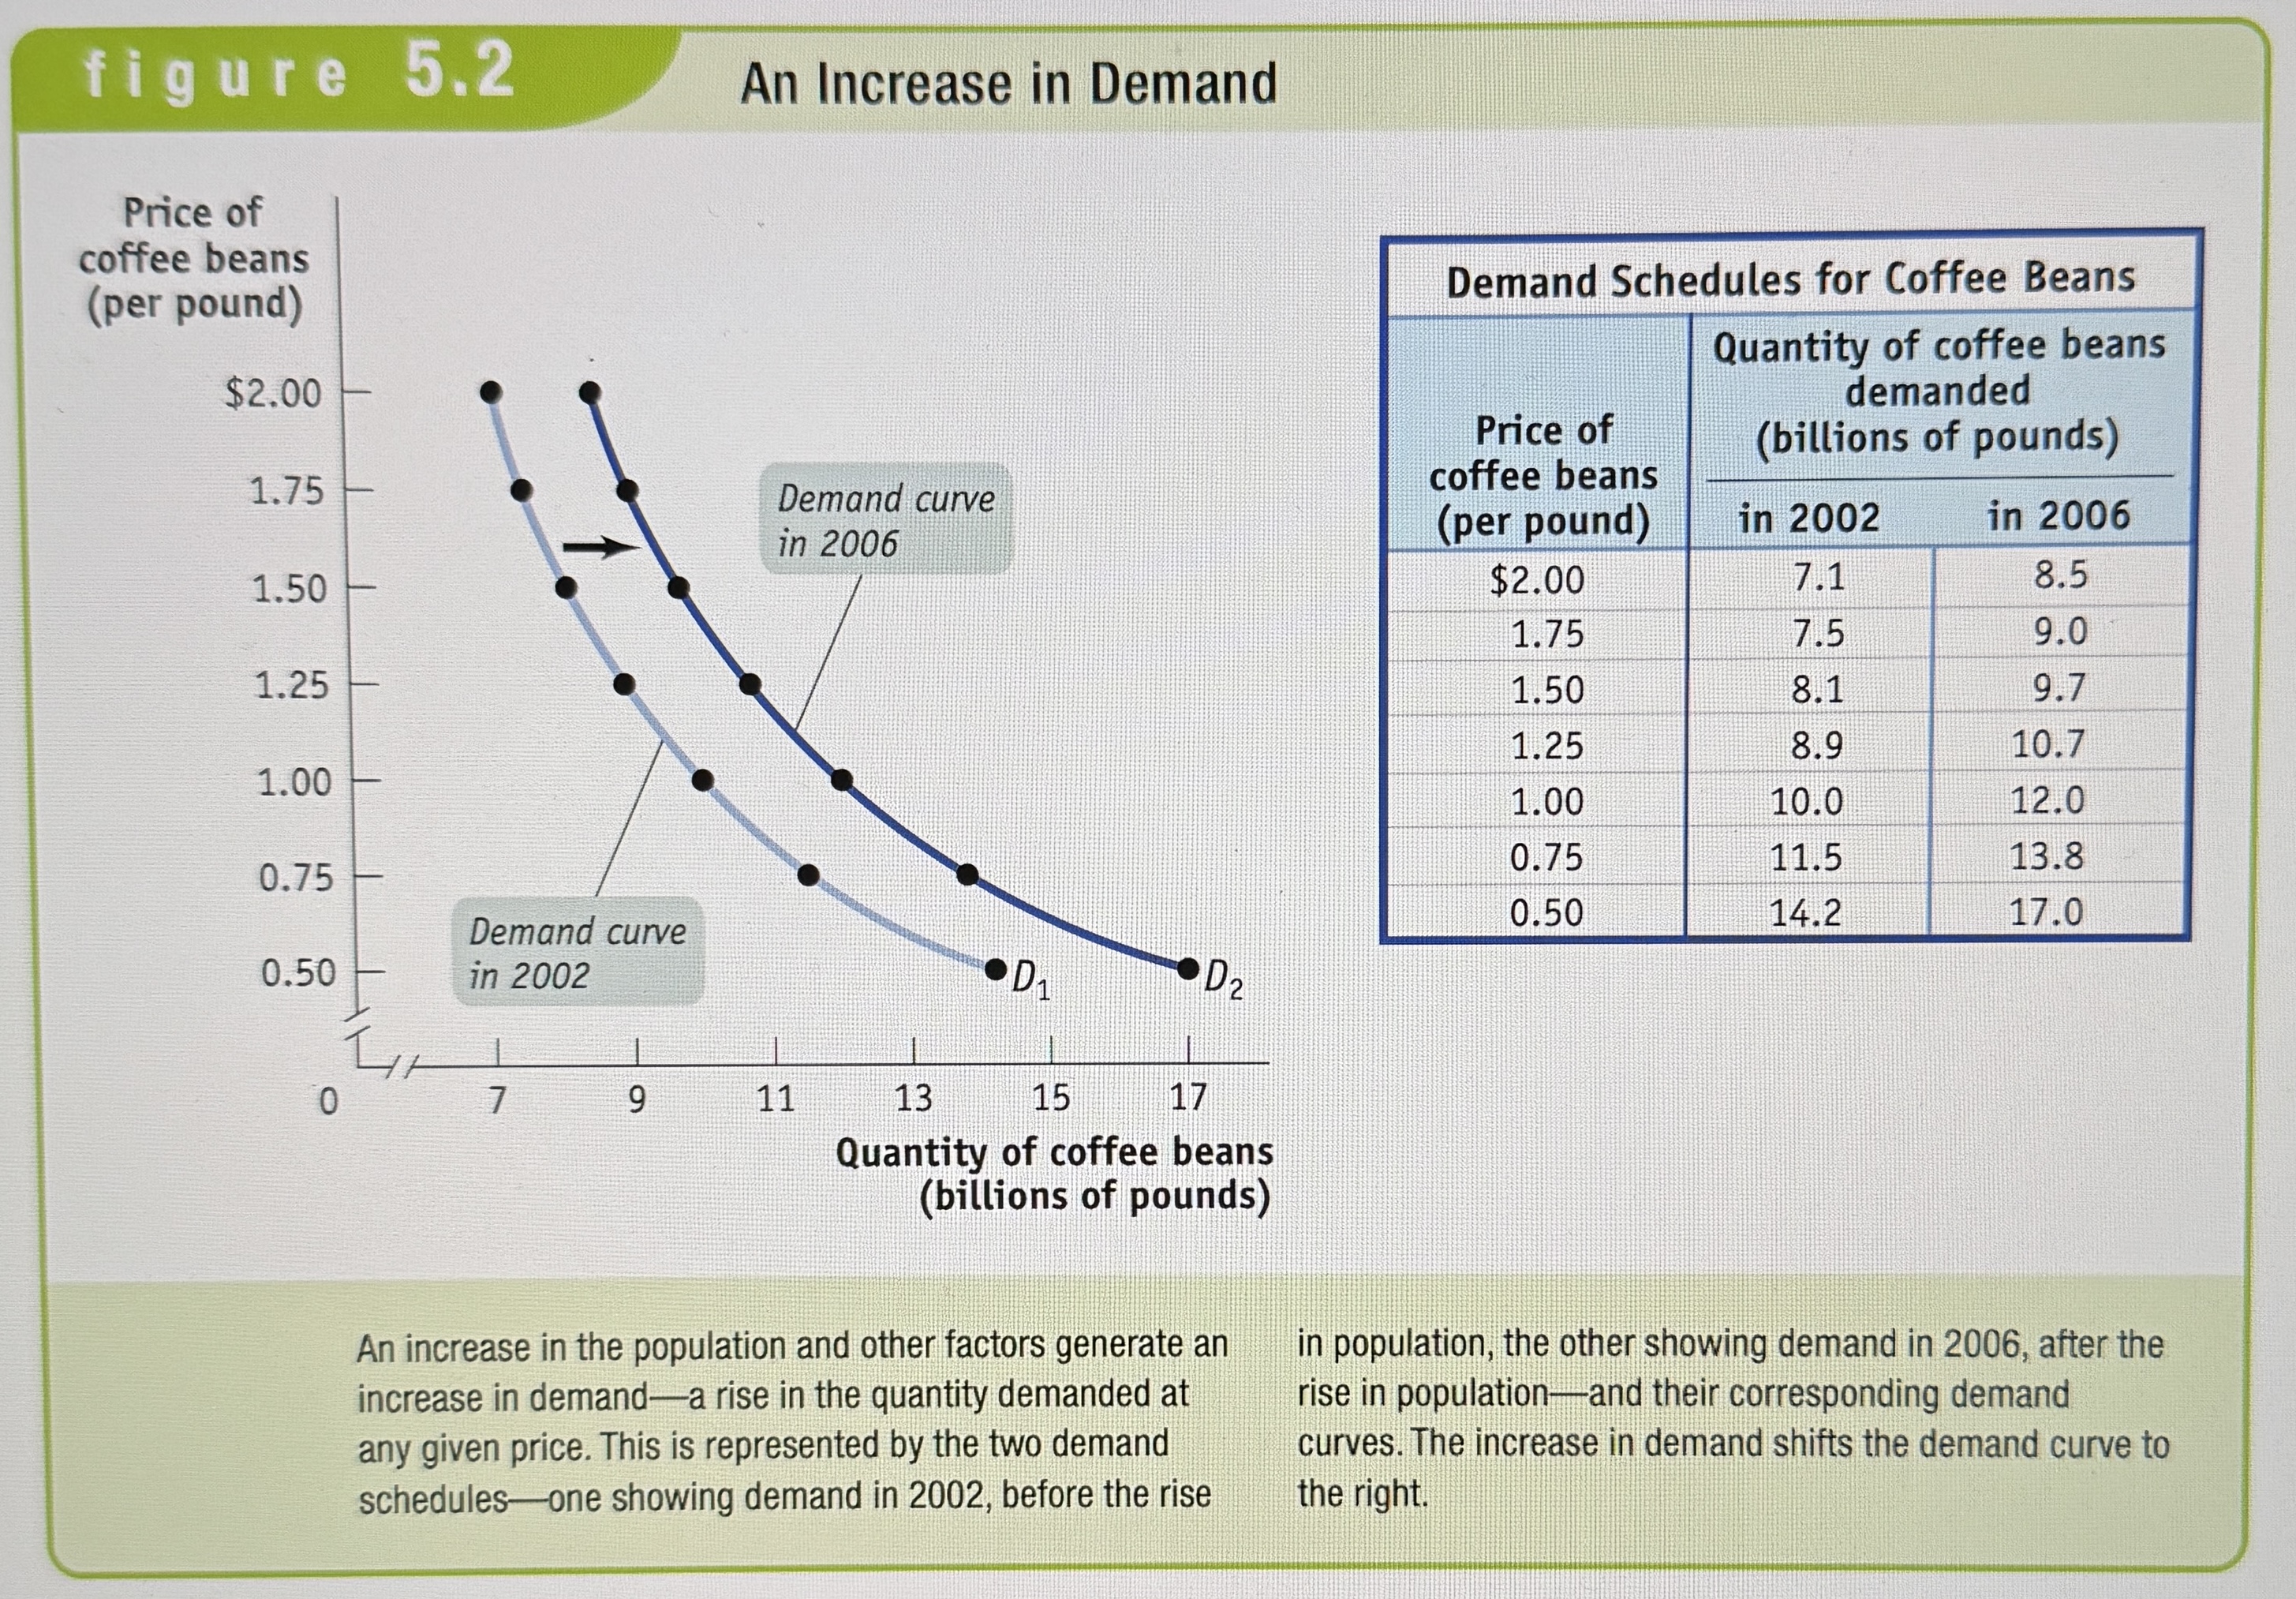
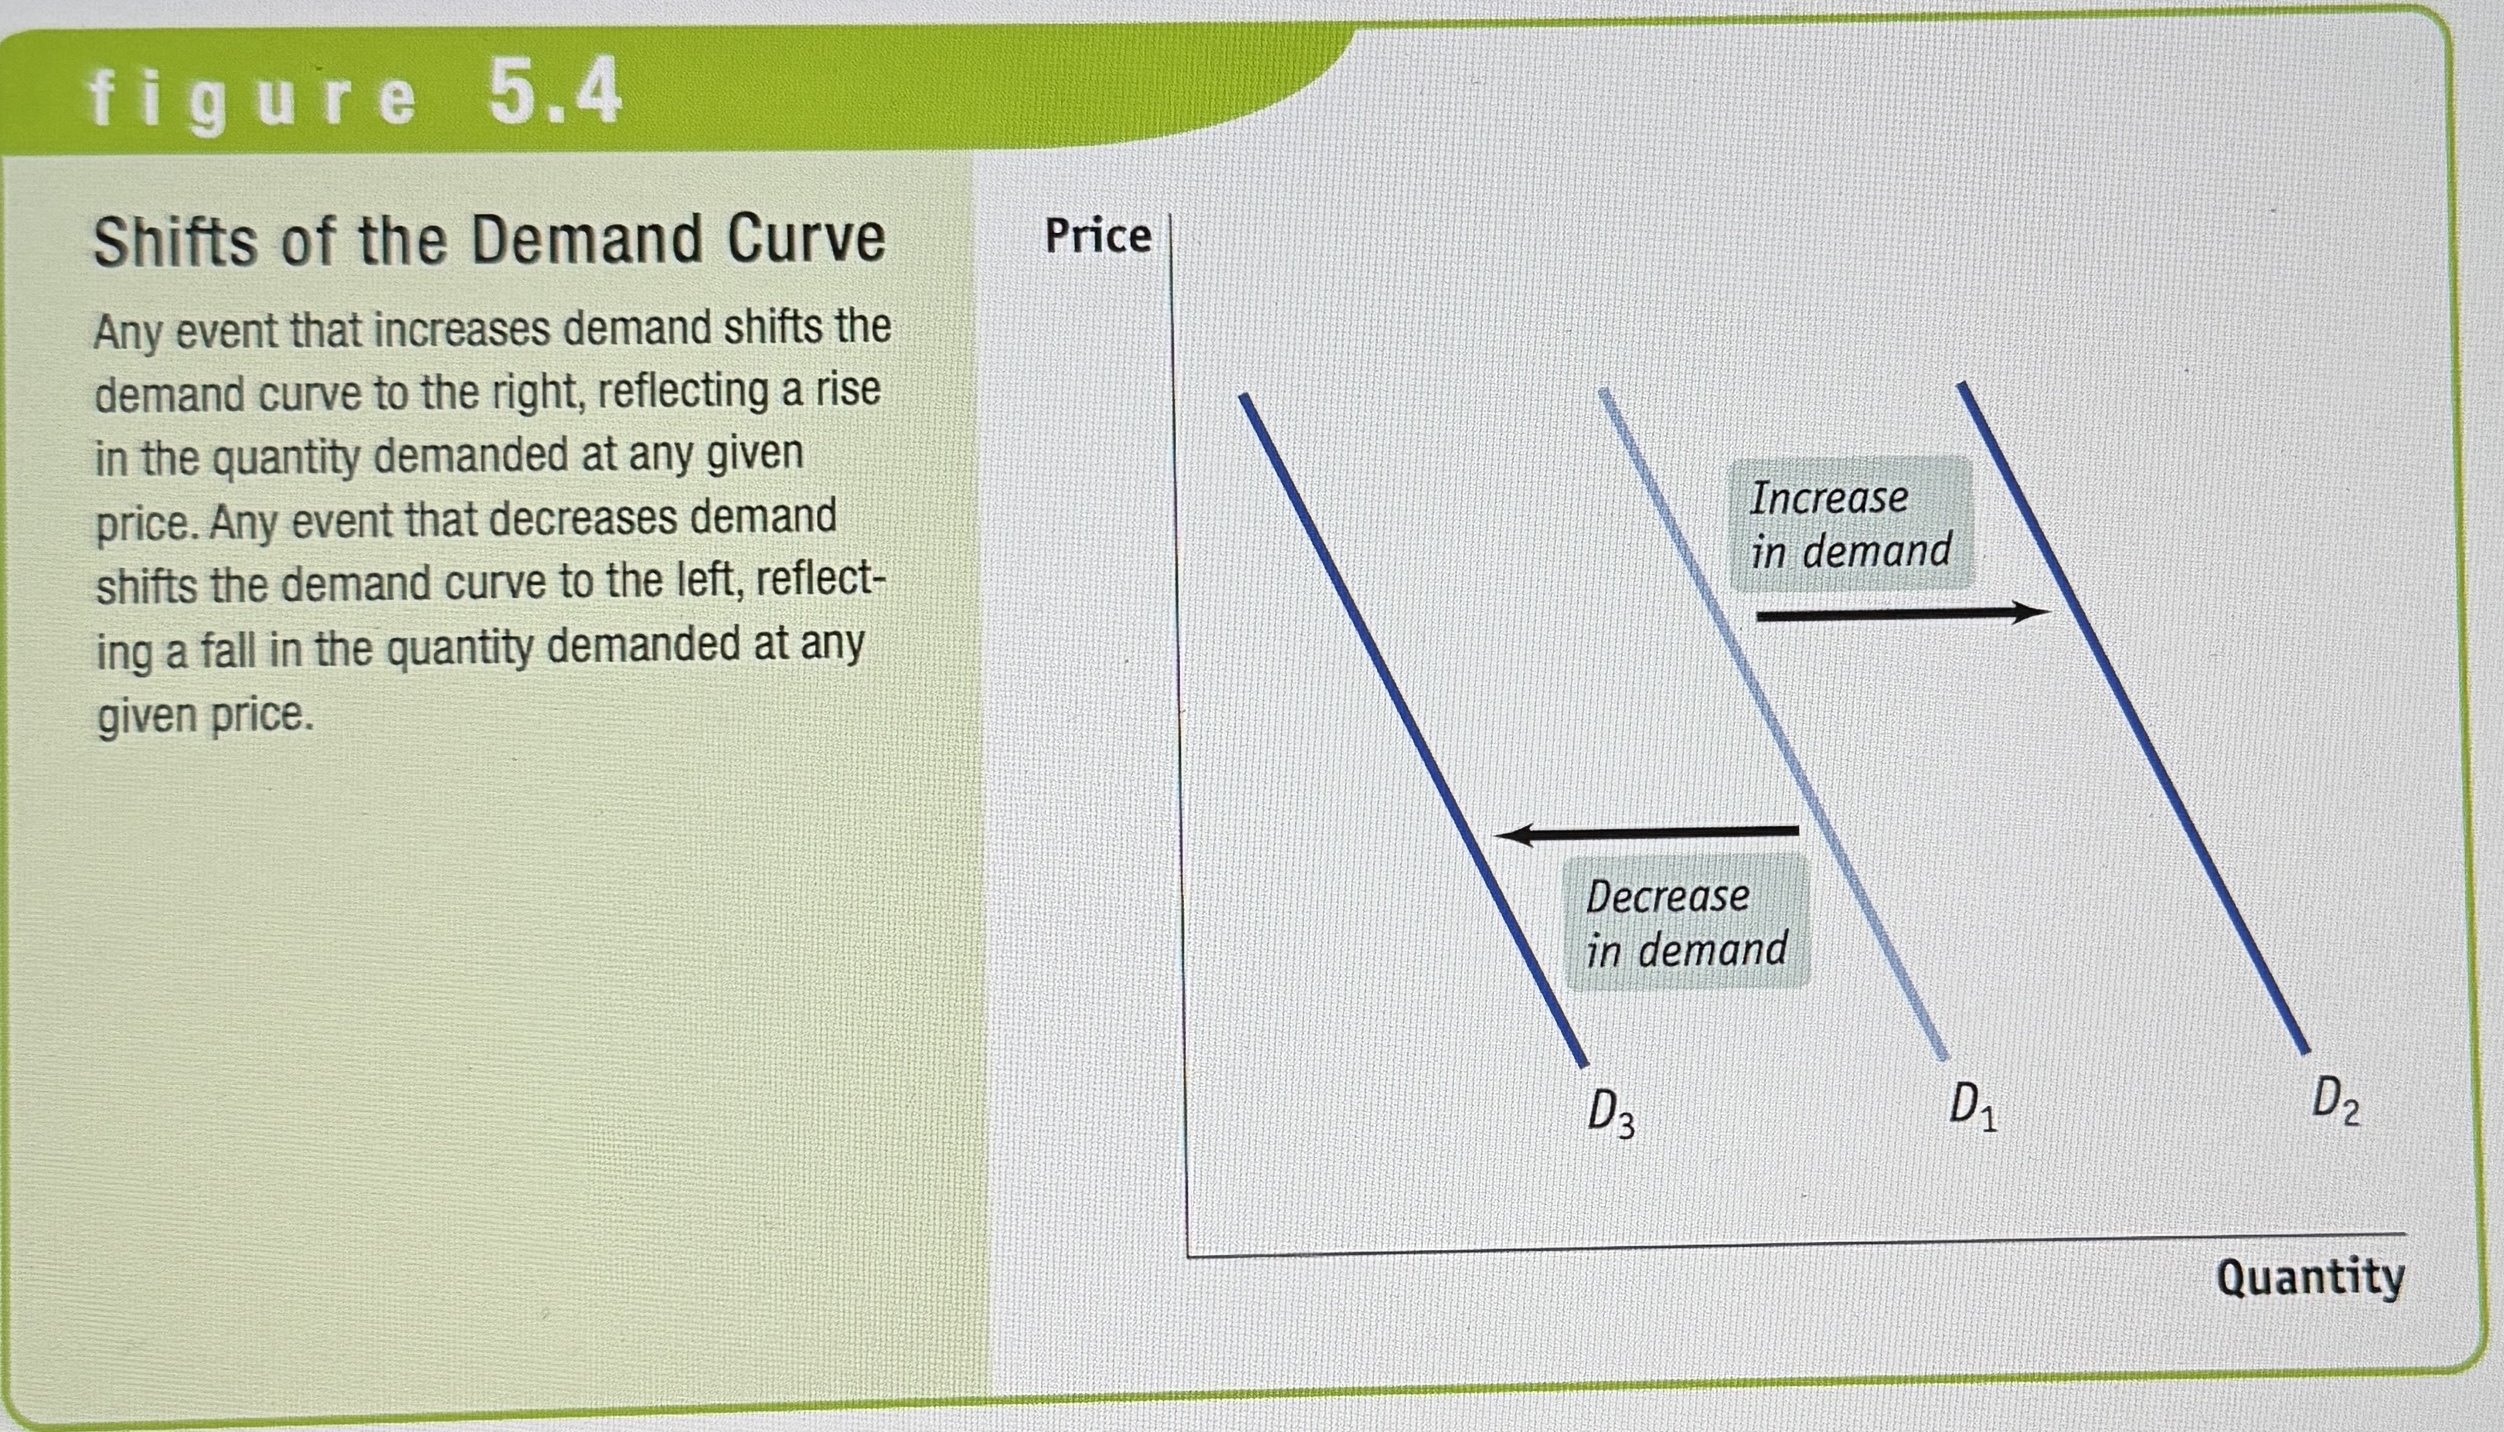
A change in demand
A shift of the demand curve, which changes the quantity demanded at any given price.
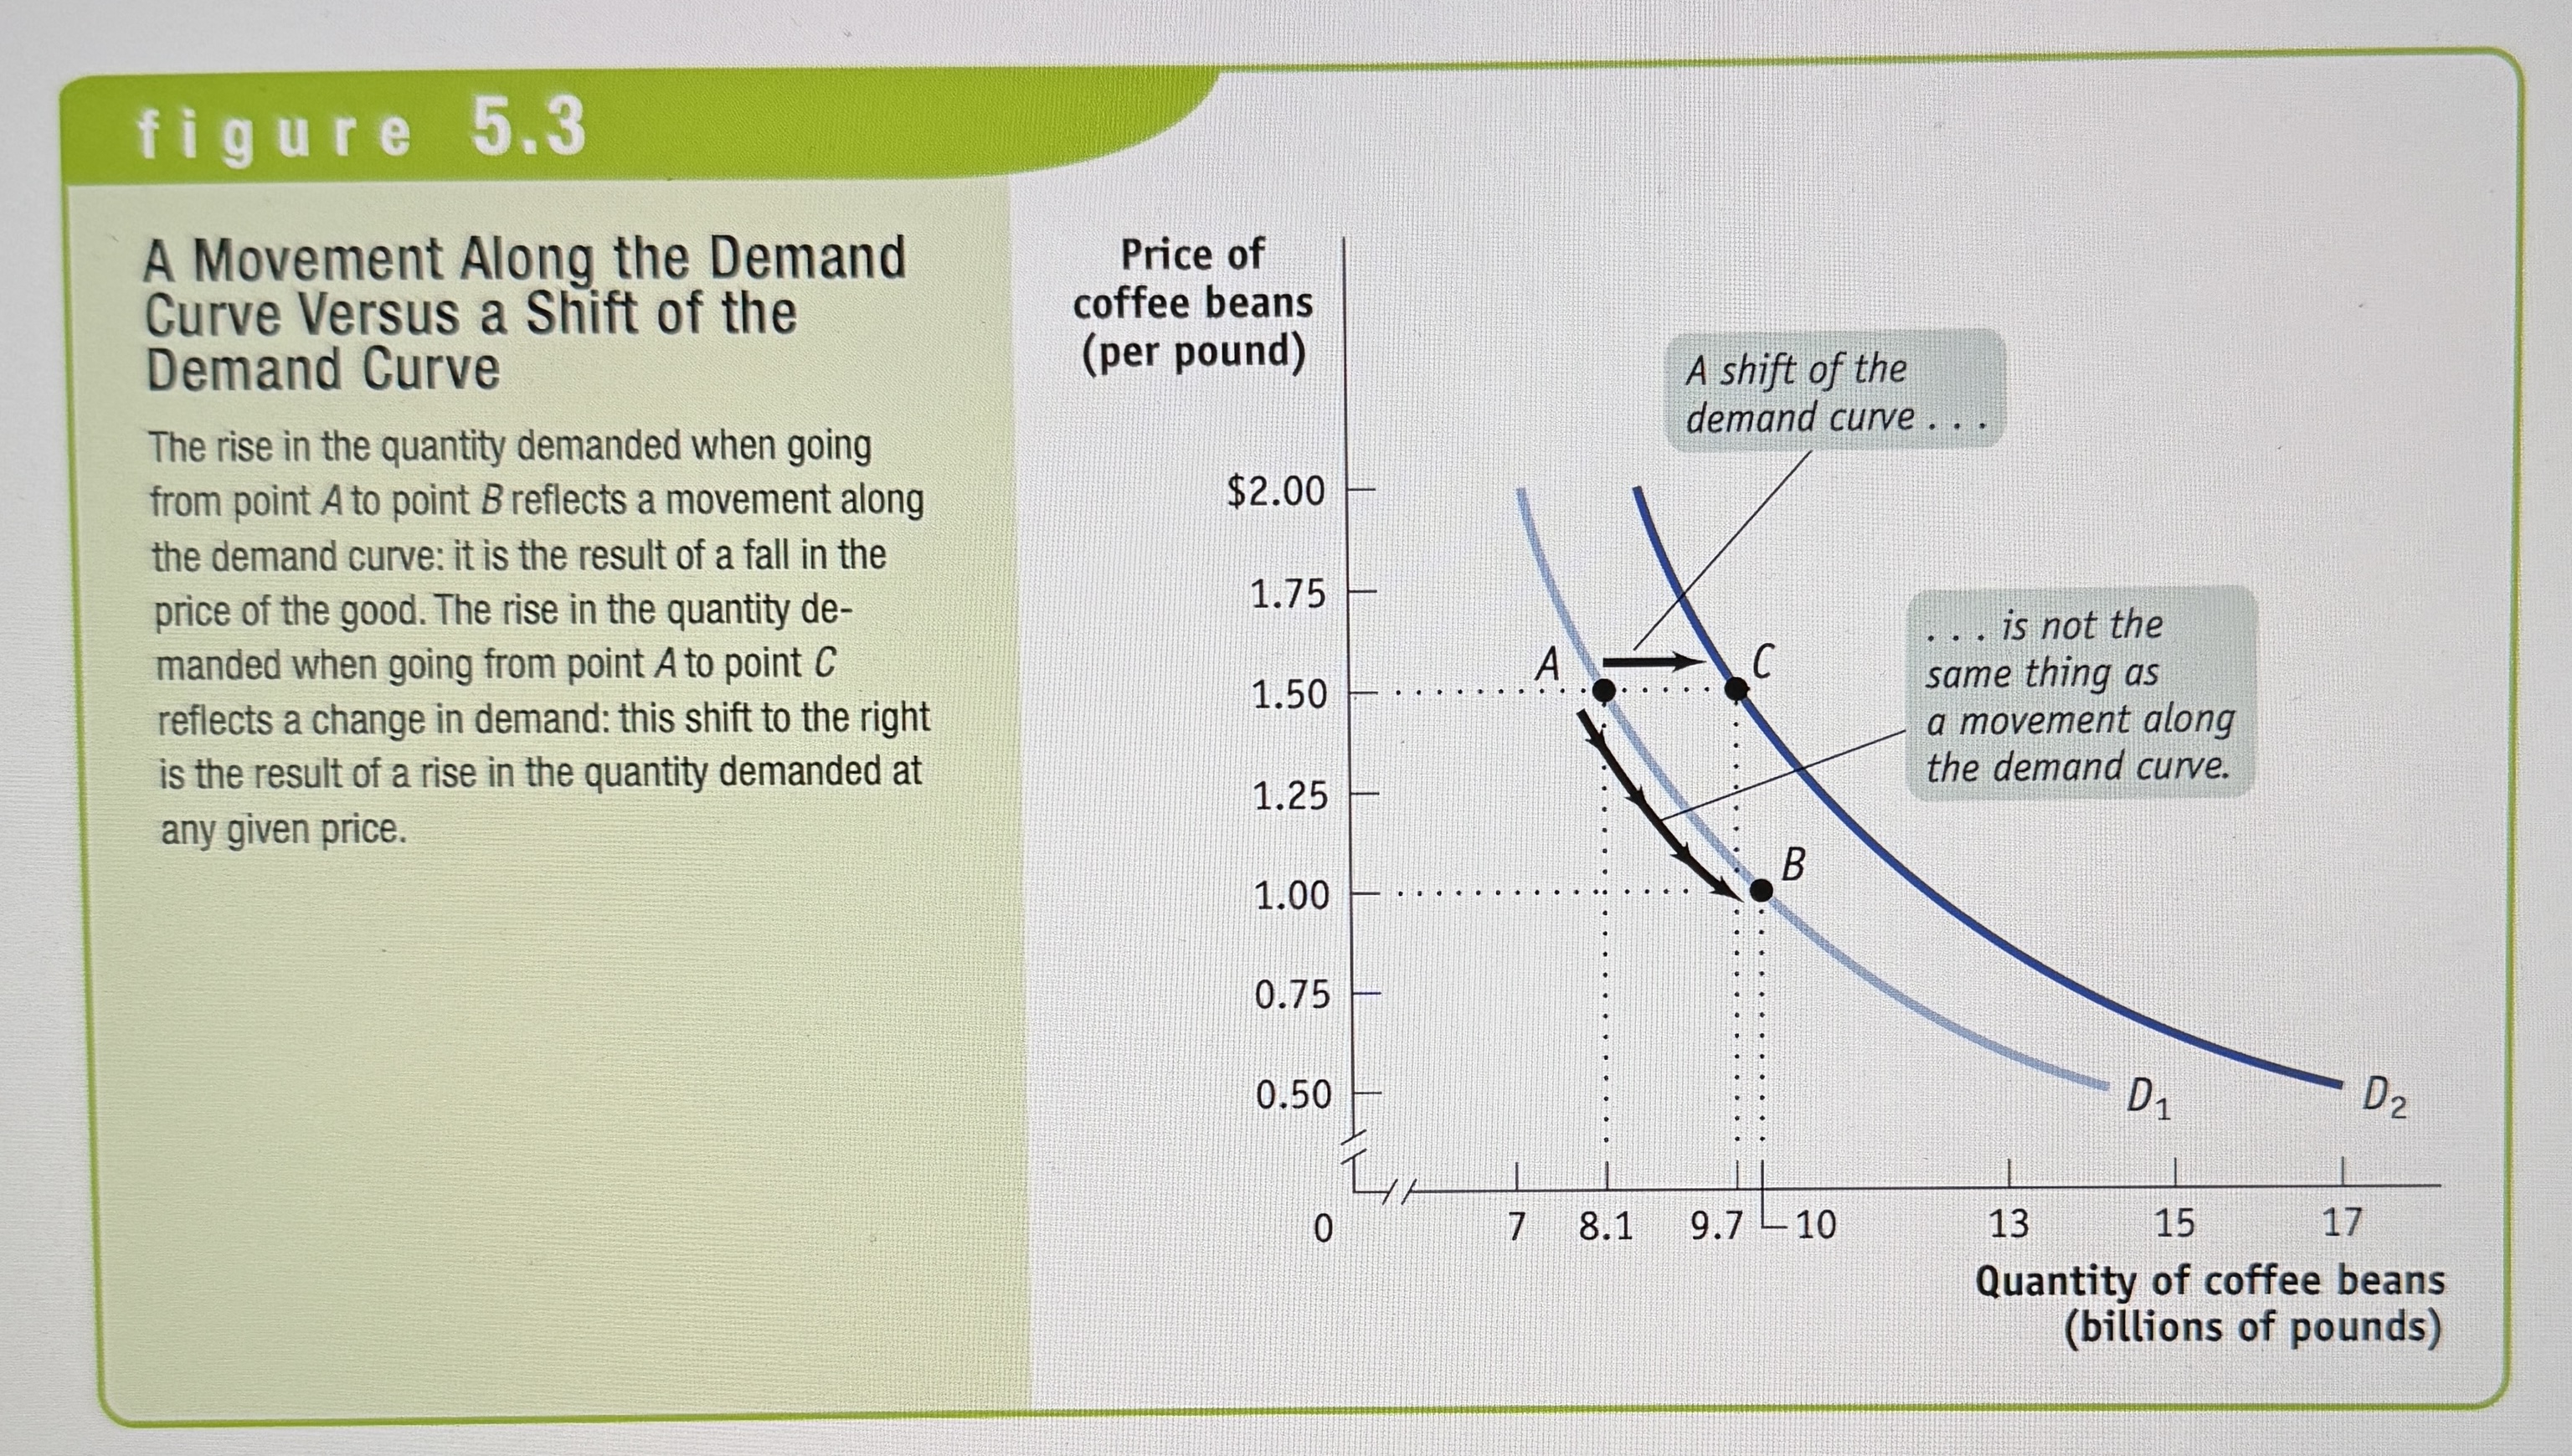
Movement along the demand curve
A change in the quantity demanded of a good that is the result of a change in that goods price.
Types of movement on the demand curve Graph
Ex.
Understanding shifts on the Demand Curve
Ex.
What five factors shift the demand curve?
Changes in the prices of related goods or services
Changes in income
Changes in taste
Changes in expectations
Changes in the number of consumers
Changes in the Price of Related Goods and Services
Substitute - Goods that people flock to if the other is too expensive. If a rise in the price of one results in a higher demand for the other.
Complement - Goods that make sense together. The rise in the price of one results in people demanding less of the other.
Changes in Income
When a rise in income increases the demand for a good it’s said to be a normal good.
When a rise in income decreases the demand for a good it’s said to be an inferior good.
Changes in Taste
If people begin to like something more, the demand for that good will increase.
Changes in Expectations
If a sale is going to happen in a week, demand may drop now.
Or
If prices are expected to rise in a week. Demand may increase now.
Changes in the Number of Consumers
An increase in the amount of people able to buy a service increases its demand.
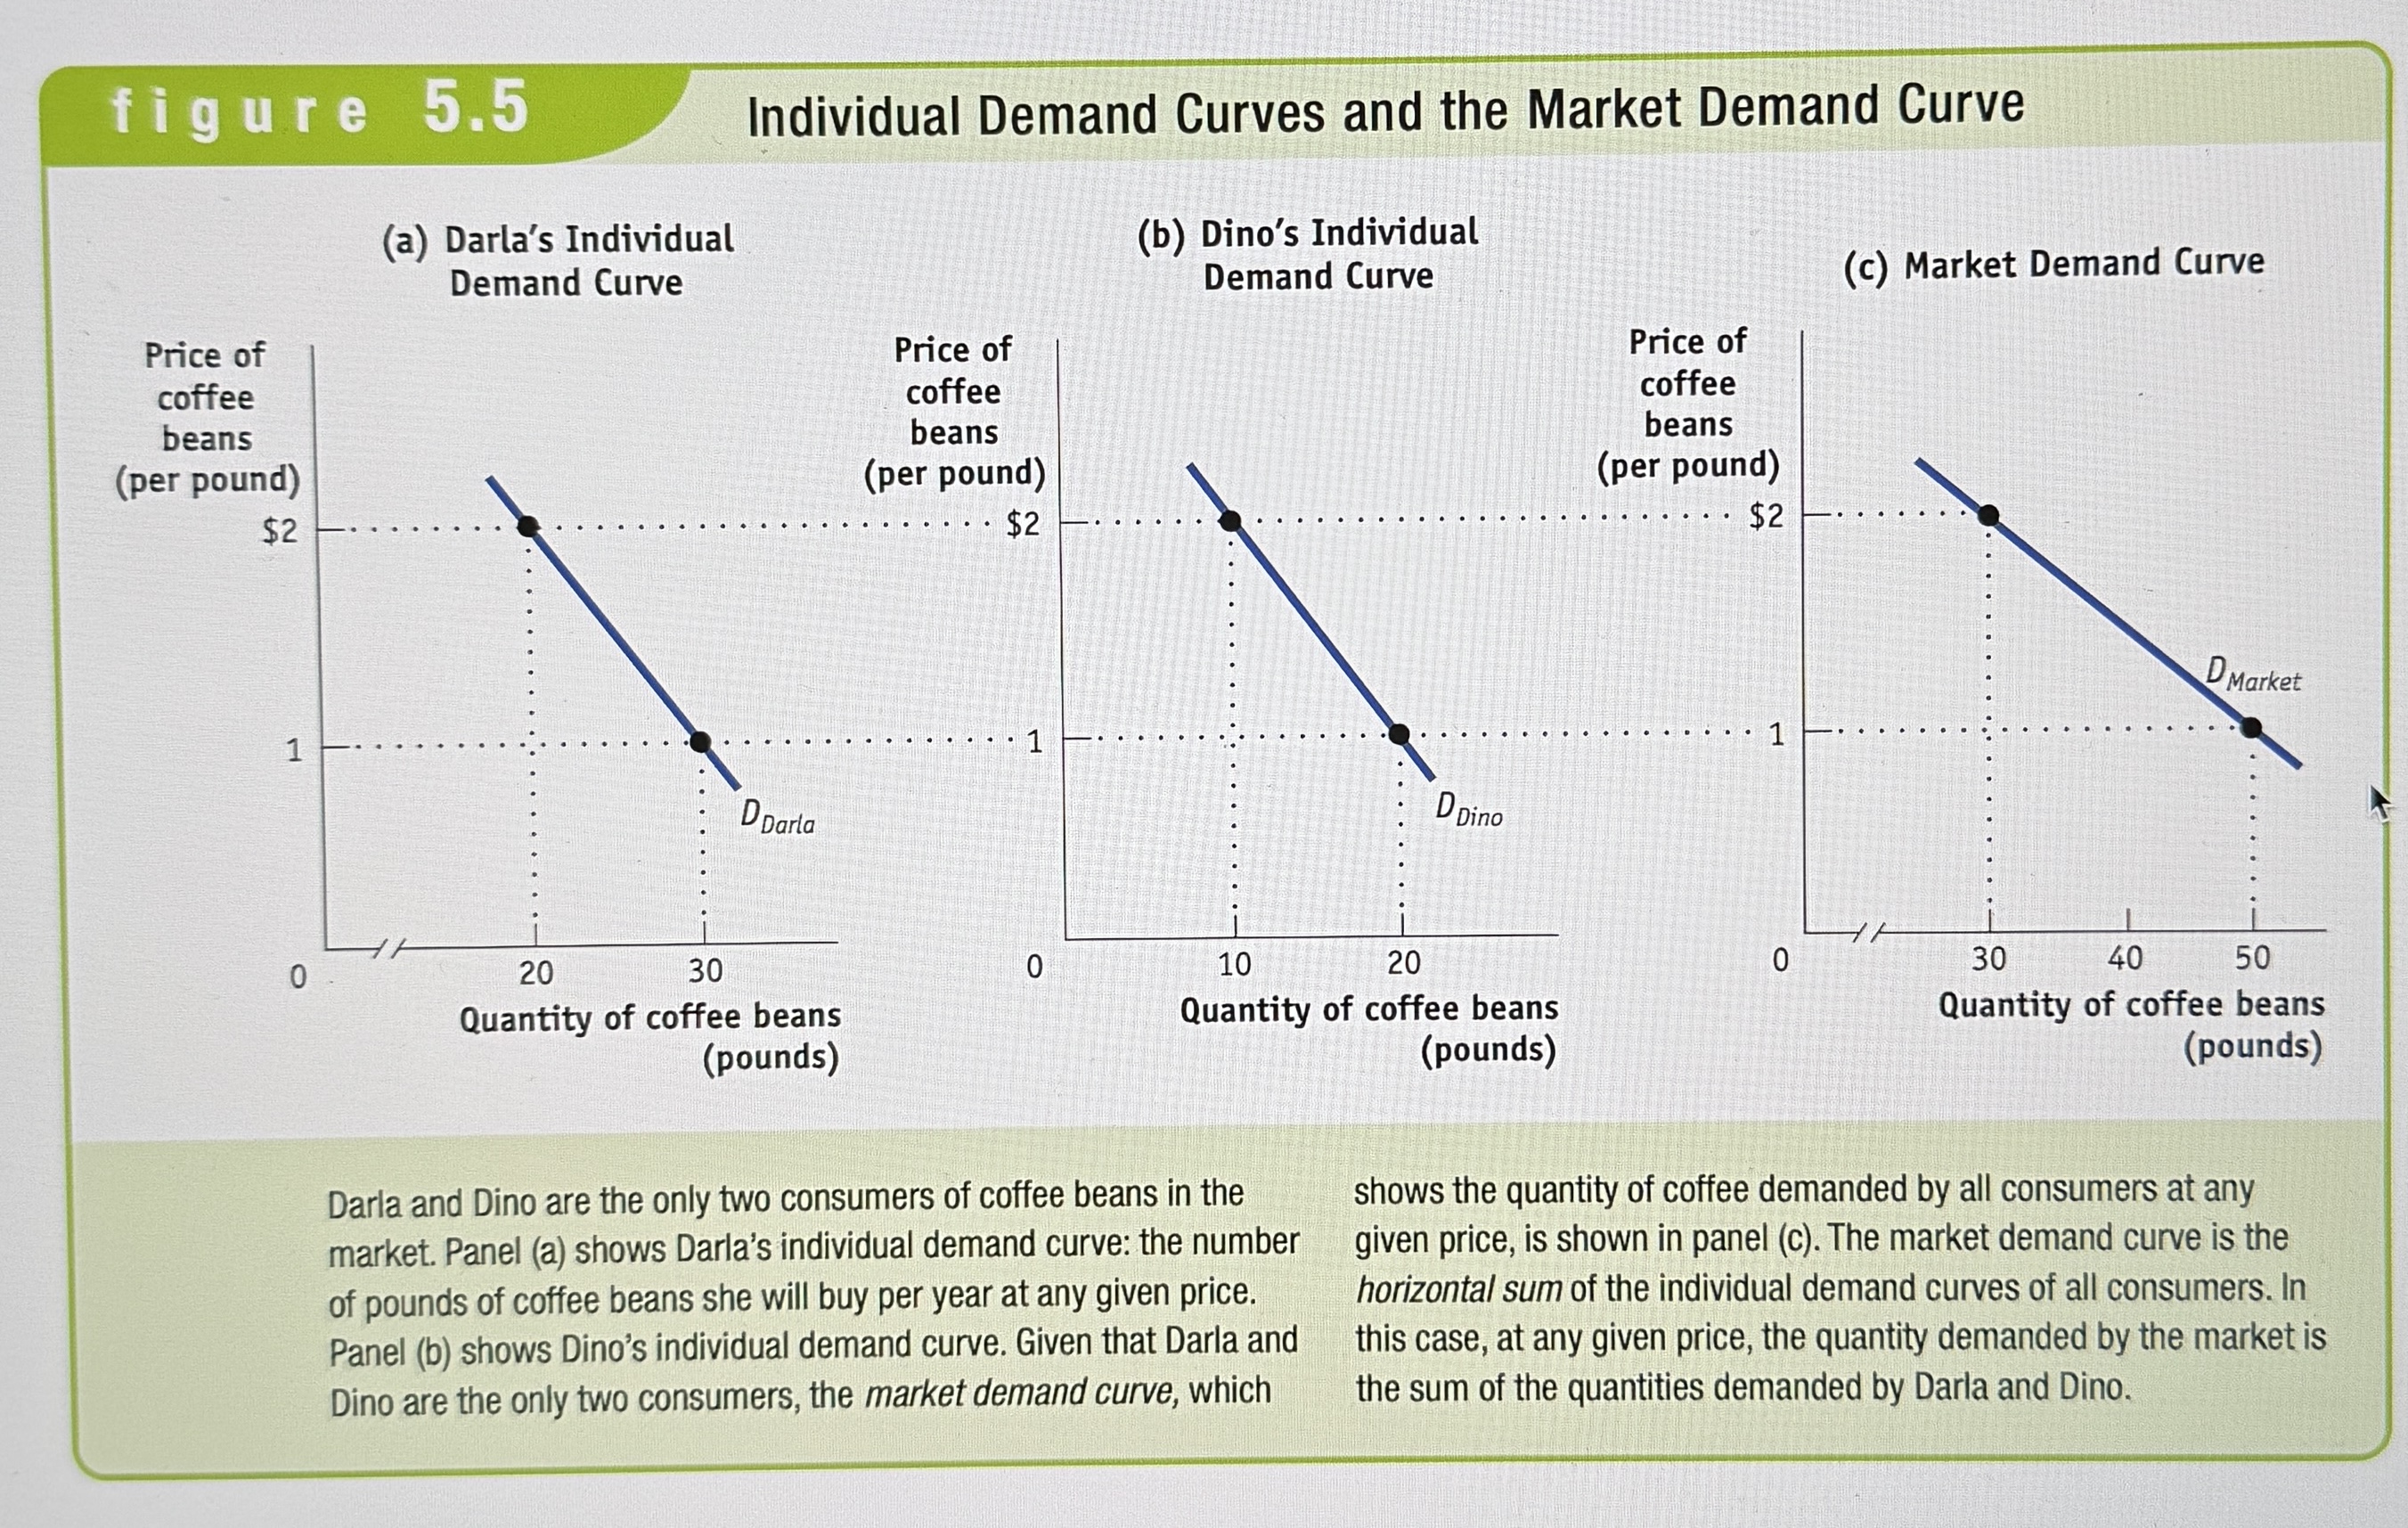
Individual Demand Curve
Shows the relationship between quantity demanded and price for an individual consumer.
Quantity Supplied
The actual amount of a good or service producers are willing to sell at some specific price.
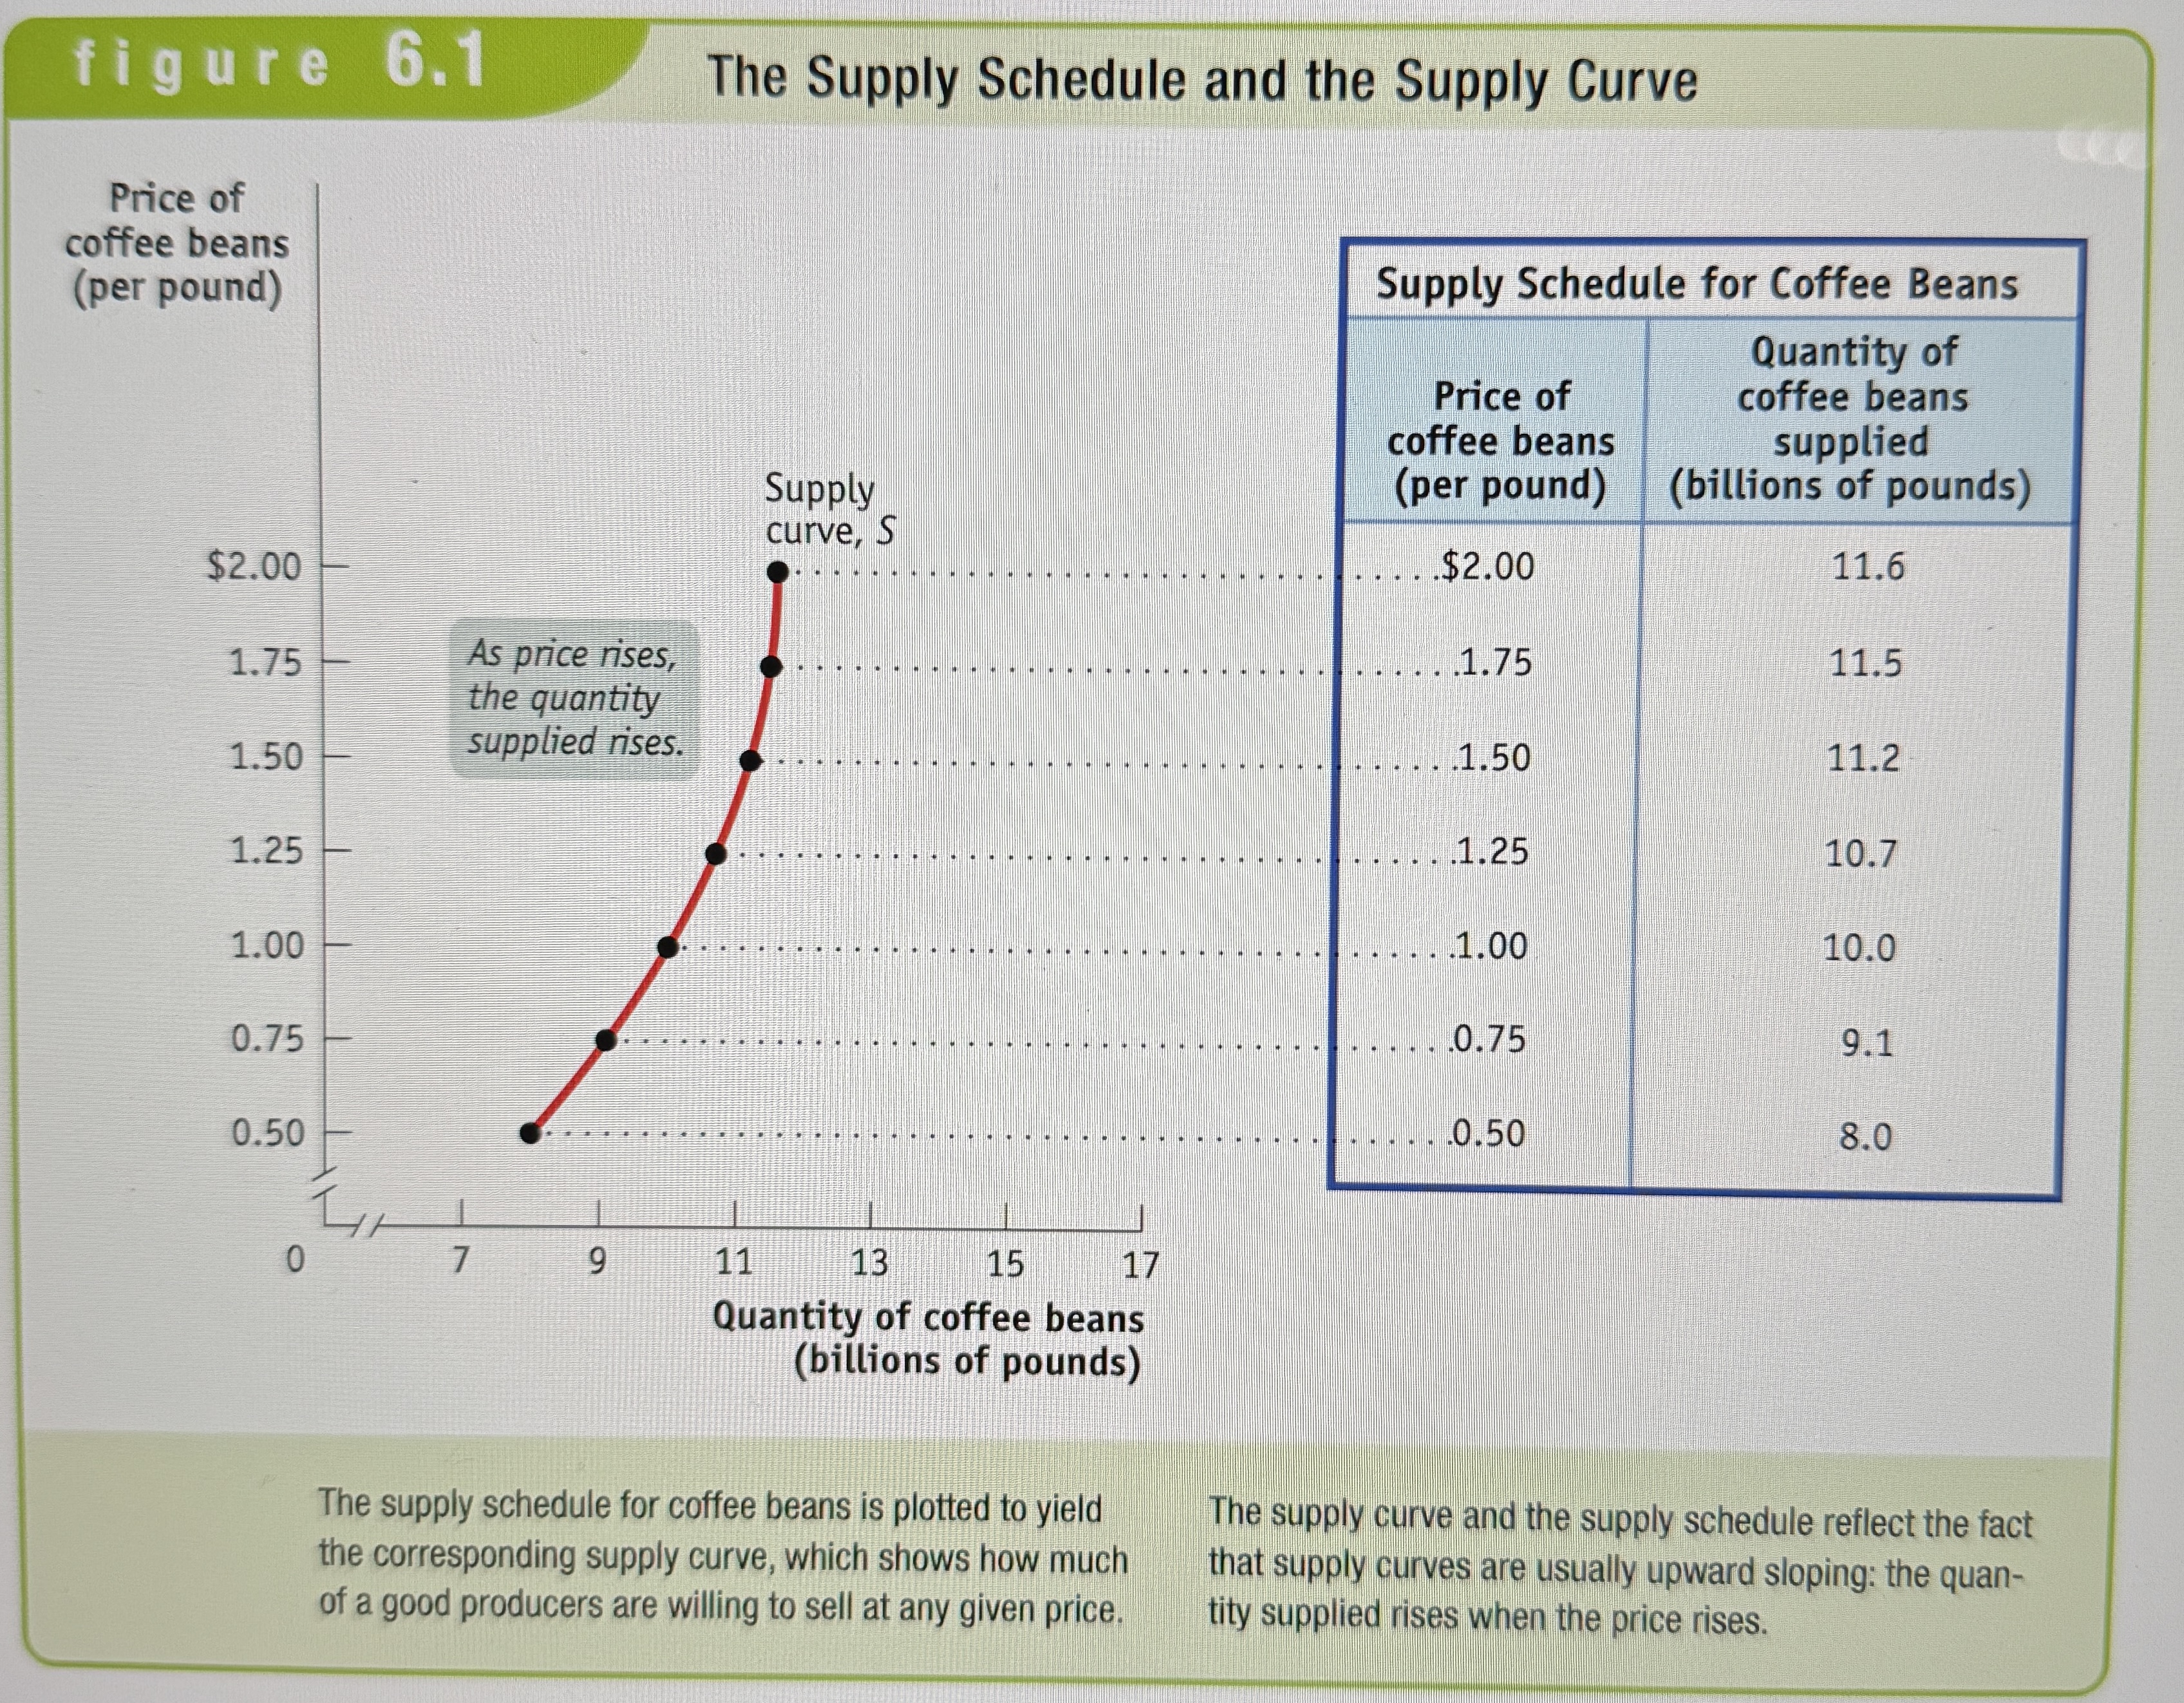
Supply Schedual
Shows how much of a good or service producers will supply at different prices.
Supply Curve
Shows the relationship between quantity supplied and price.
The Supply Curve Graph
Ex.
Law of Supply
Says that ,other things being equal, the price and quantity supplied of a good are positively related.
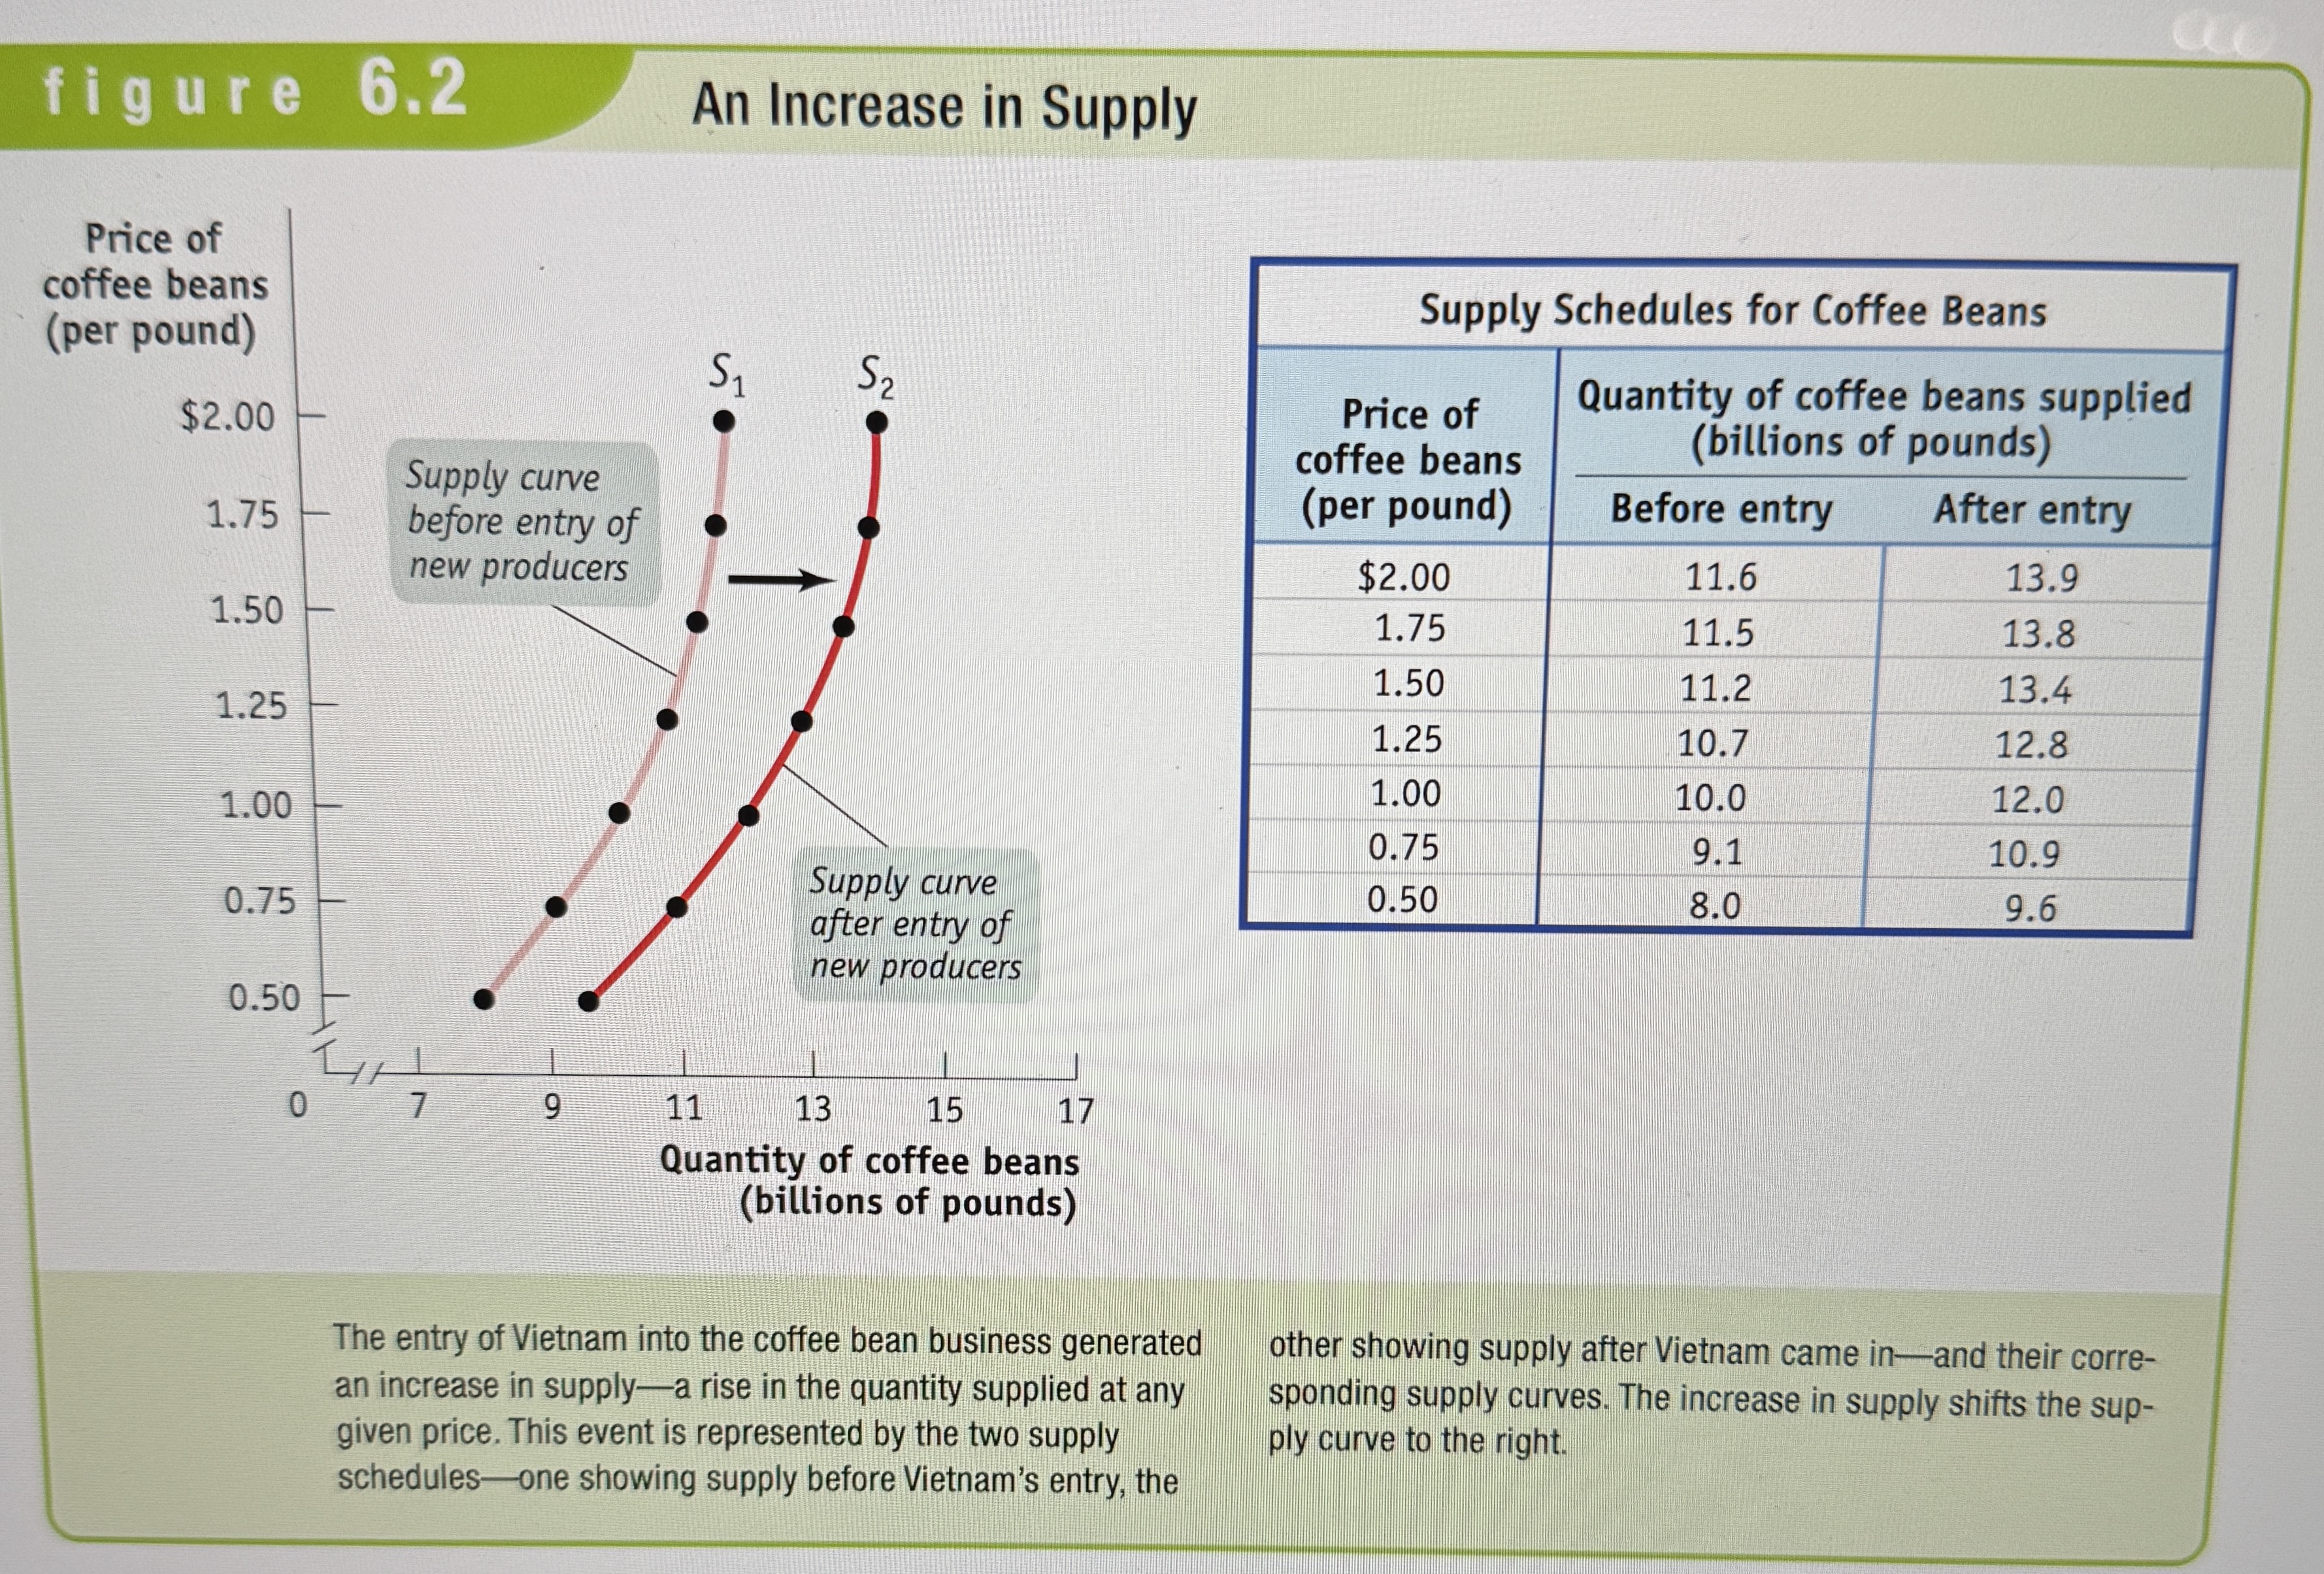
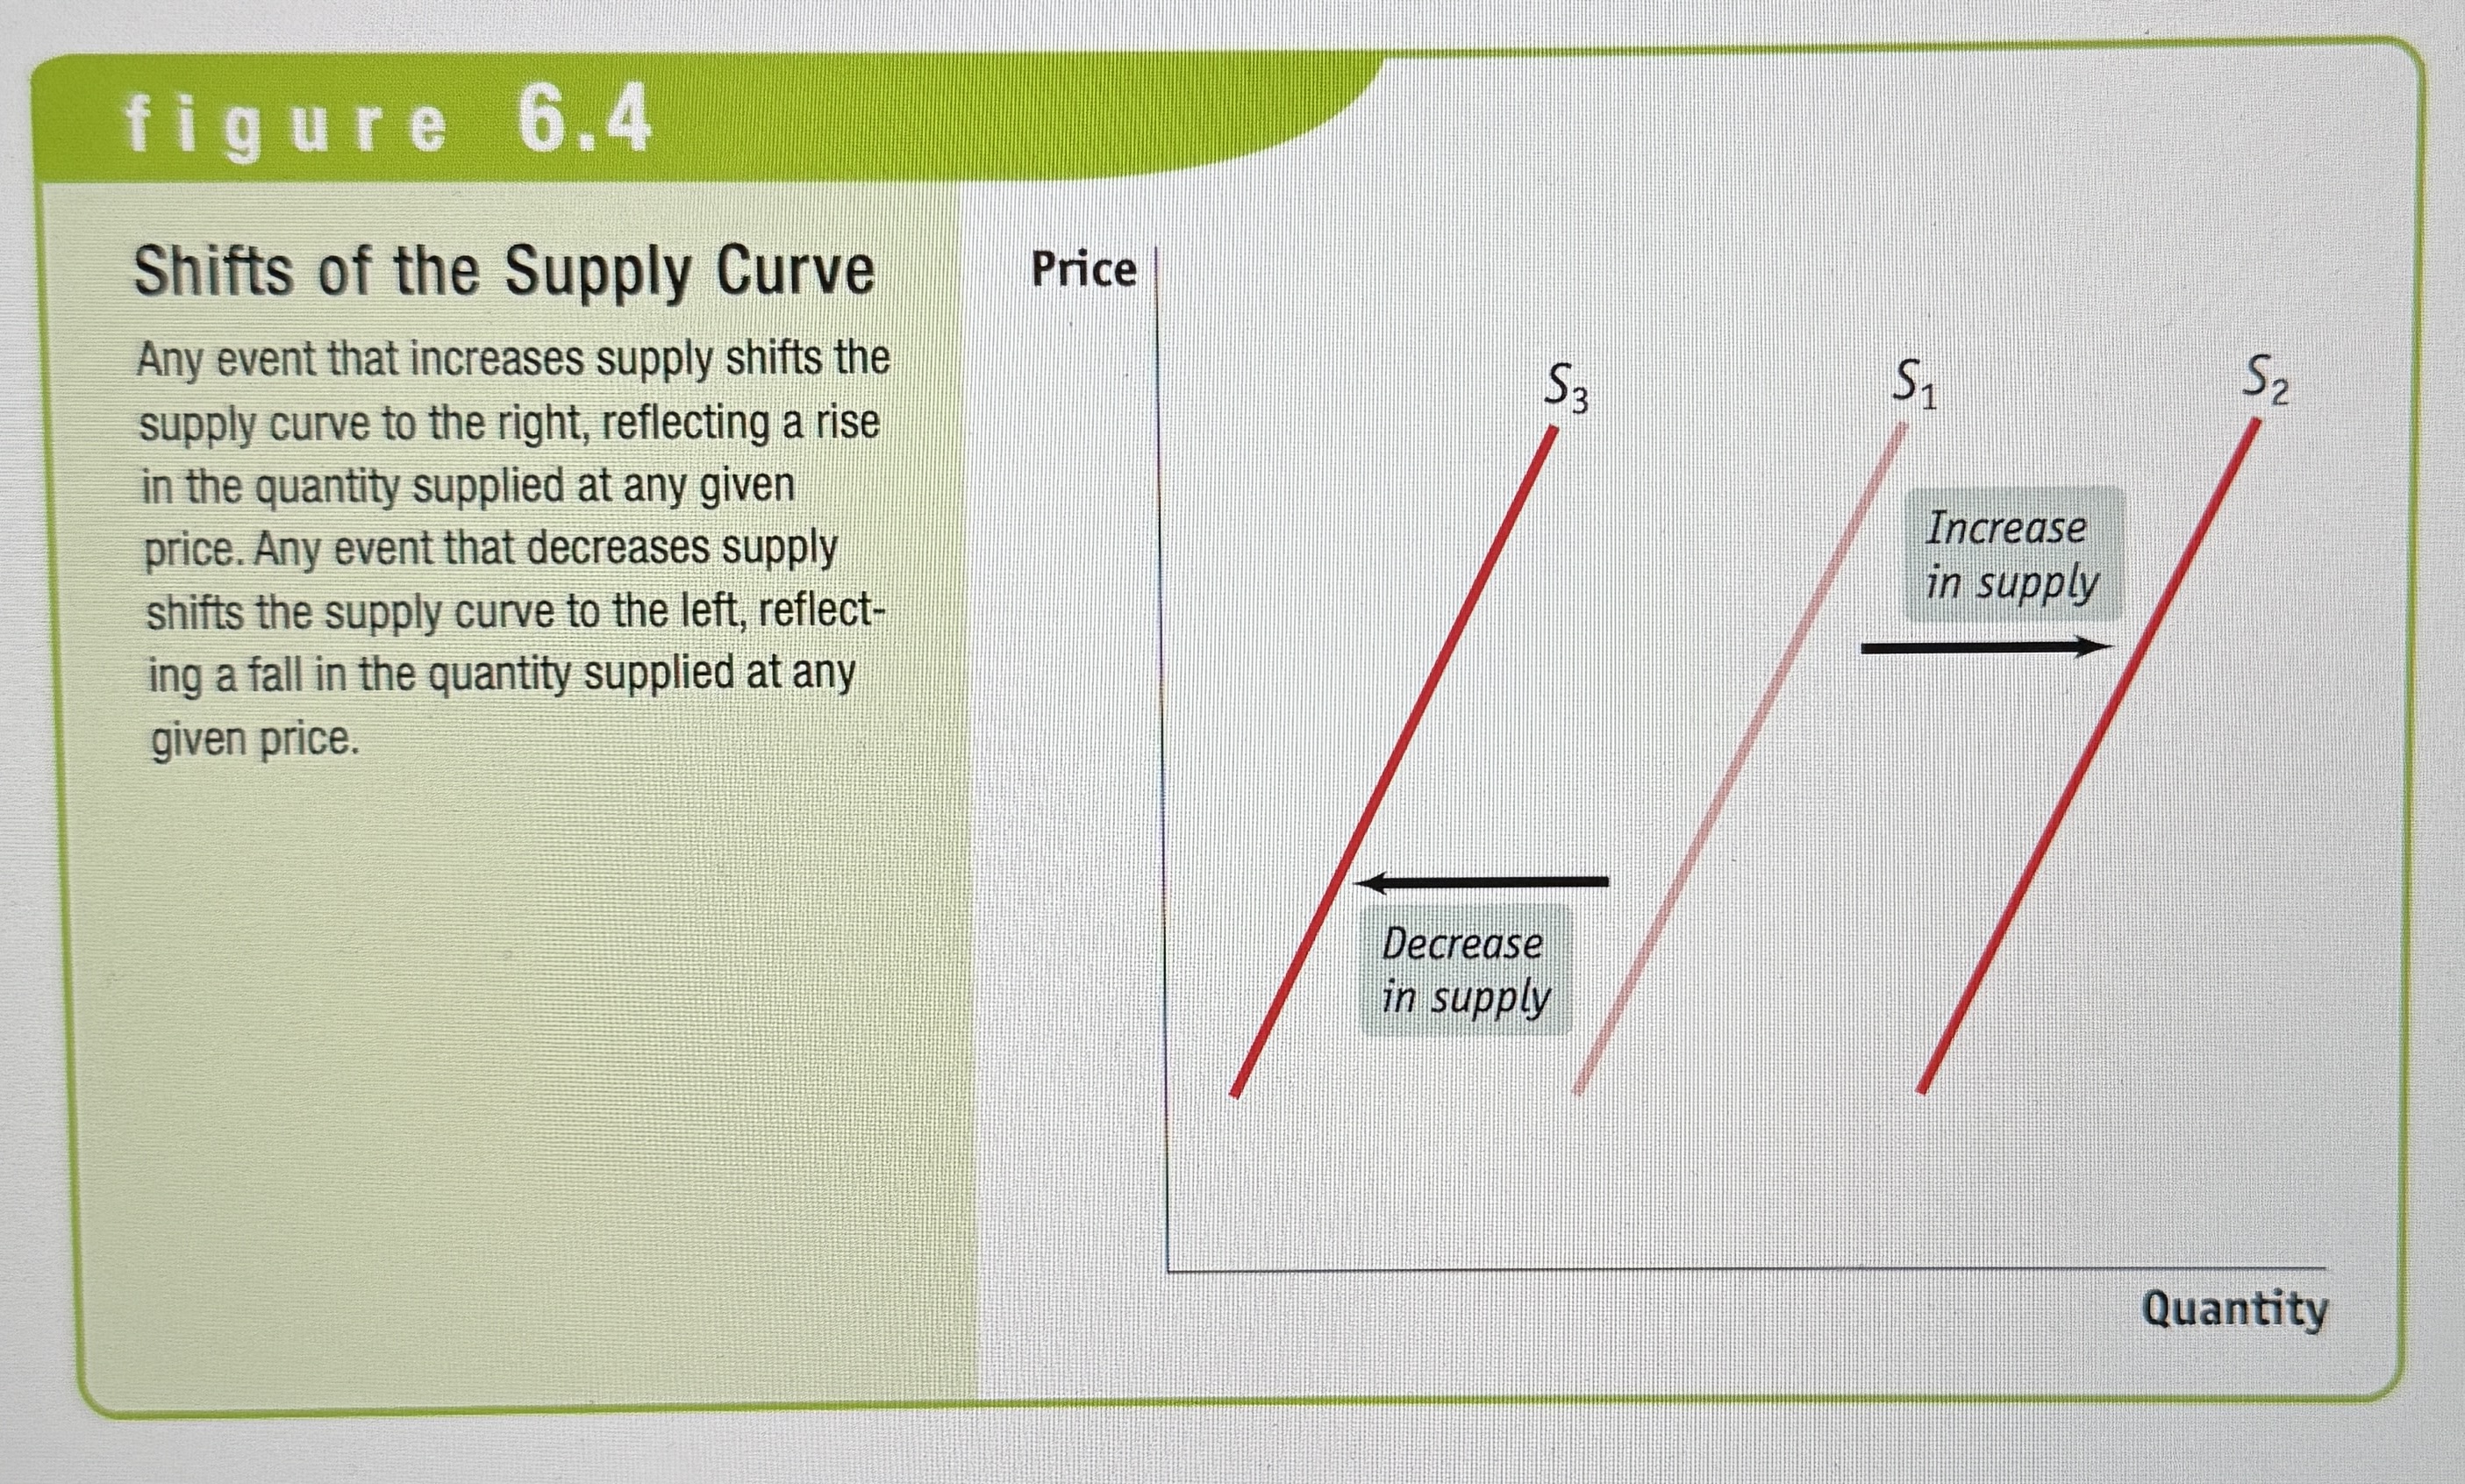
A Change in Supply
A shift of the supply curve, which changes the quantity supplied at any given price.
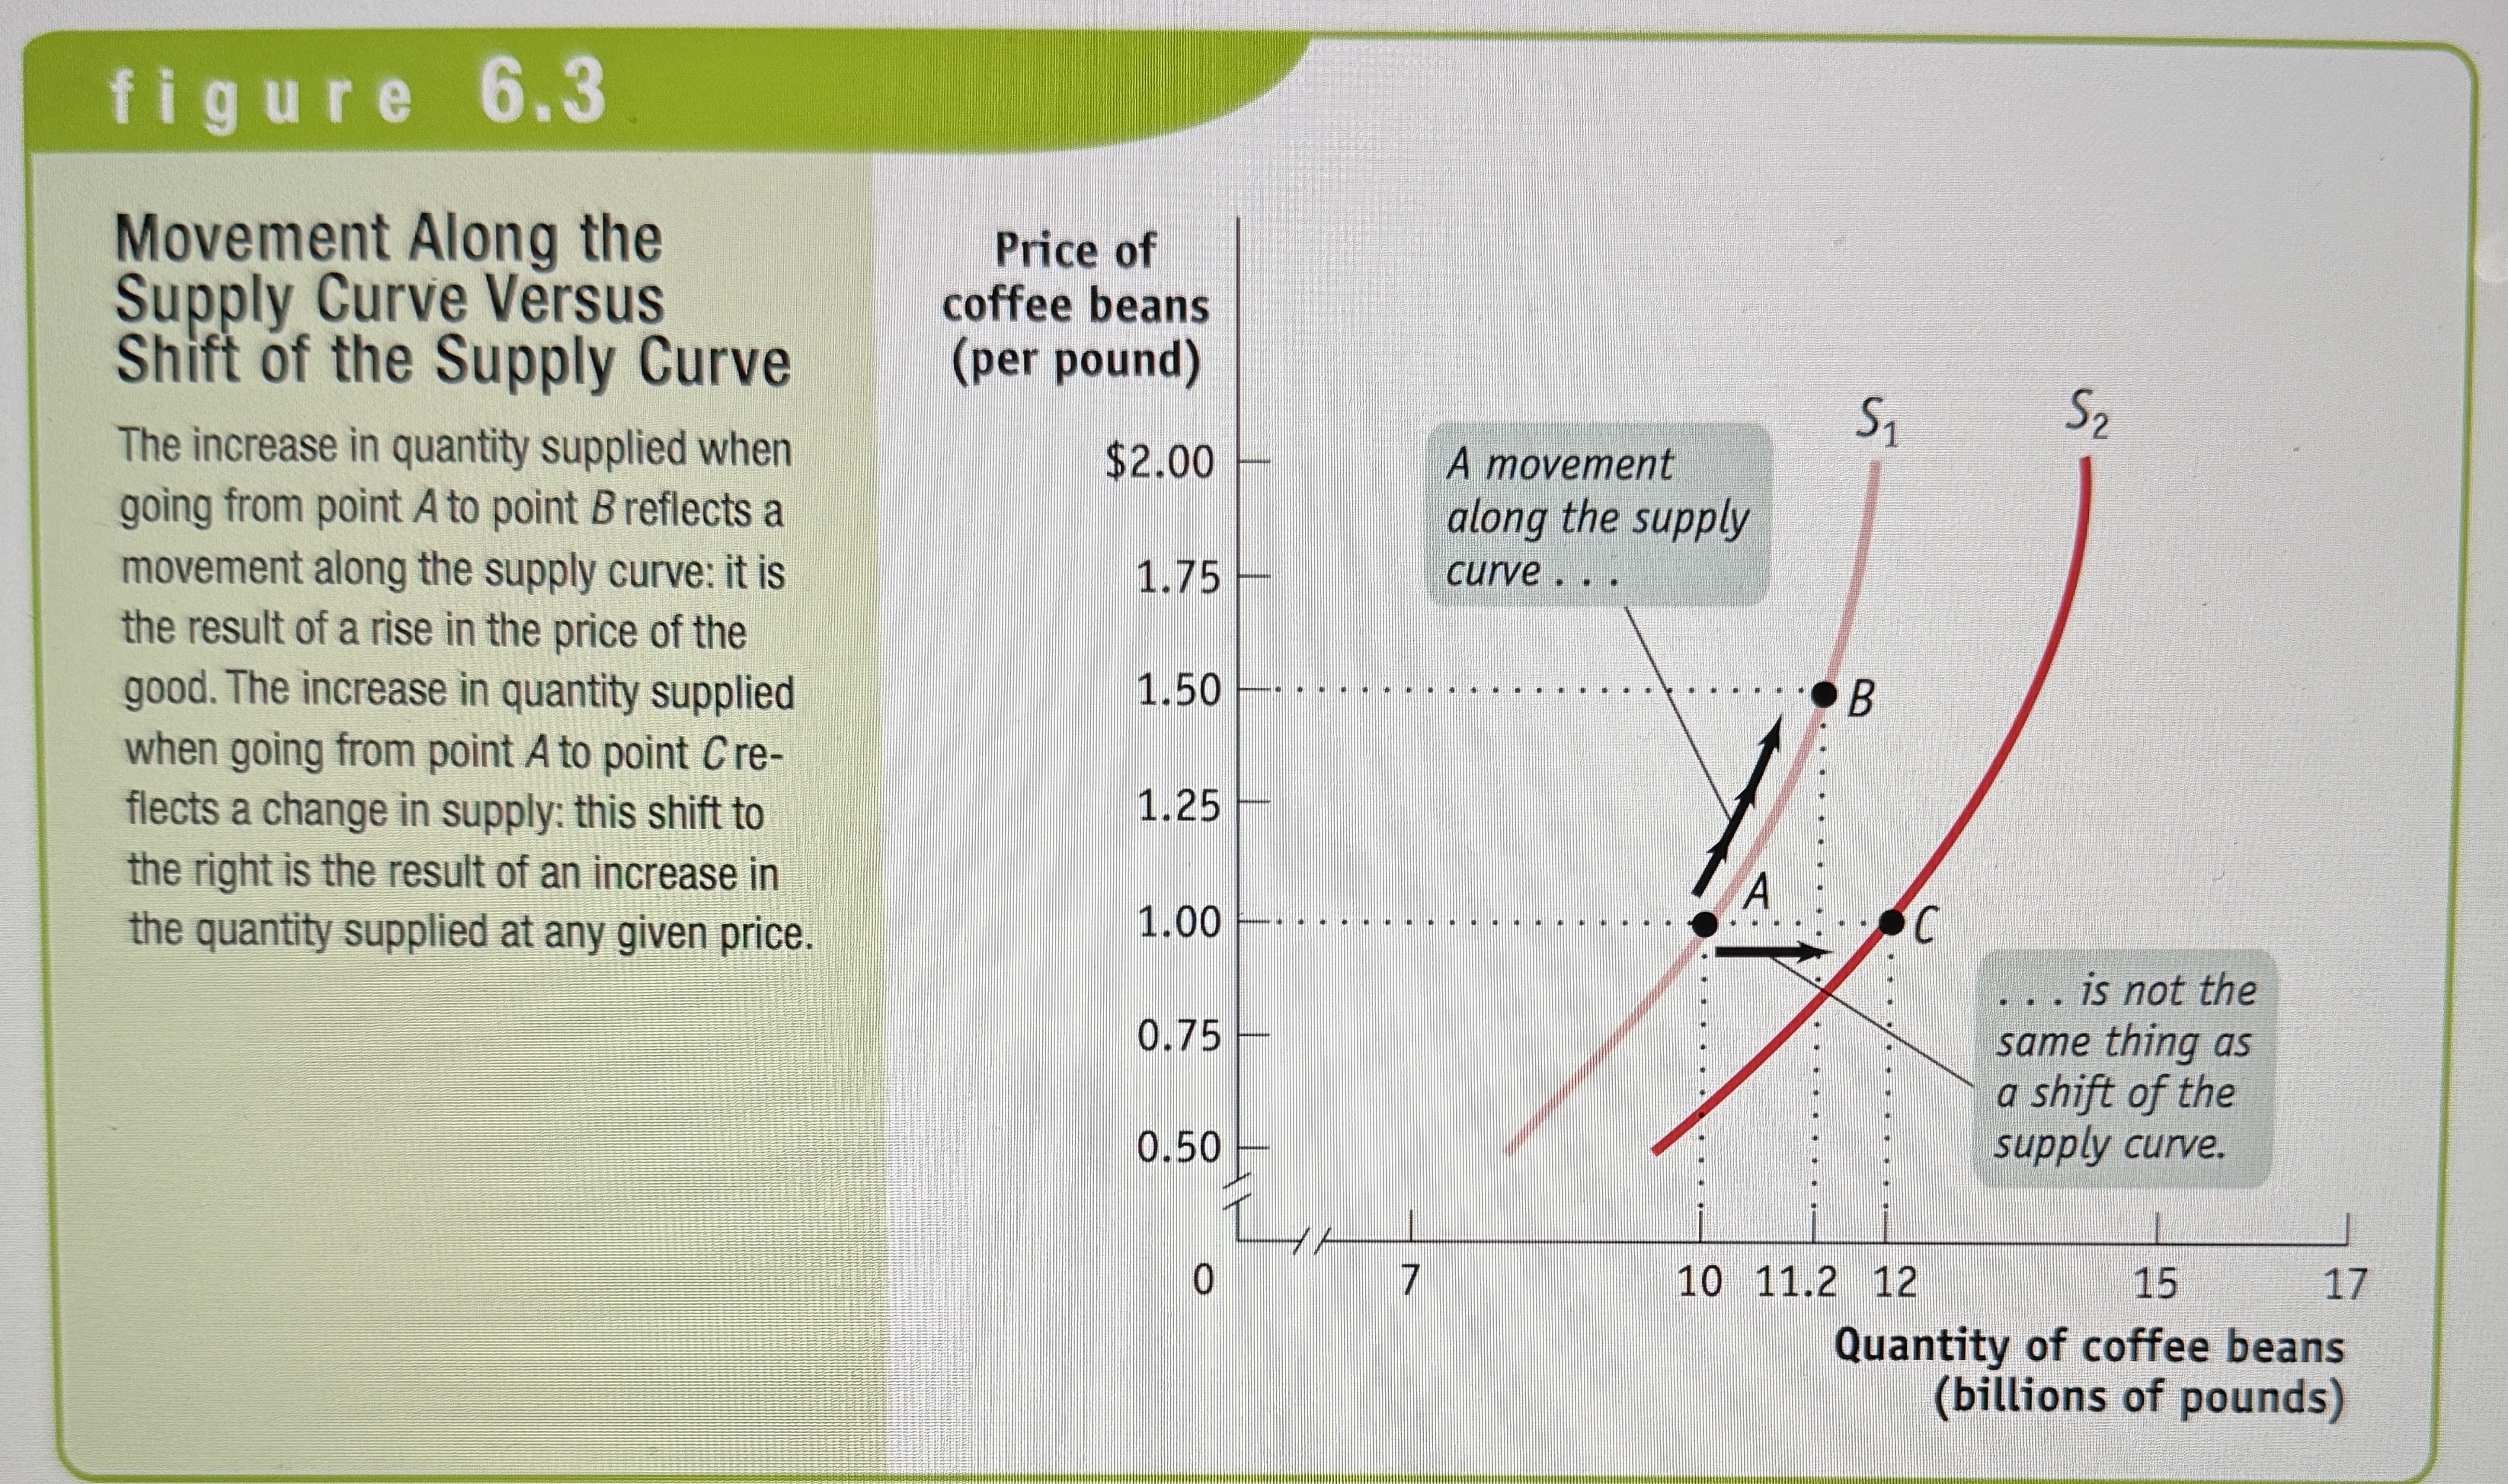
Movement along the Supply Curve
A change in the quantity supplied of a good that is the result of a change in that goods price.
An increase in Supply Graph
Ex.
What are the shifts for the supply curve?
Changes in input prices
Changes in the price of related goods and services
Changes in technology
Changes in expectations
Changes in the number of producers
(Also changes in government actions, subsidies and taxes)
Types of Movement on the Supply Curve
Ex.
Shifts on the Supply Curve
Ex.
Changes in Input Prices
An input is anything used to make a good or services. If the price of any of theses inputs increases then the supply of that good decreases.
Changes in the Prices of Related Goods and Services
The same as the demand curve.
Changes in Technology
Better equipment allows you to make more of a good.
Changes in Expectations
Same as the demand curve.
Changes in the number of producers.
The more people that can produce your good, the higher the supply of it will be.
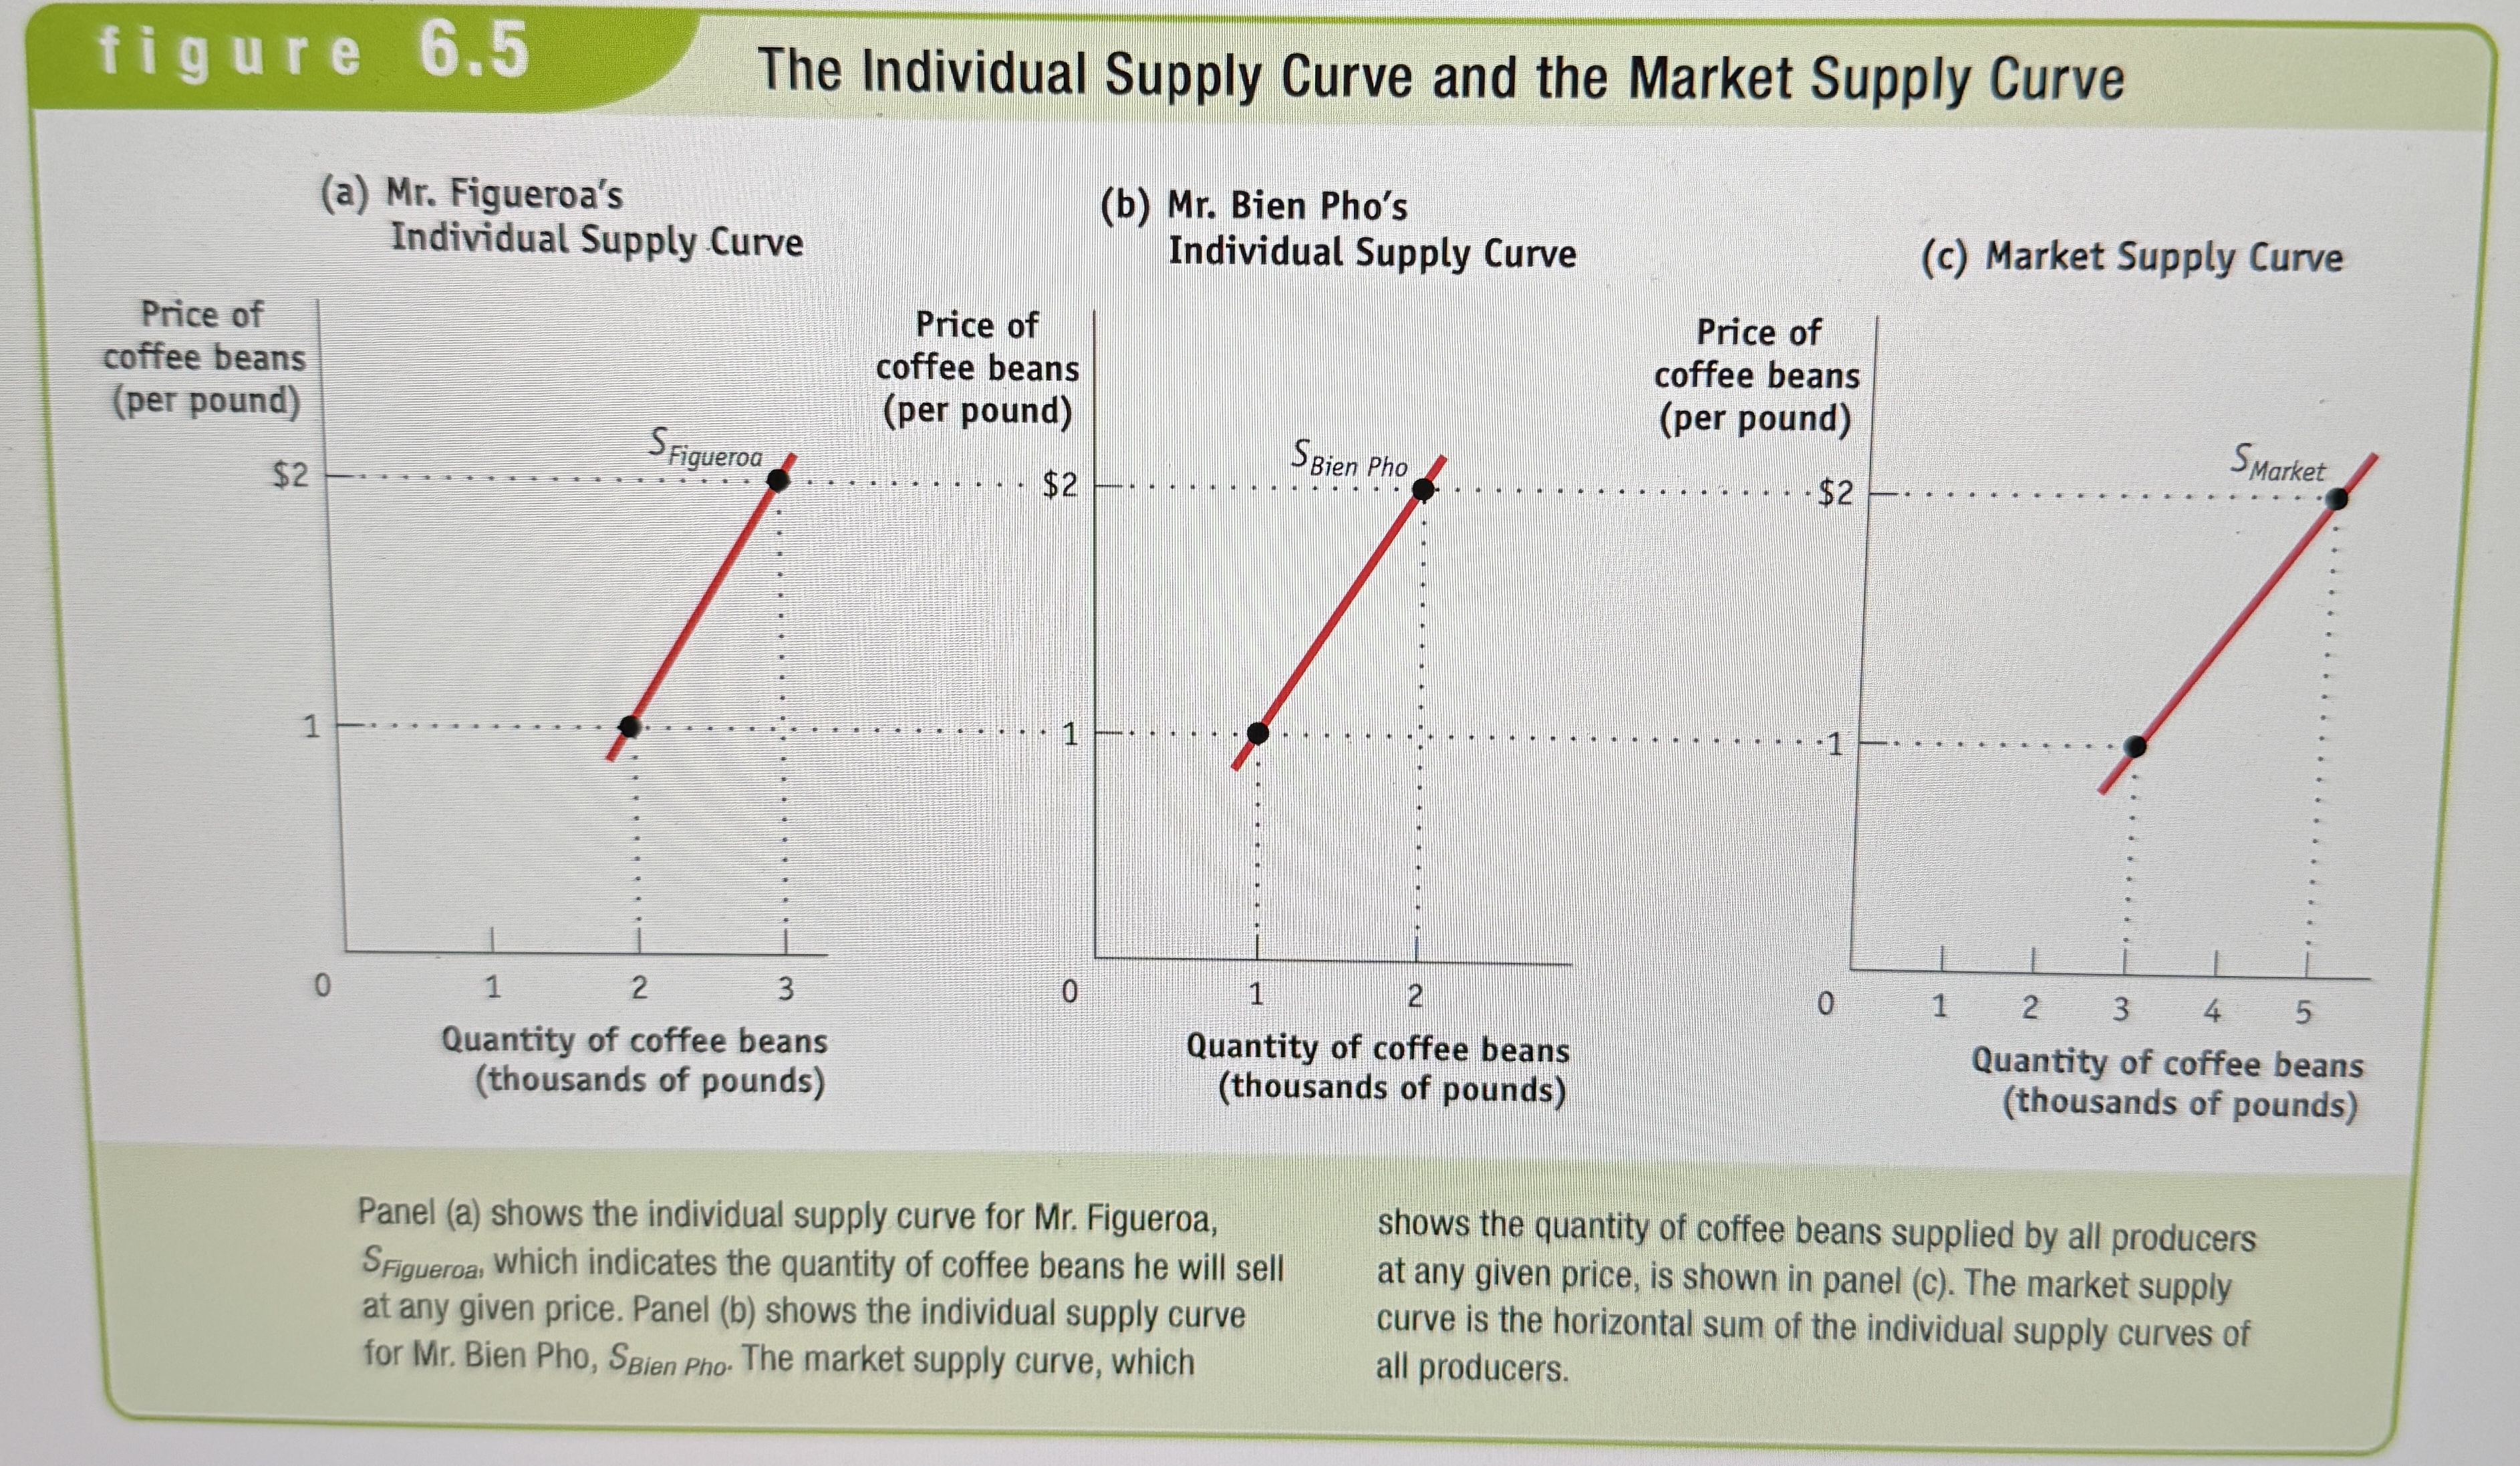
The individual supply curve
Illustrates the relationship between quantity supplied and price for an individual producer.
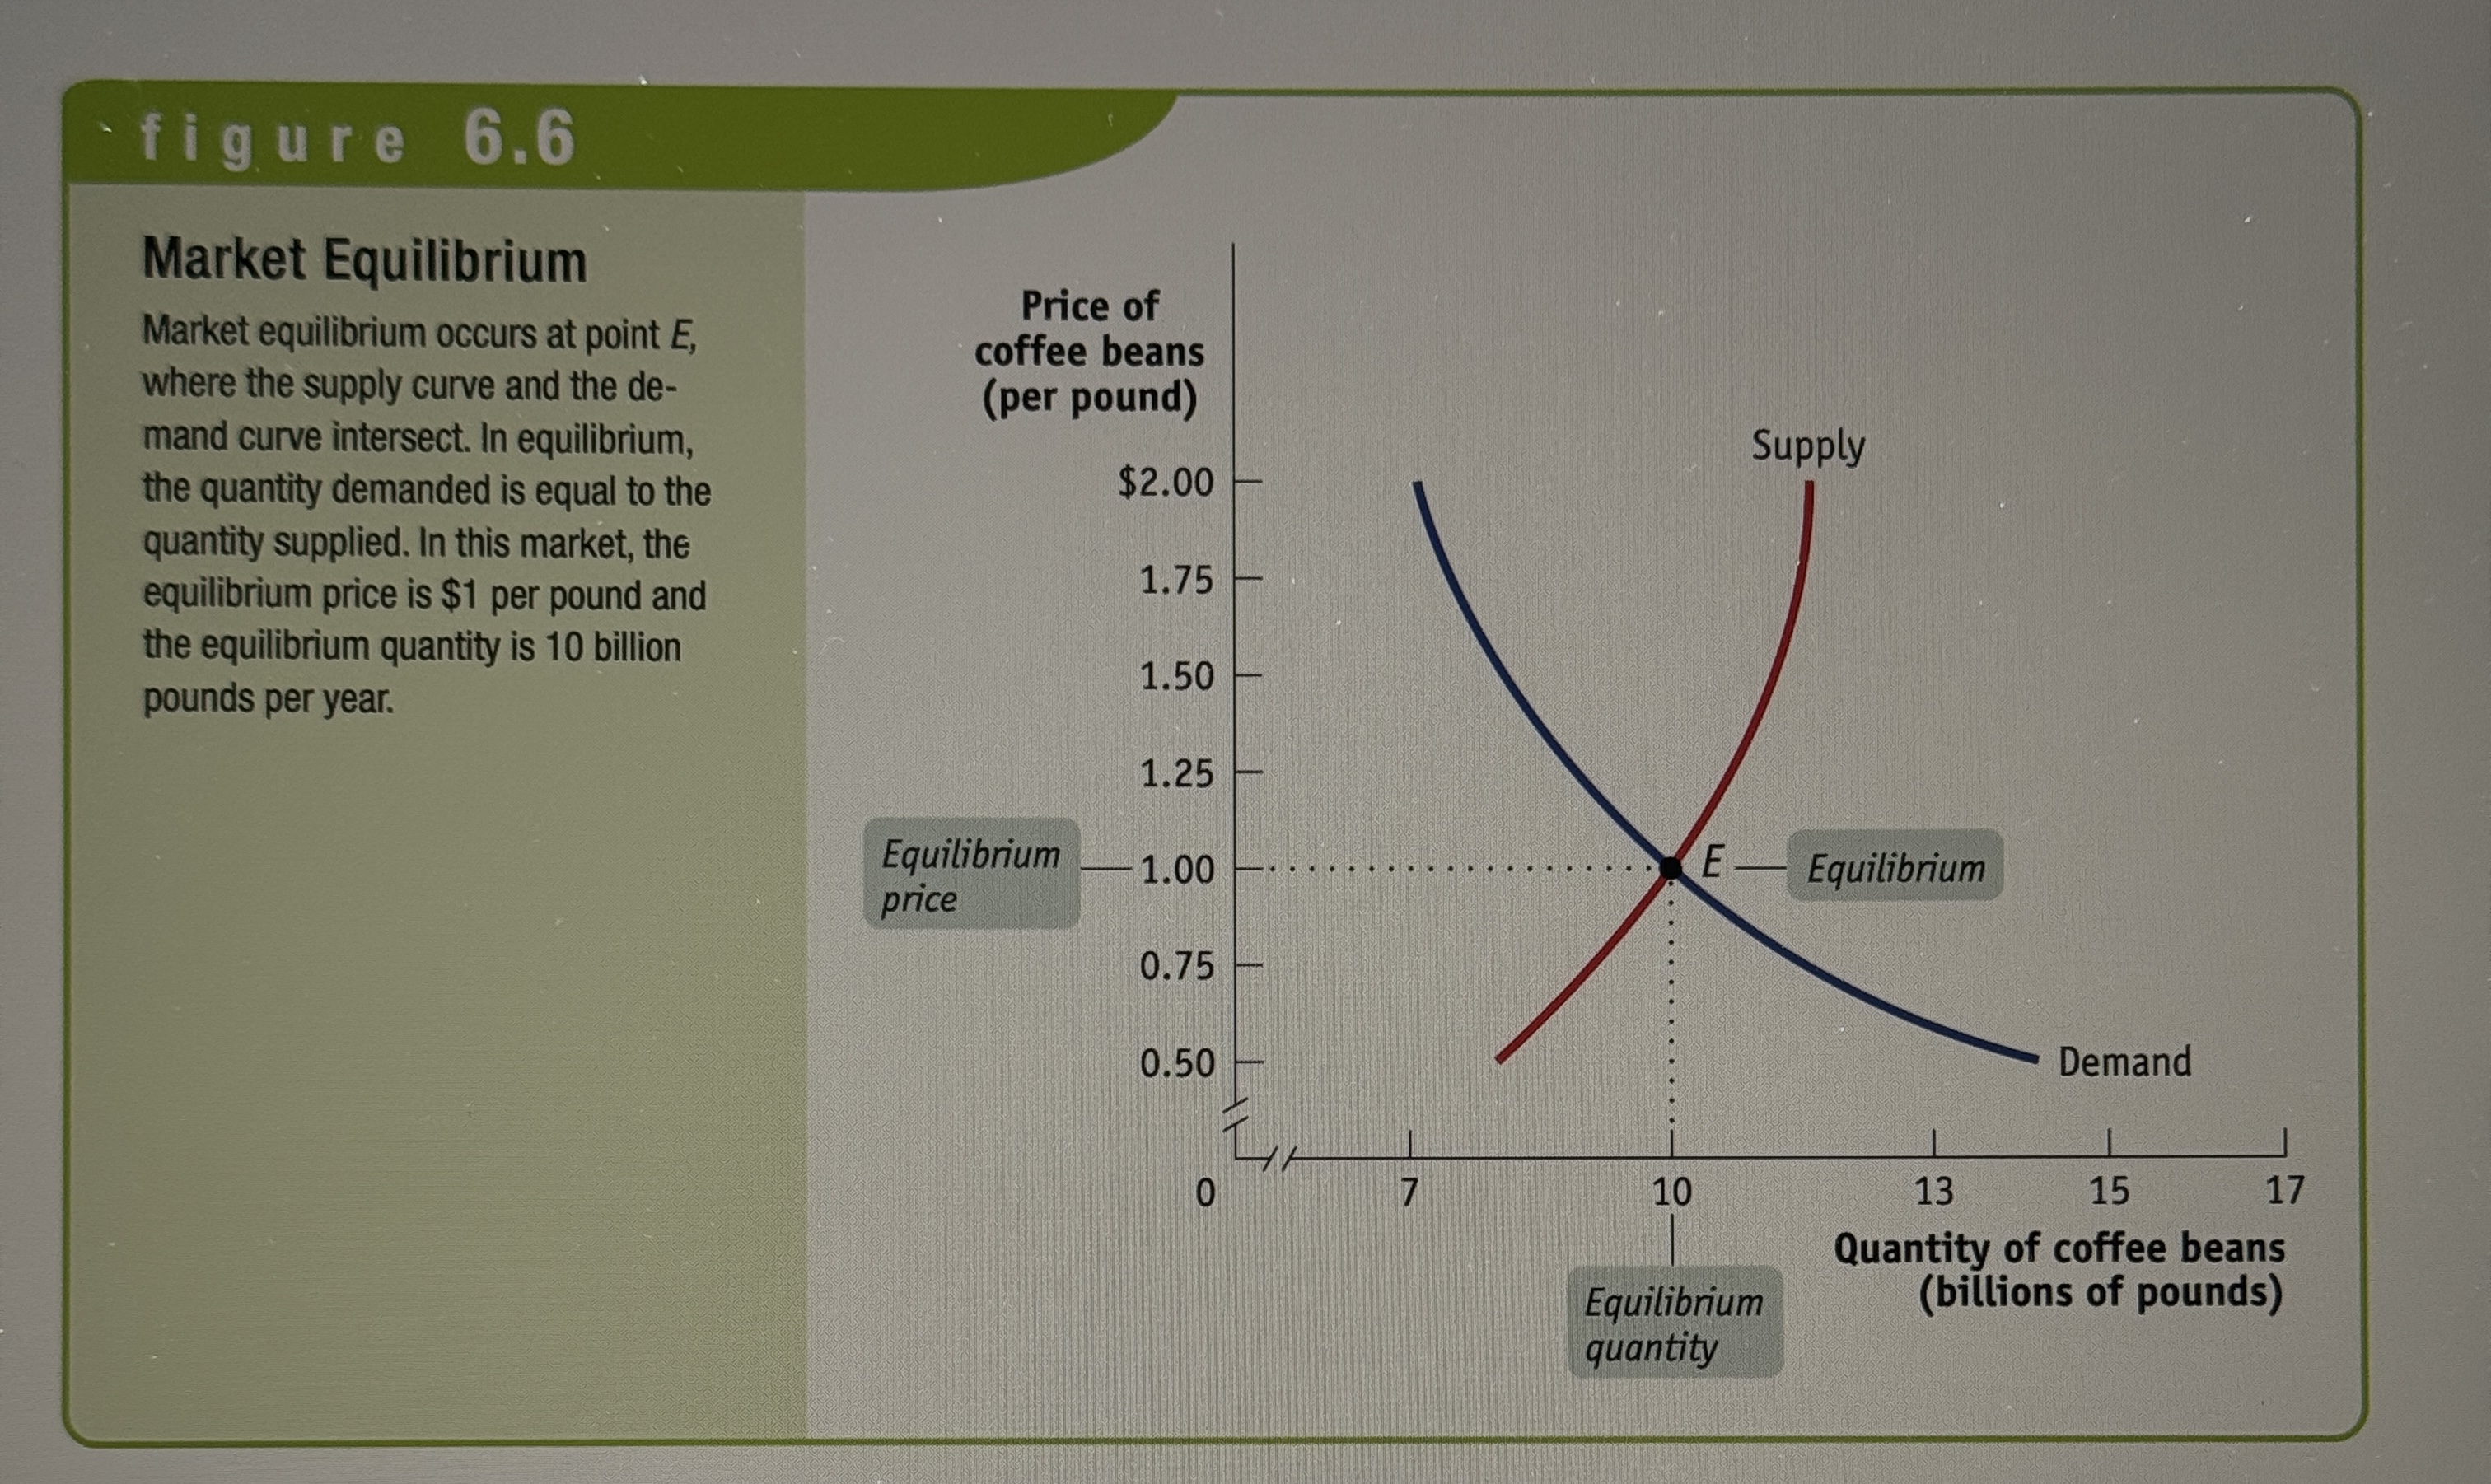
Equilibrium
An economic situation where no individual would be better off doing something different.
Equilibrium Continued…
A competitive market is in equilibrium when price has moved to a level at which the quantity demanded of a good equals the quantity supplied of that good. The price at which this takes place is the equilibrium price, also referred to as the market-clearing price. The quantity of the good bought and soid at that price is the equilibrium quantity.
Market Equilibrium Graph
Ex.
Why do all sales and purchases in a market take place at the same price?
In a competitive market, price is determined by the equilibrium where the quantity demanded equals the quantity supplied. All buyers pay the equilibrium price, and sellers are willing to sell their goods at that price, ensuring uniformity in transactions.
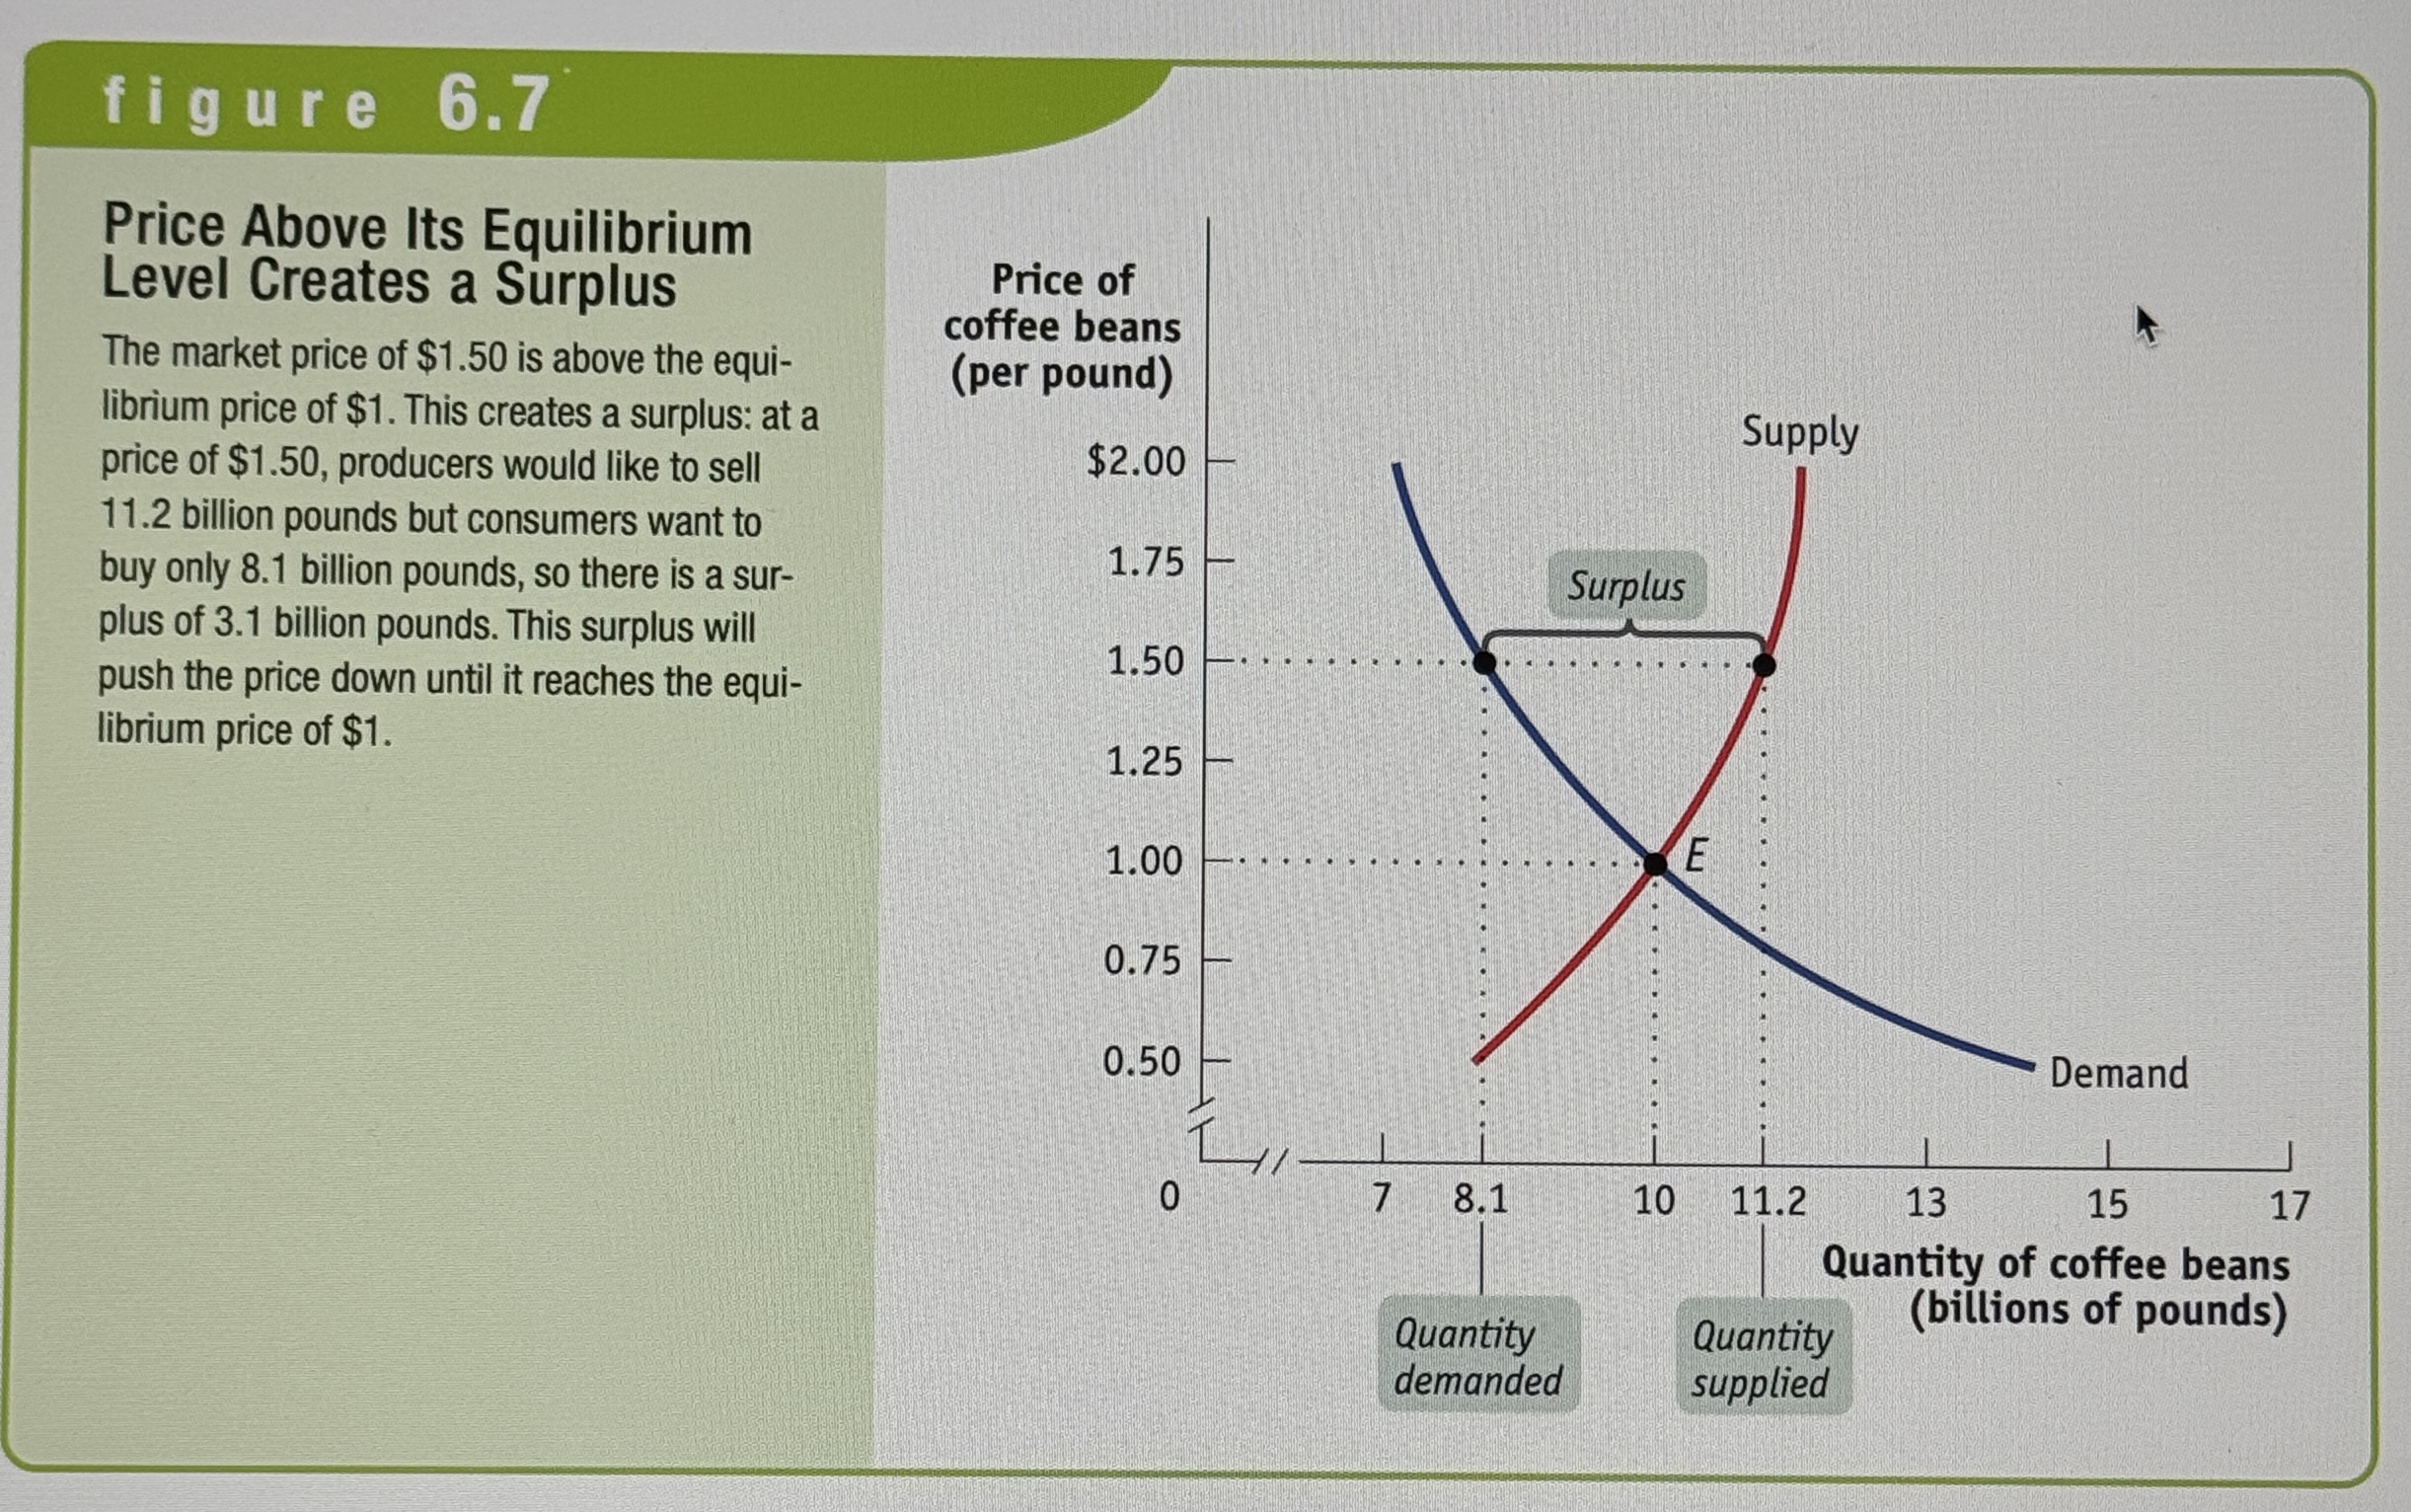
Surplus
There is a surplus of goods when the quantity supplied exceeds the quantity demanded. Surpluses occur when the price is above equilibrium. Supply - Demand.
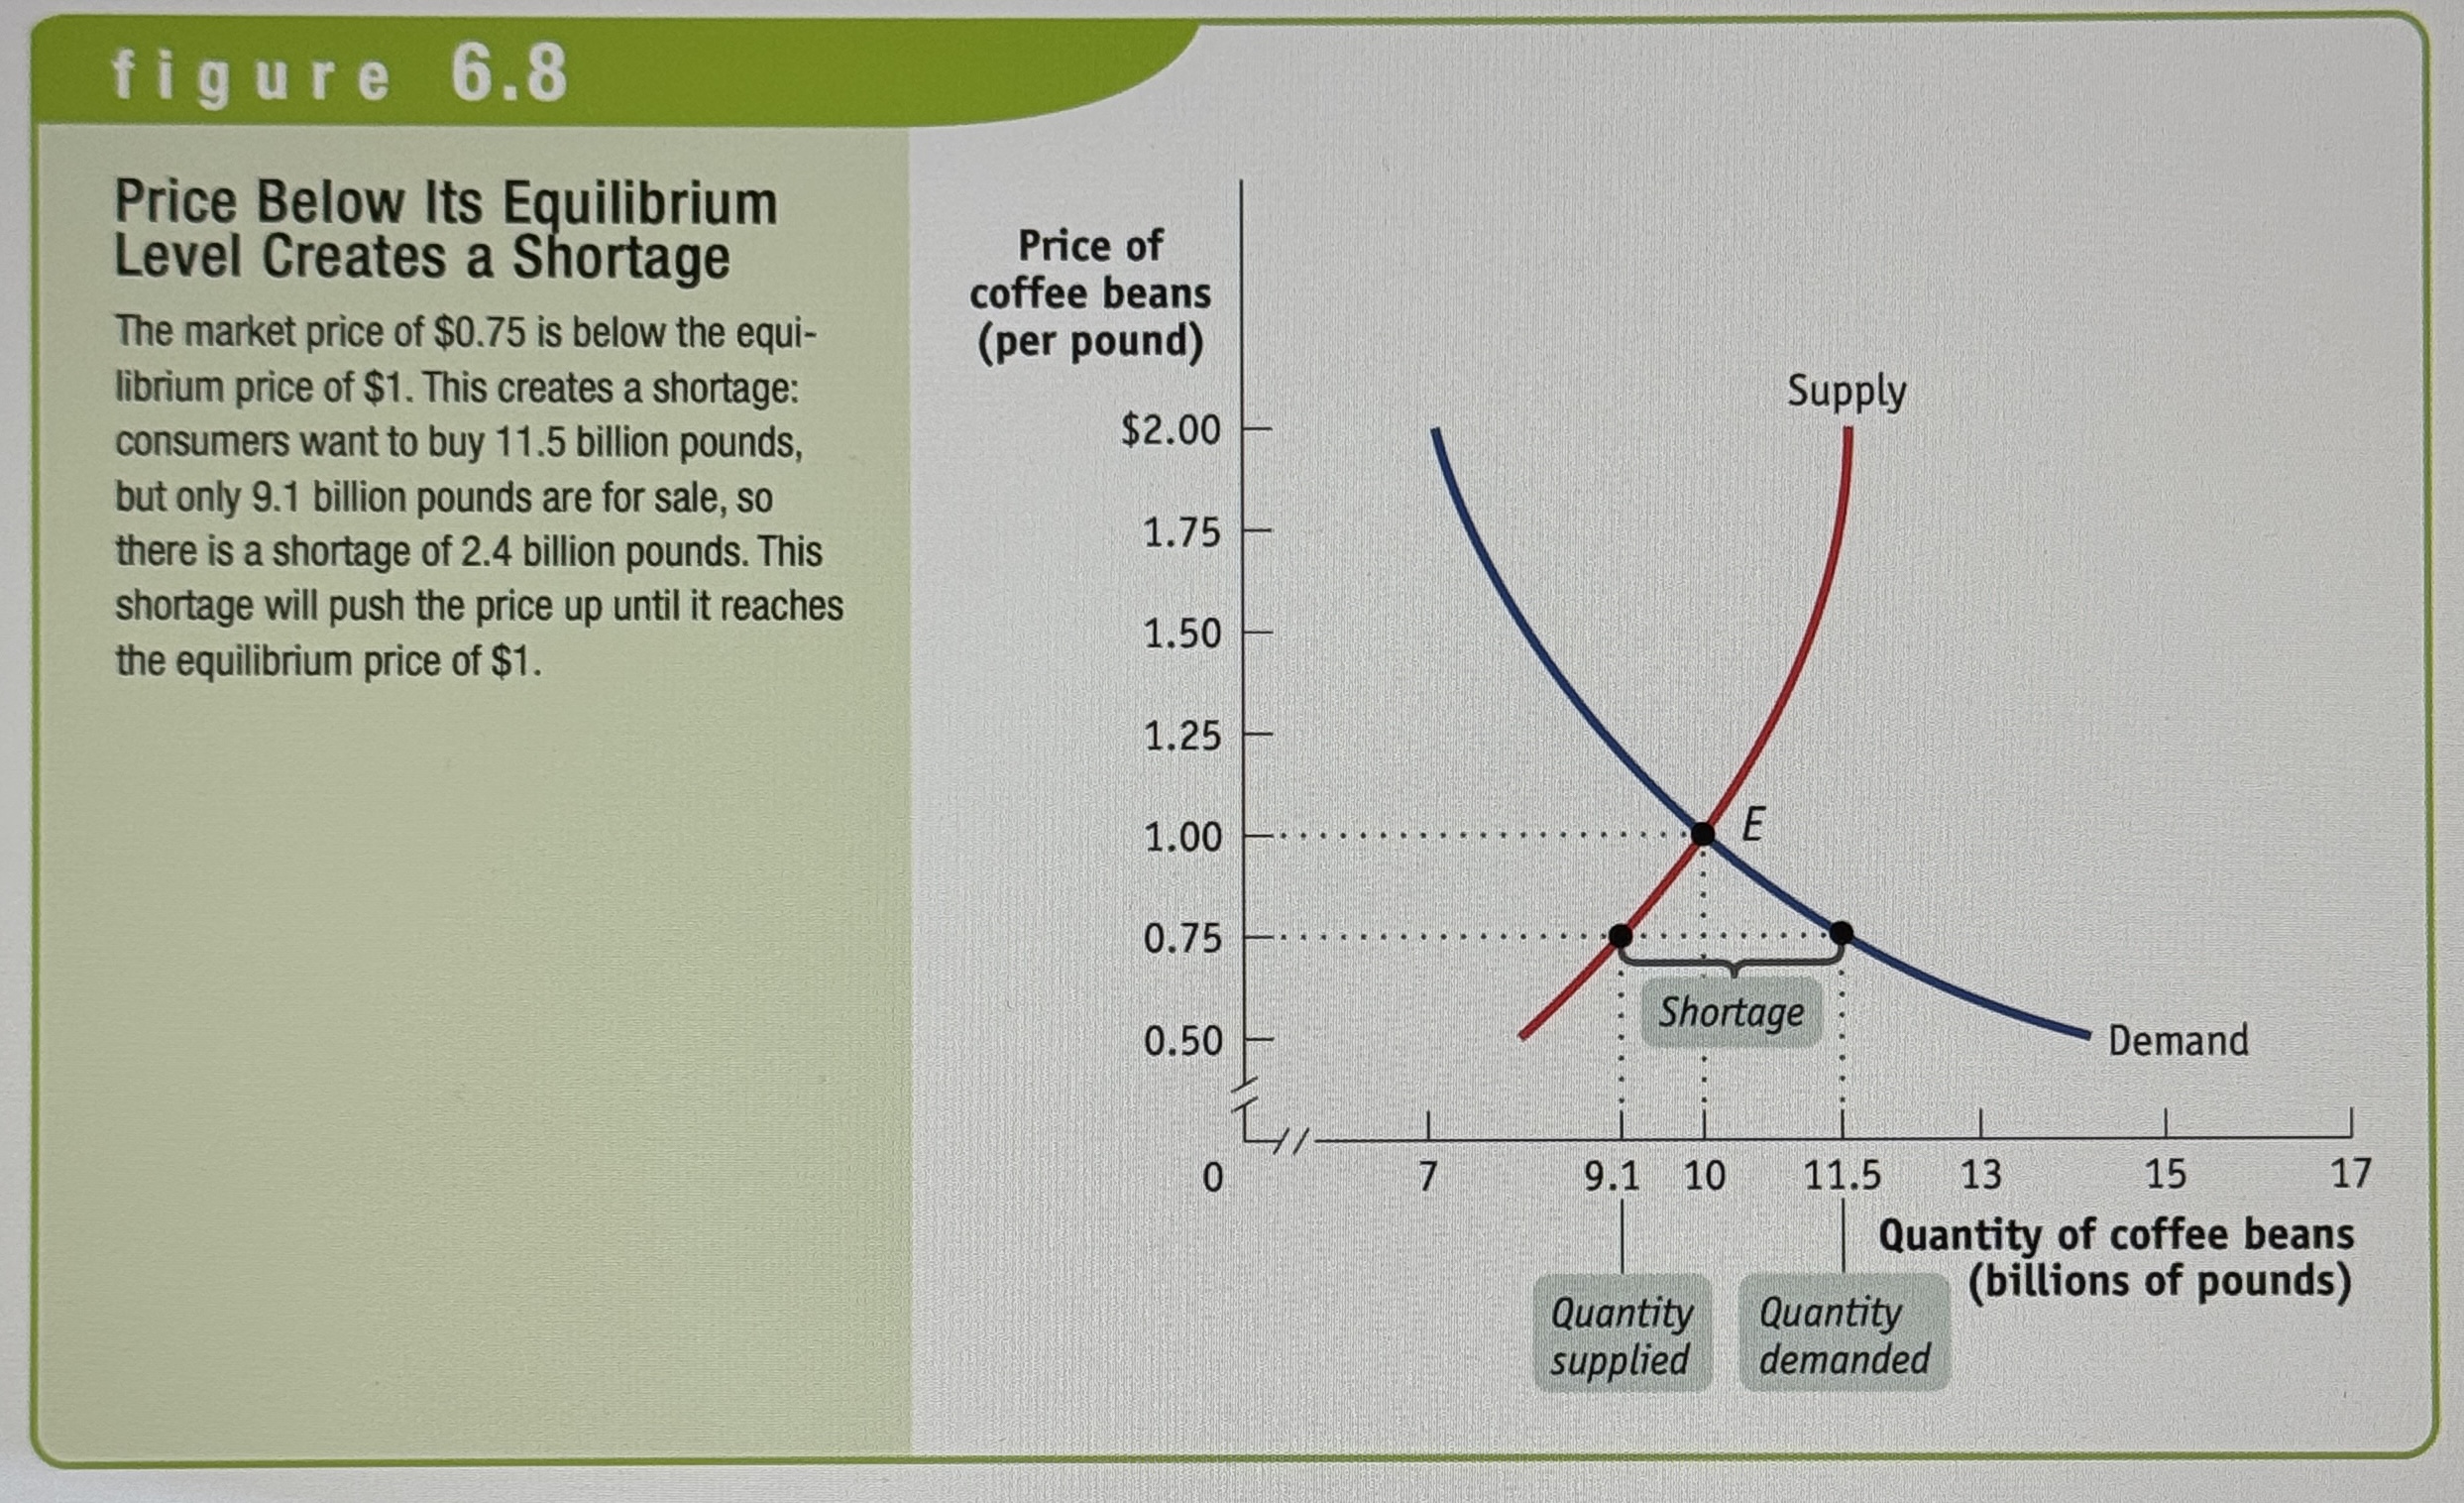
Shortage
There is a shortage of goods when the quantity demanded exceeds the quantity supplied. Shortages occur when the price is below equilibrium. Demand - Supply.
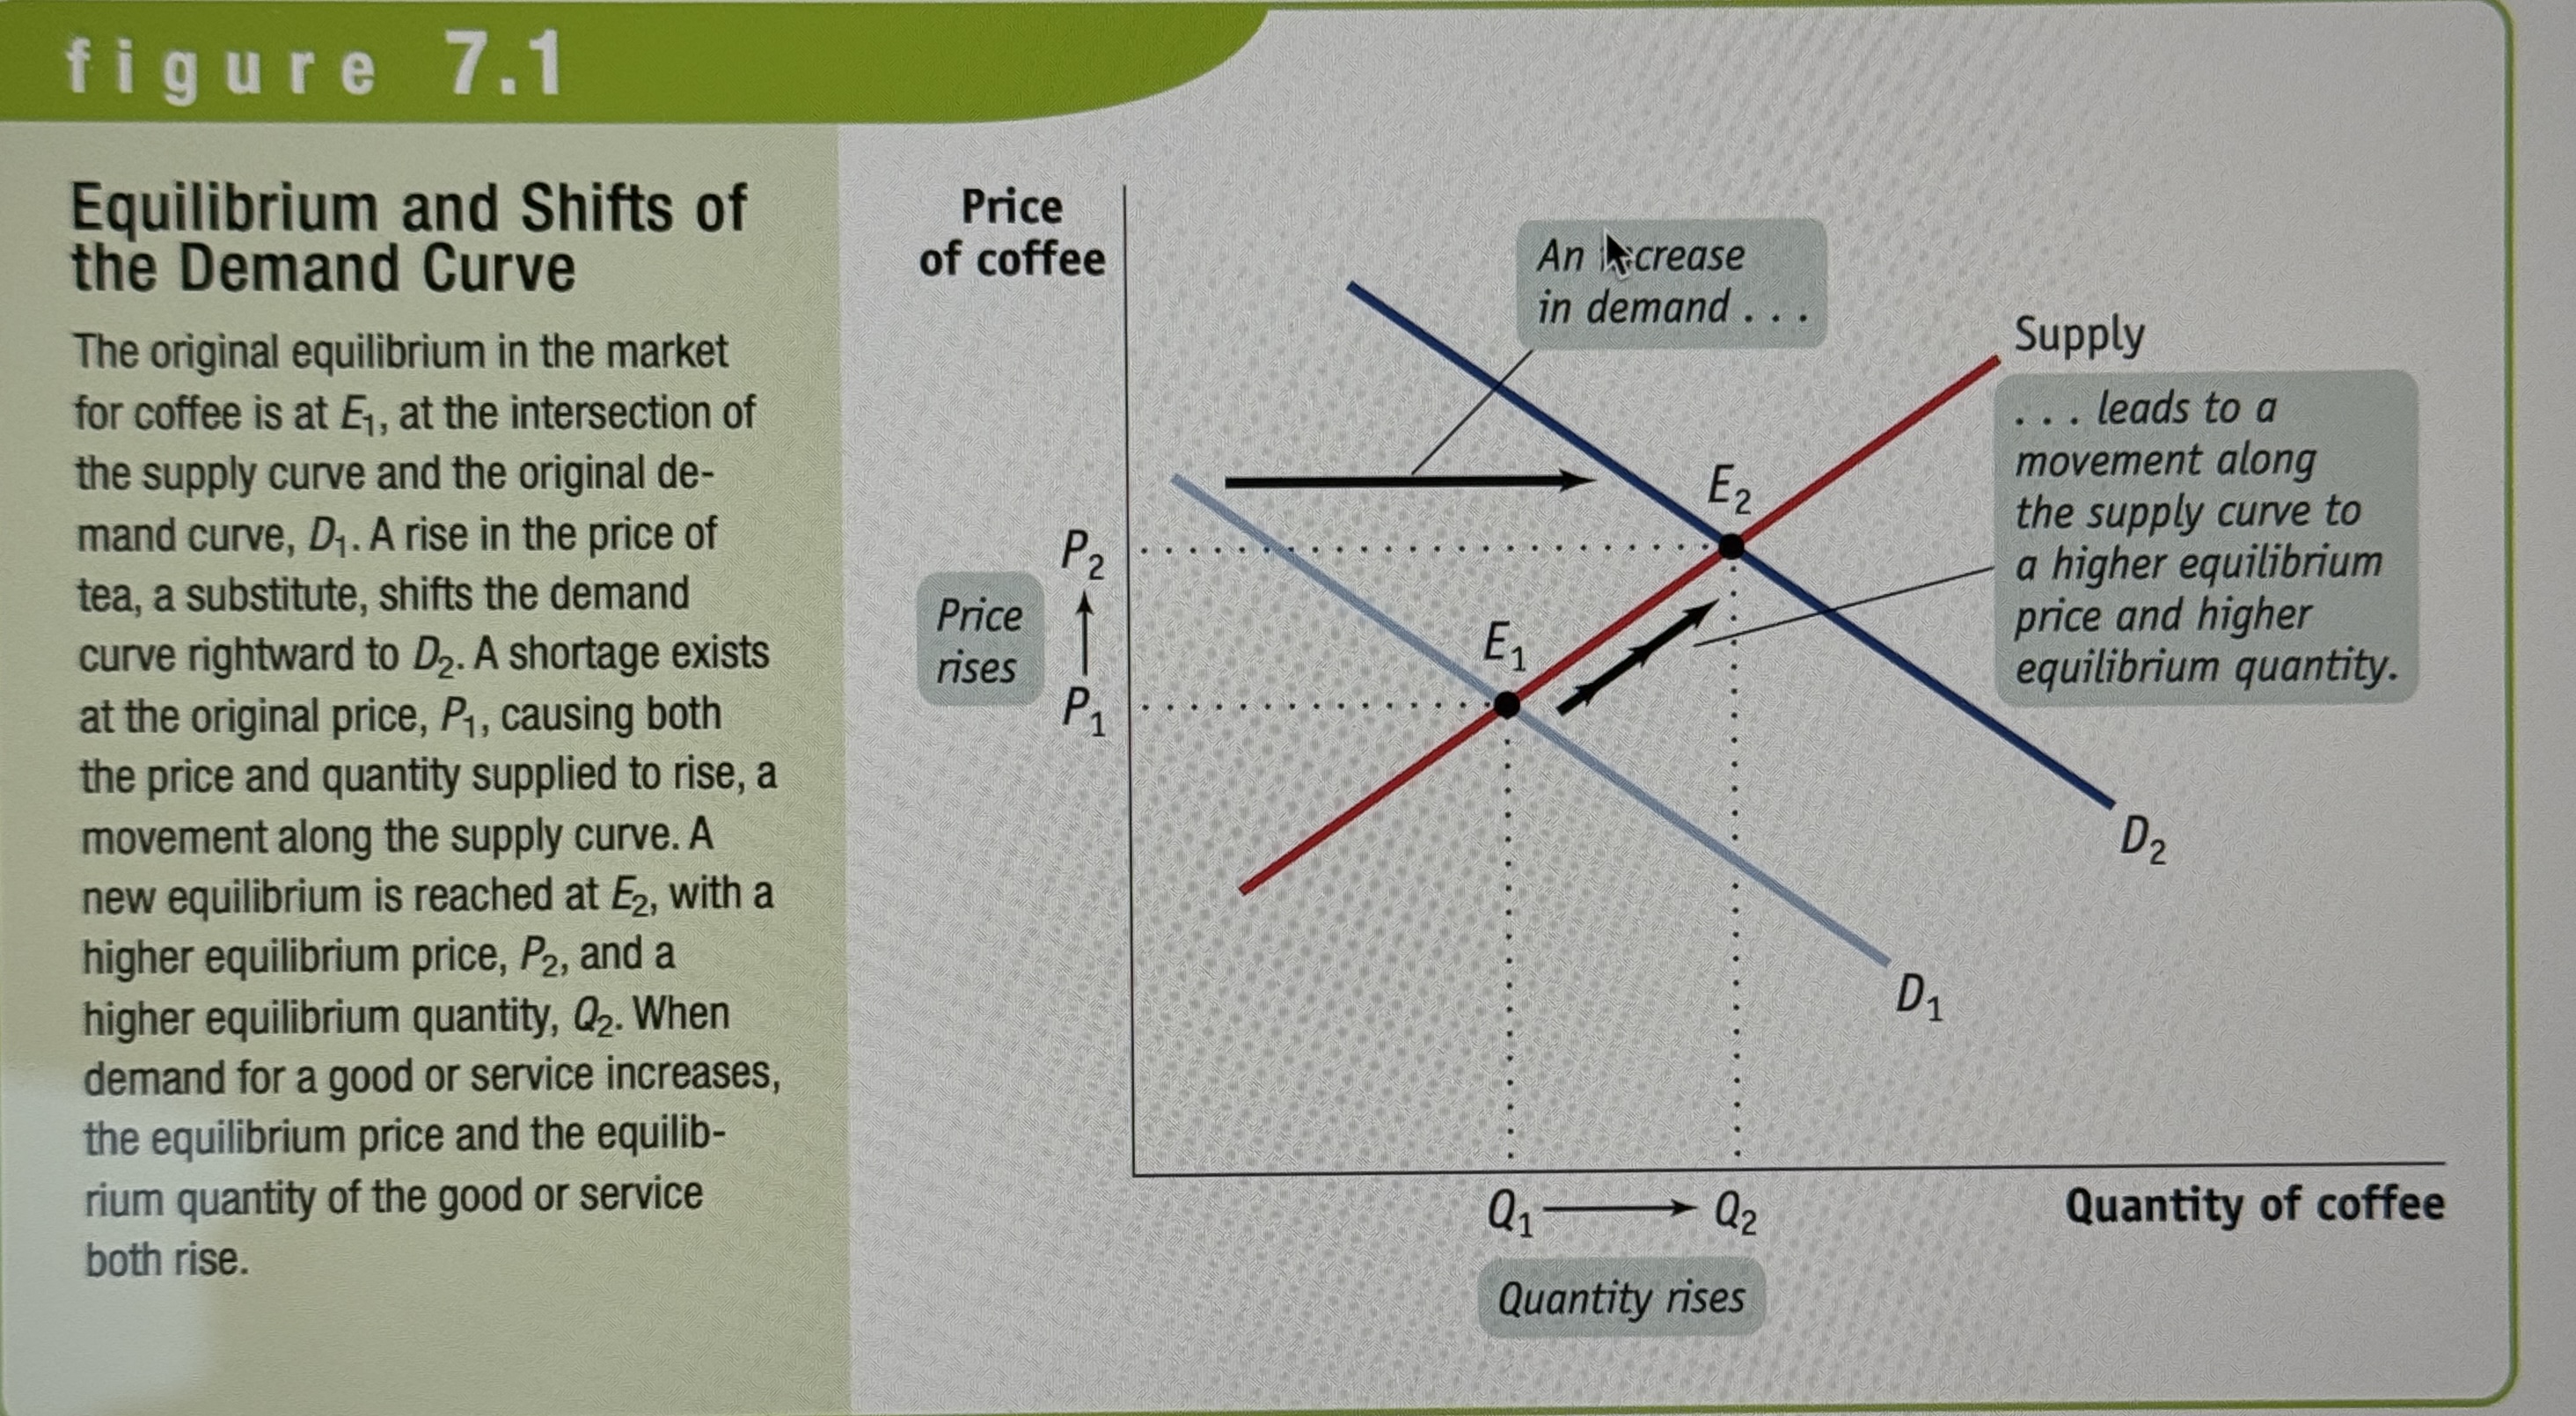
Equilibrium and Shifts on the Demand Curve
Ex.
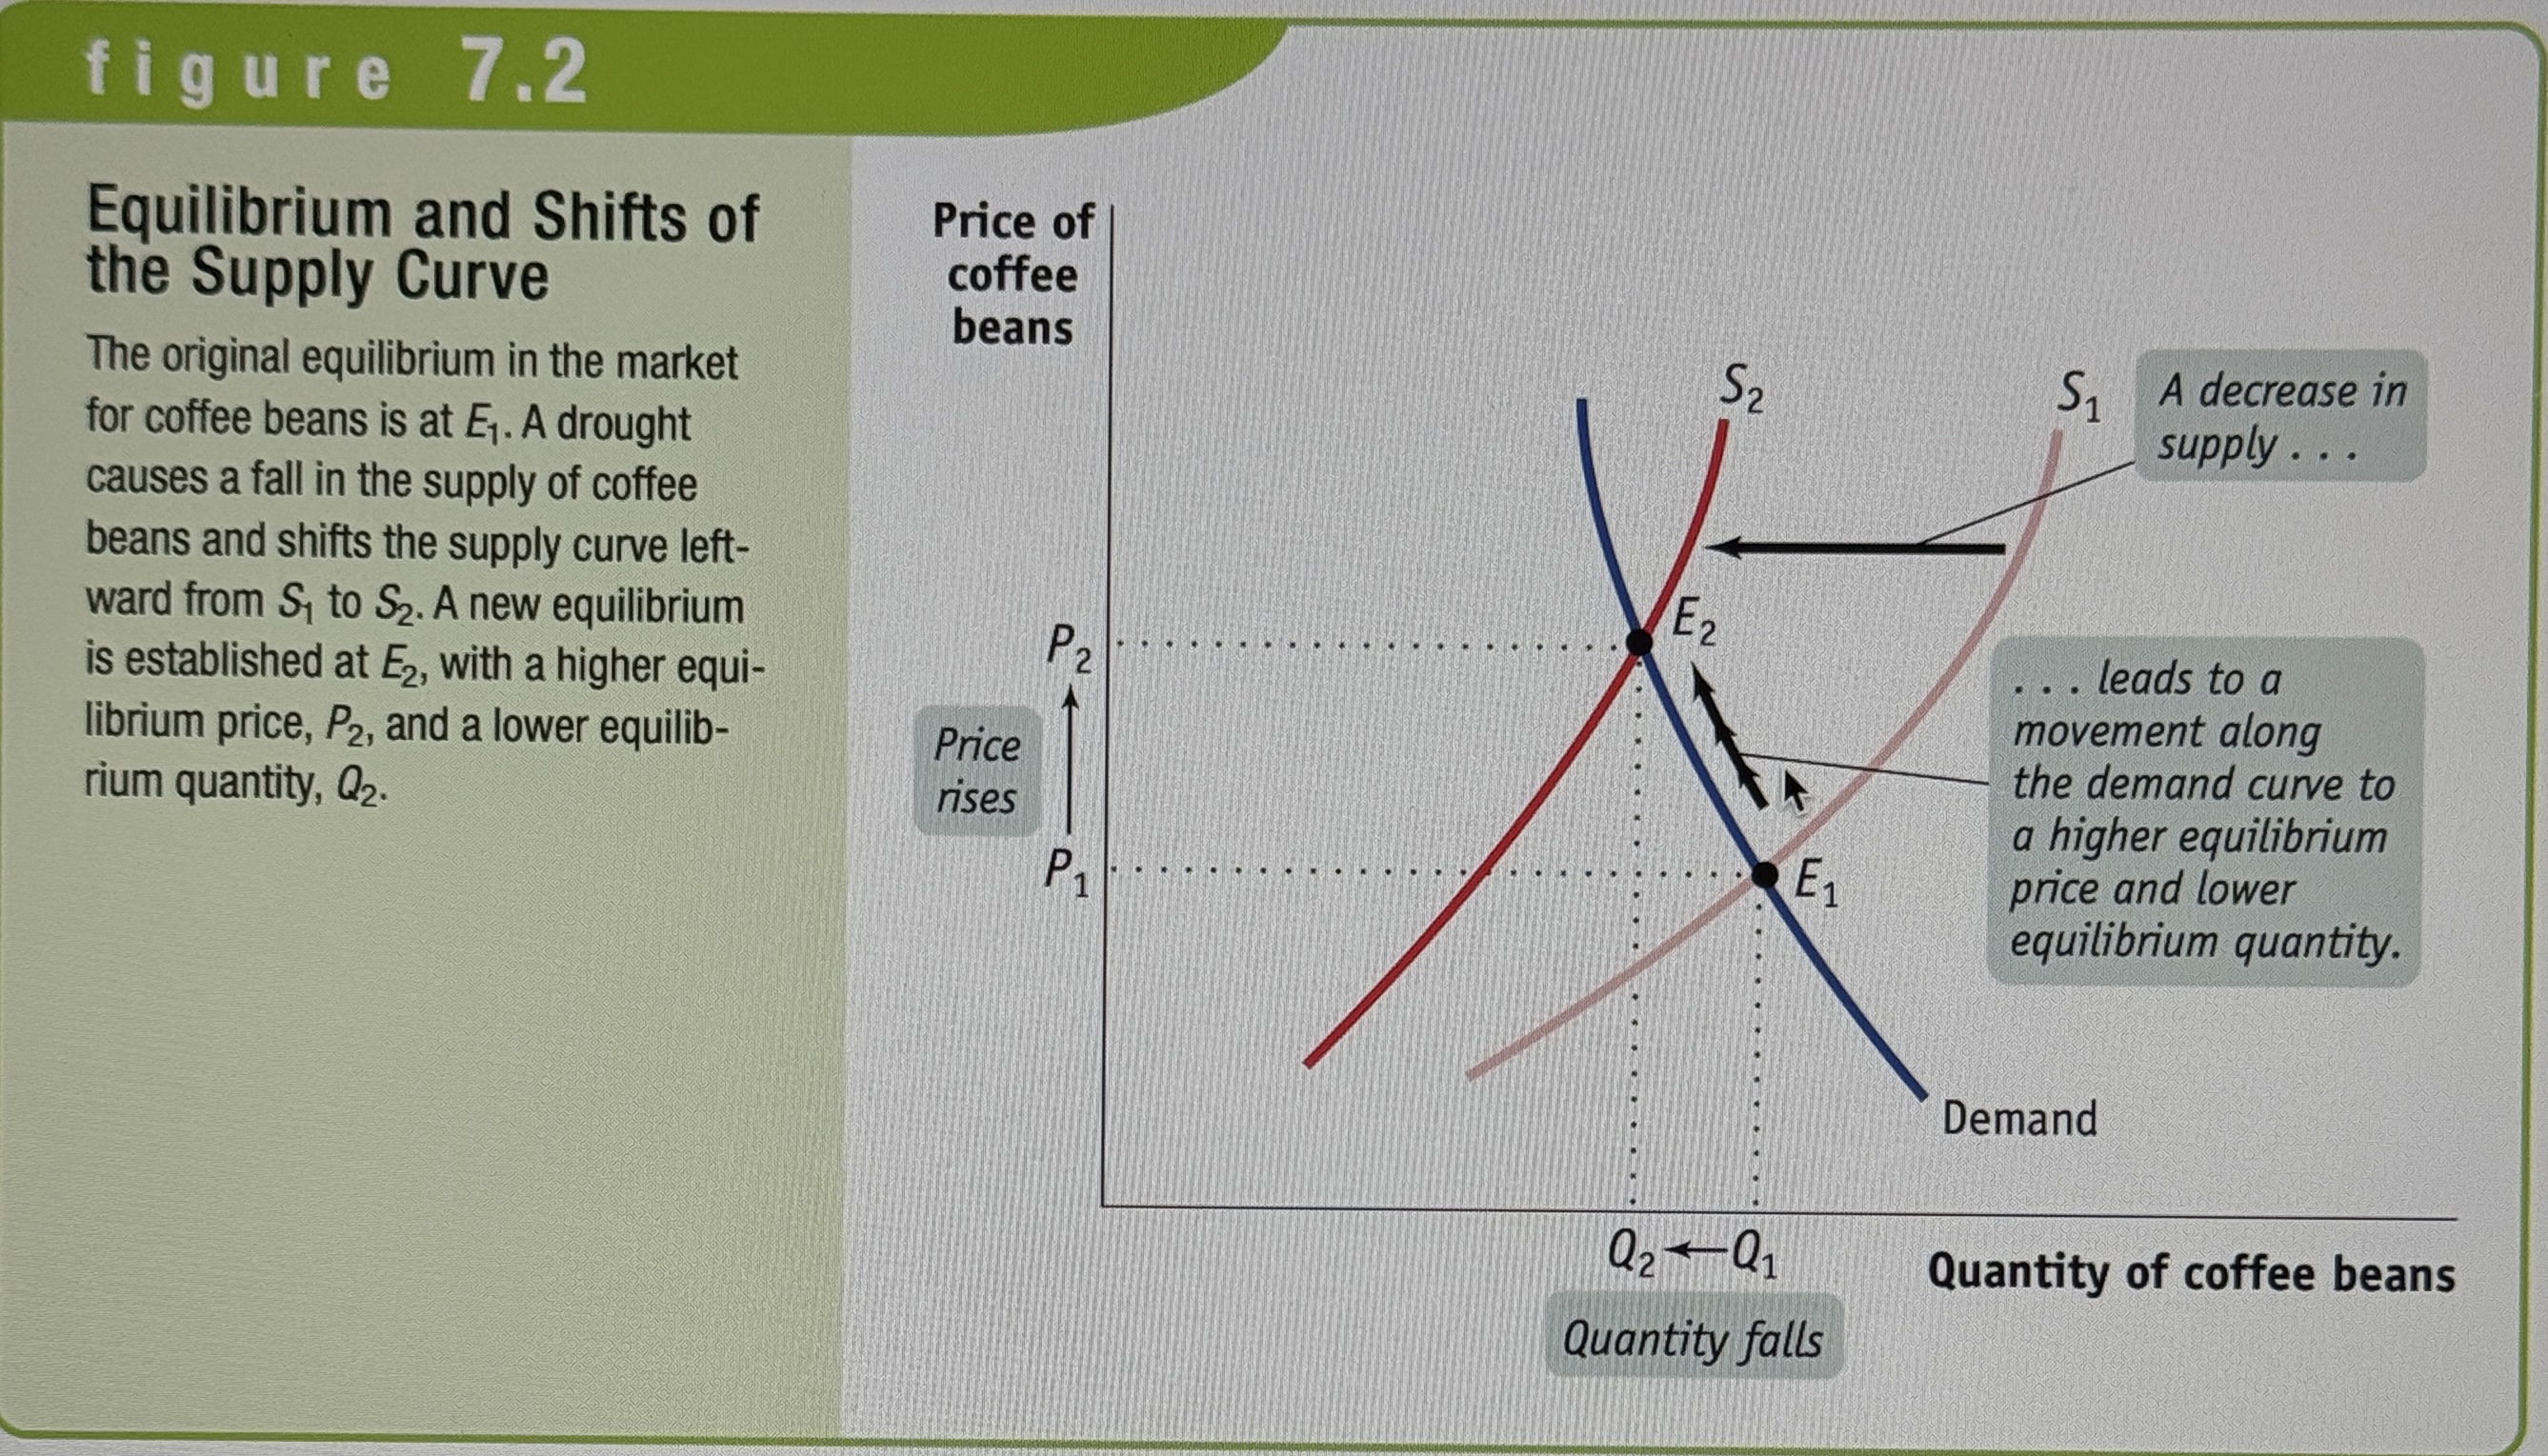
Equilibrium and Shifts on the Supply Curve
Ex.
Simultaneous Shifts of the Demand and Supply Curve
Ex.
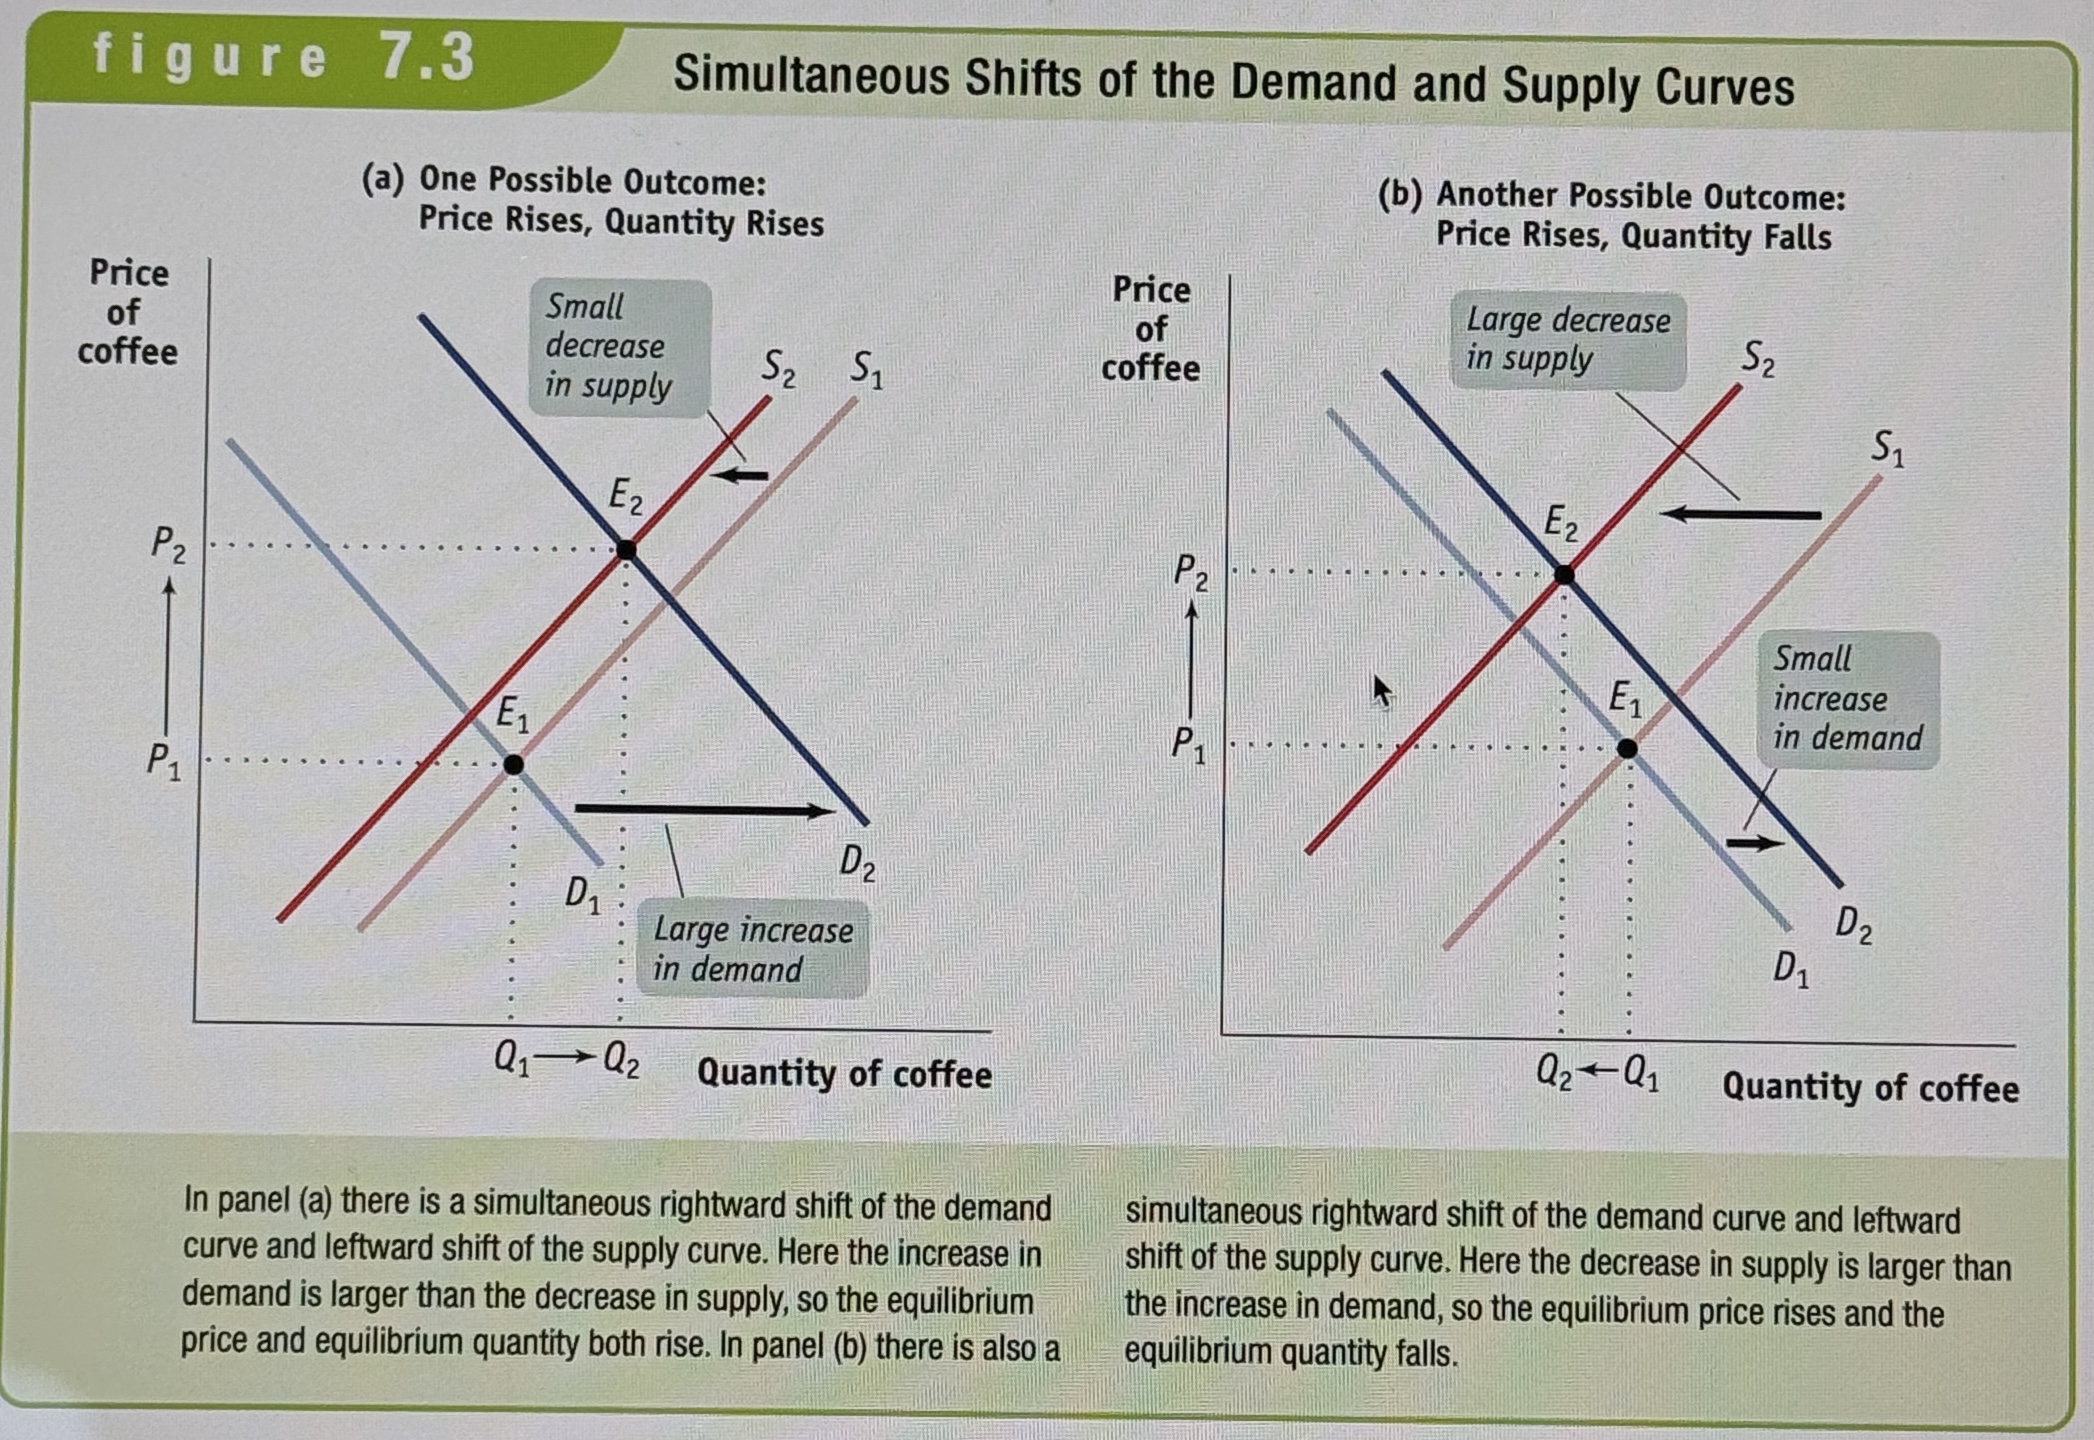
Every Possible Outcome for Simultaneous Shifts
When demand increases and supply decreases, the equilibrium price rises but the change in the equilibrium quantity is ambiguous.
When demand decreases and supply increases, the equilibrium price falls but the change in the equilibrium quantity is ambiguous.
When both demand and supply increase, the equilibrium quantity increases but the change in equilibrium price is ambiguous.
When both demand and supply decrease, the equilibrium quantity decreases but the change in equilibrium price is ambiguous.
Price Controls
Legal restrictions on how high or low a market price may go.
Price Ceiling
A maximum price sellers are allowed to charge for a good or service.
Price Floor
A minimum price buyers are required to pay for a good or service.
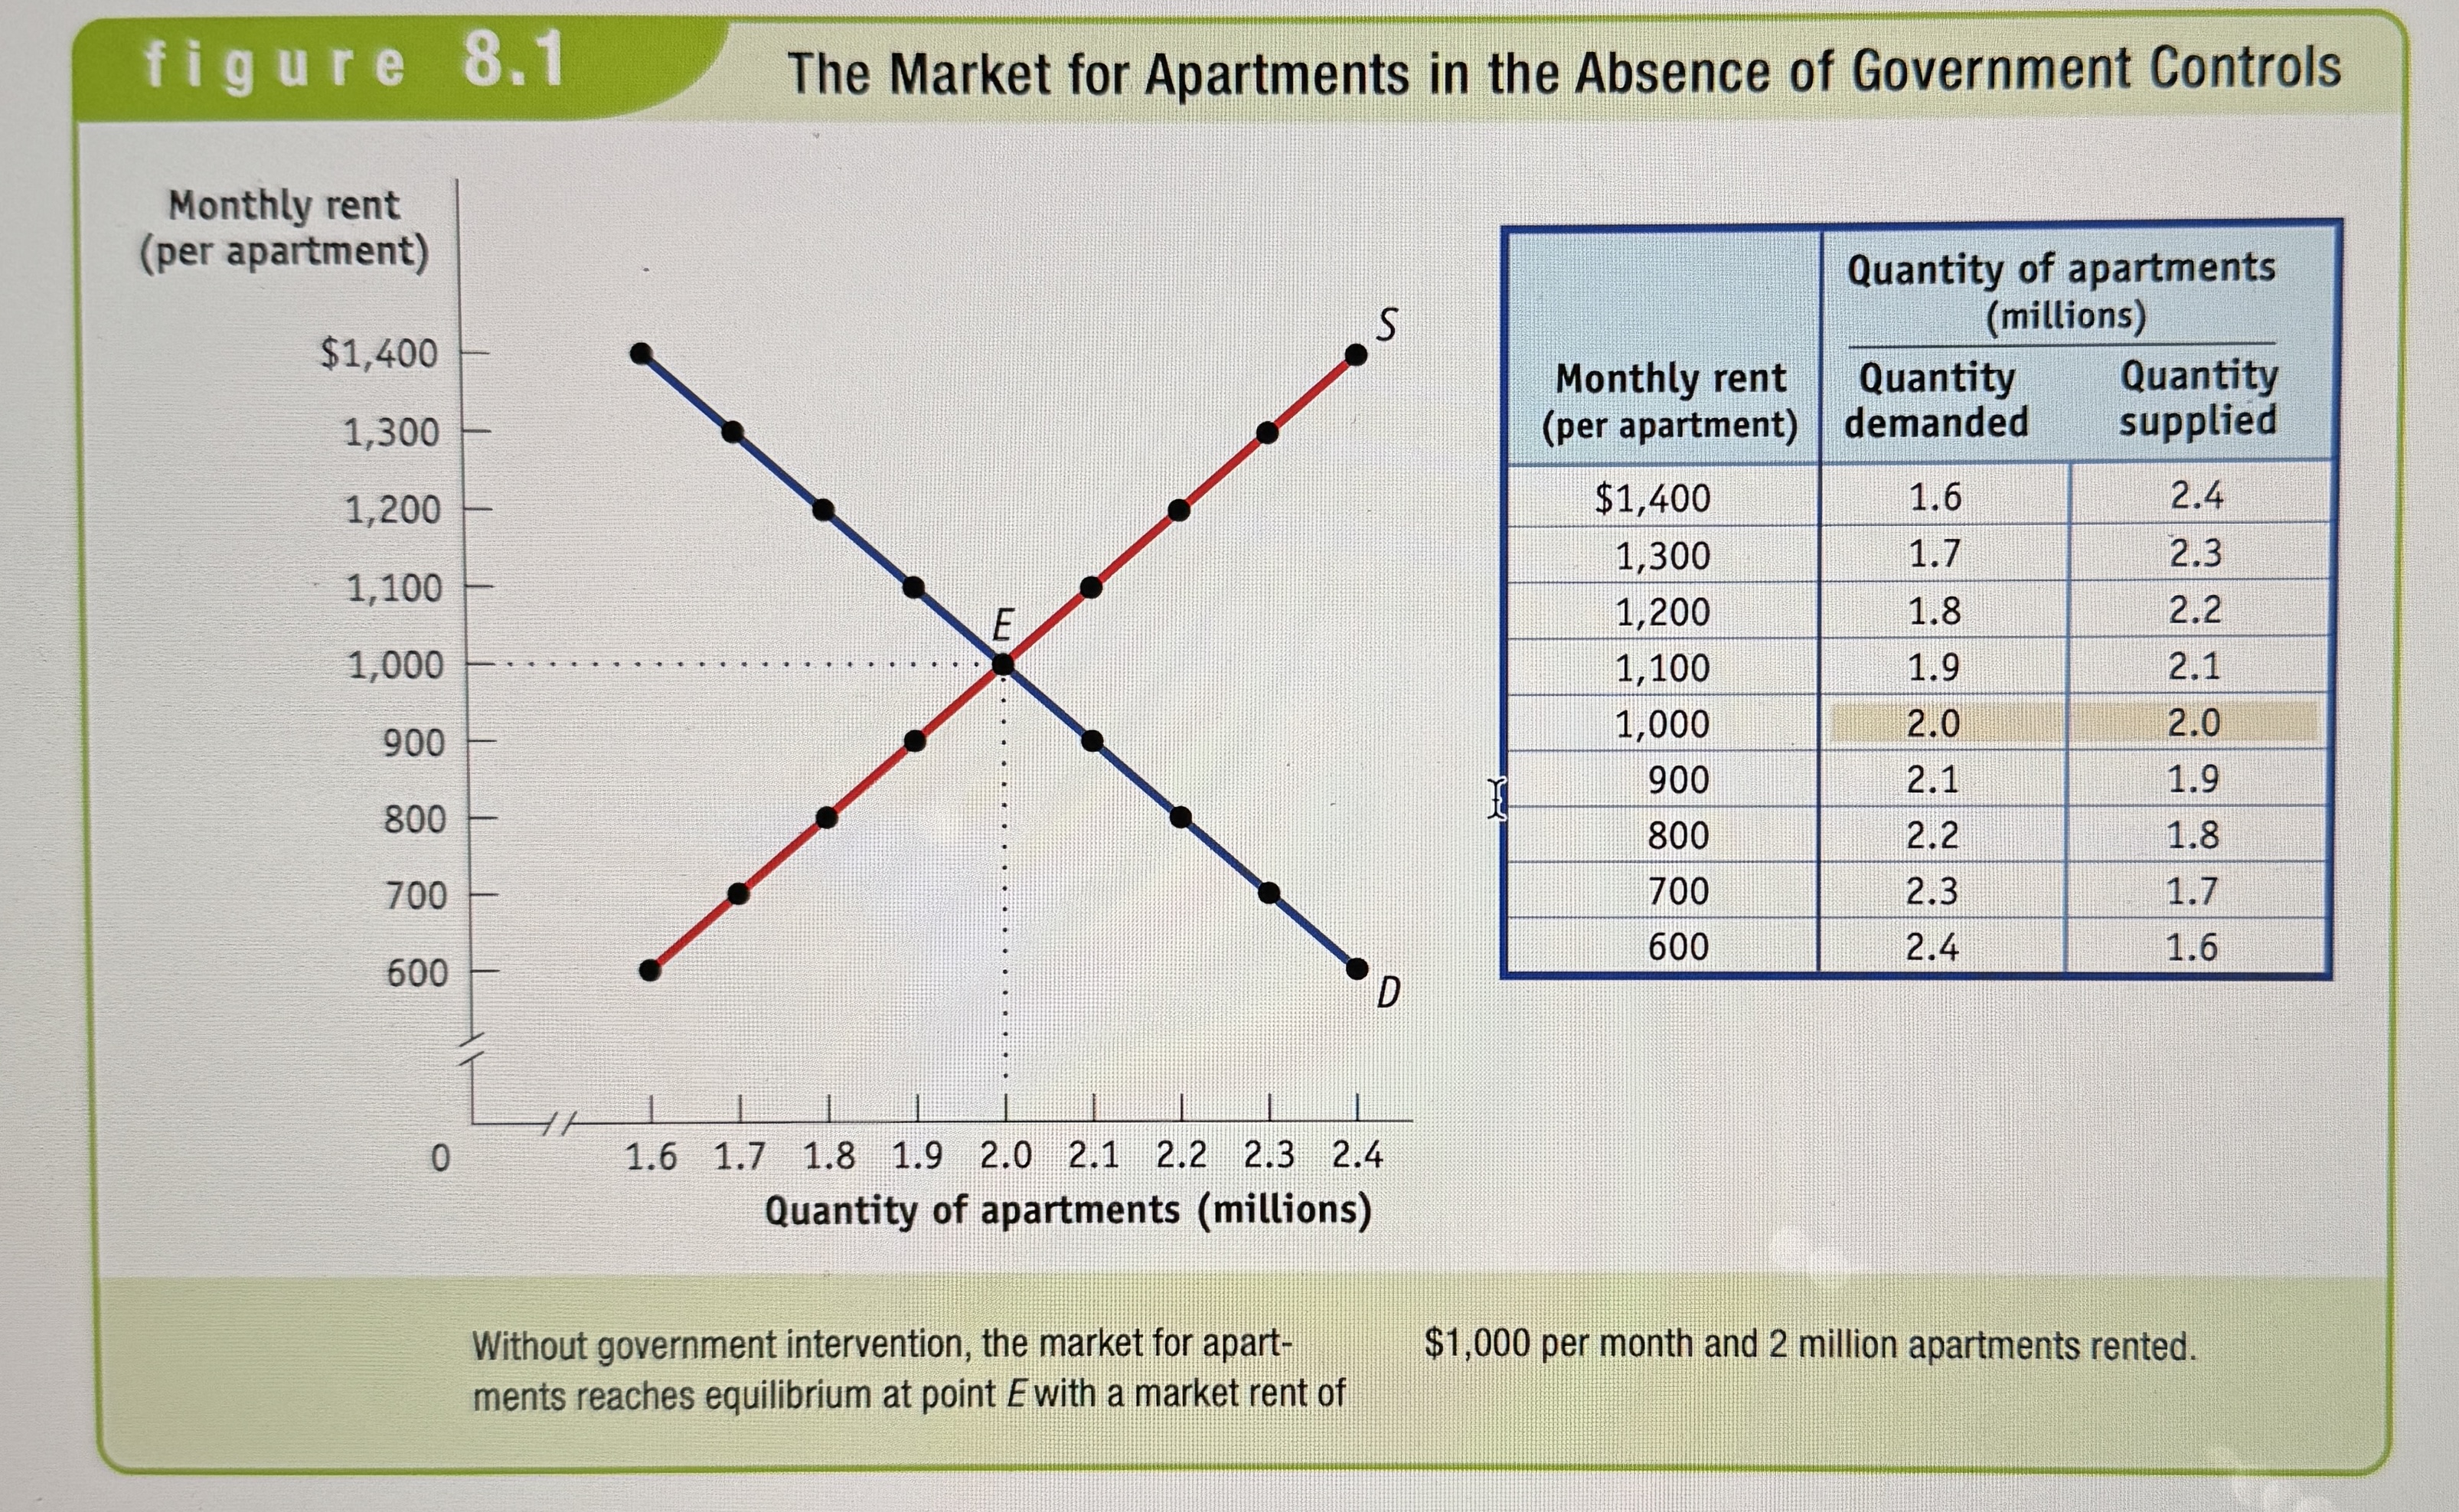
The Apartment Market without Government Controls (For Context)
Ex.
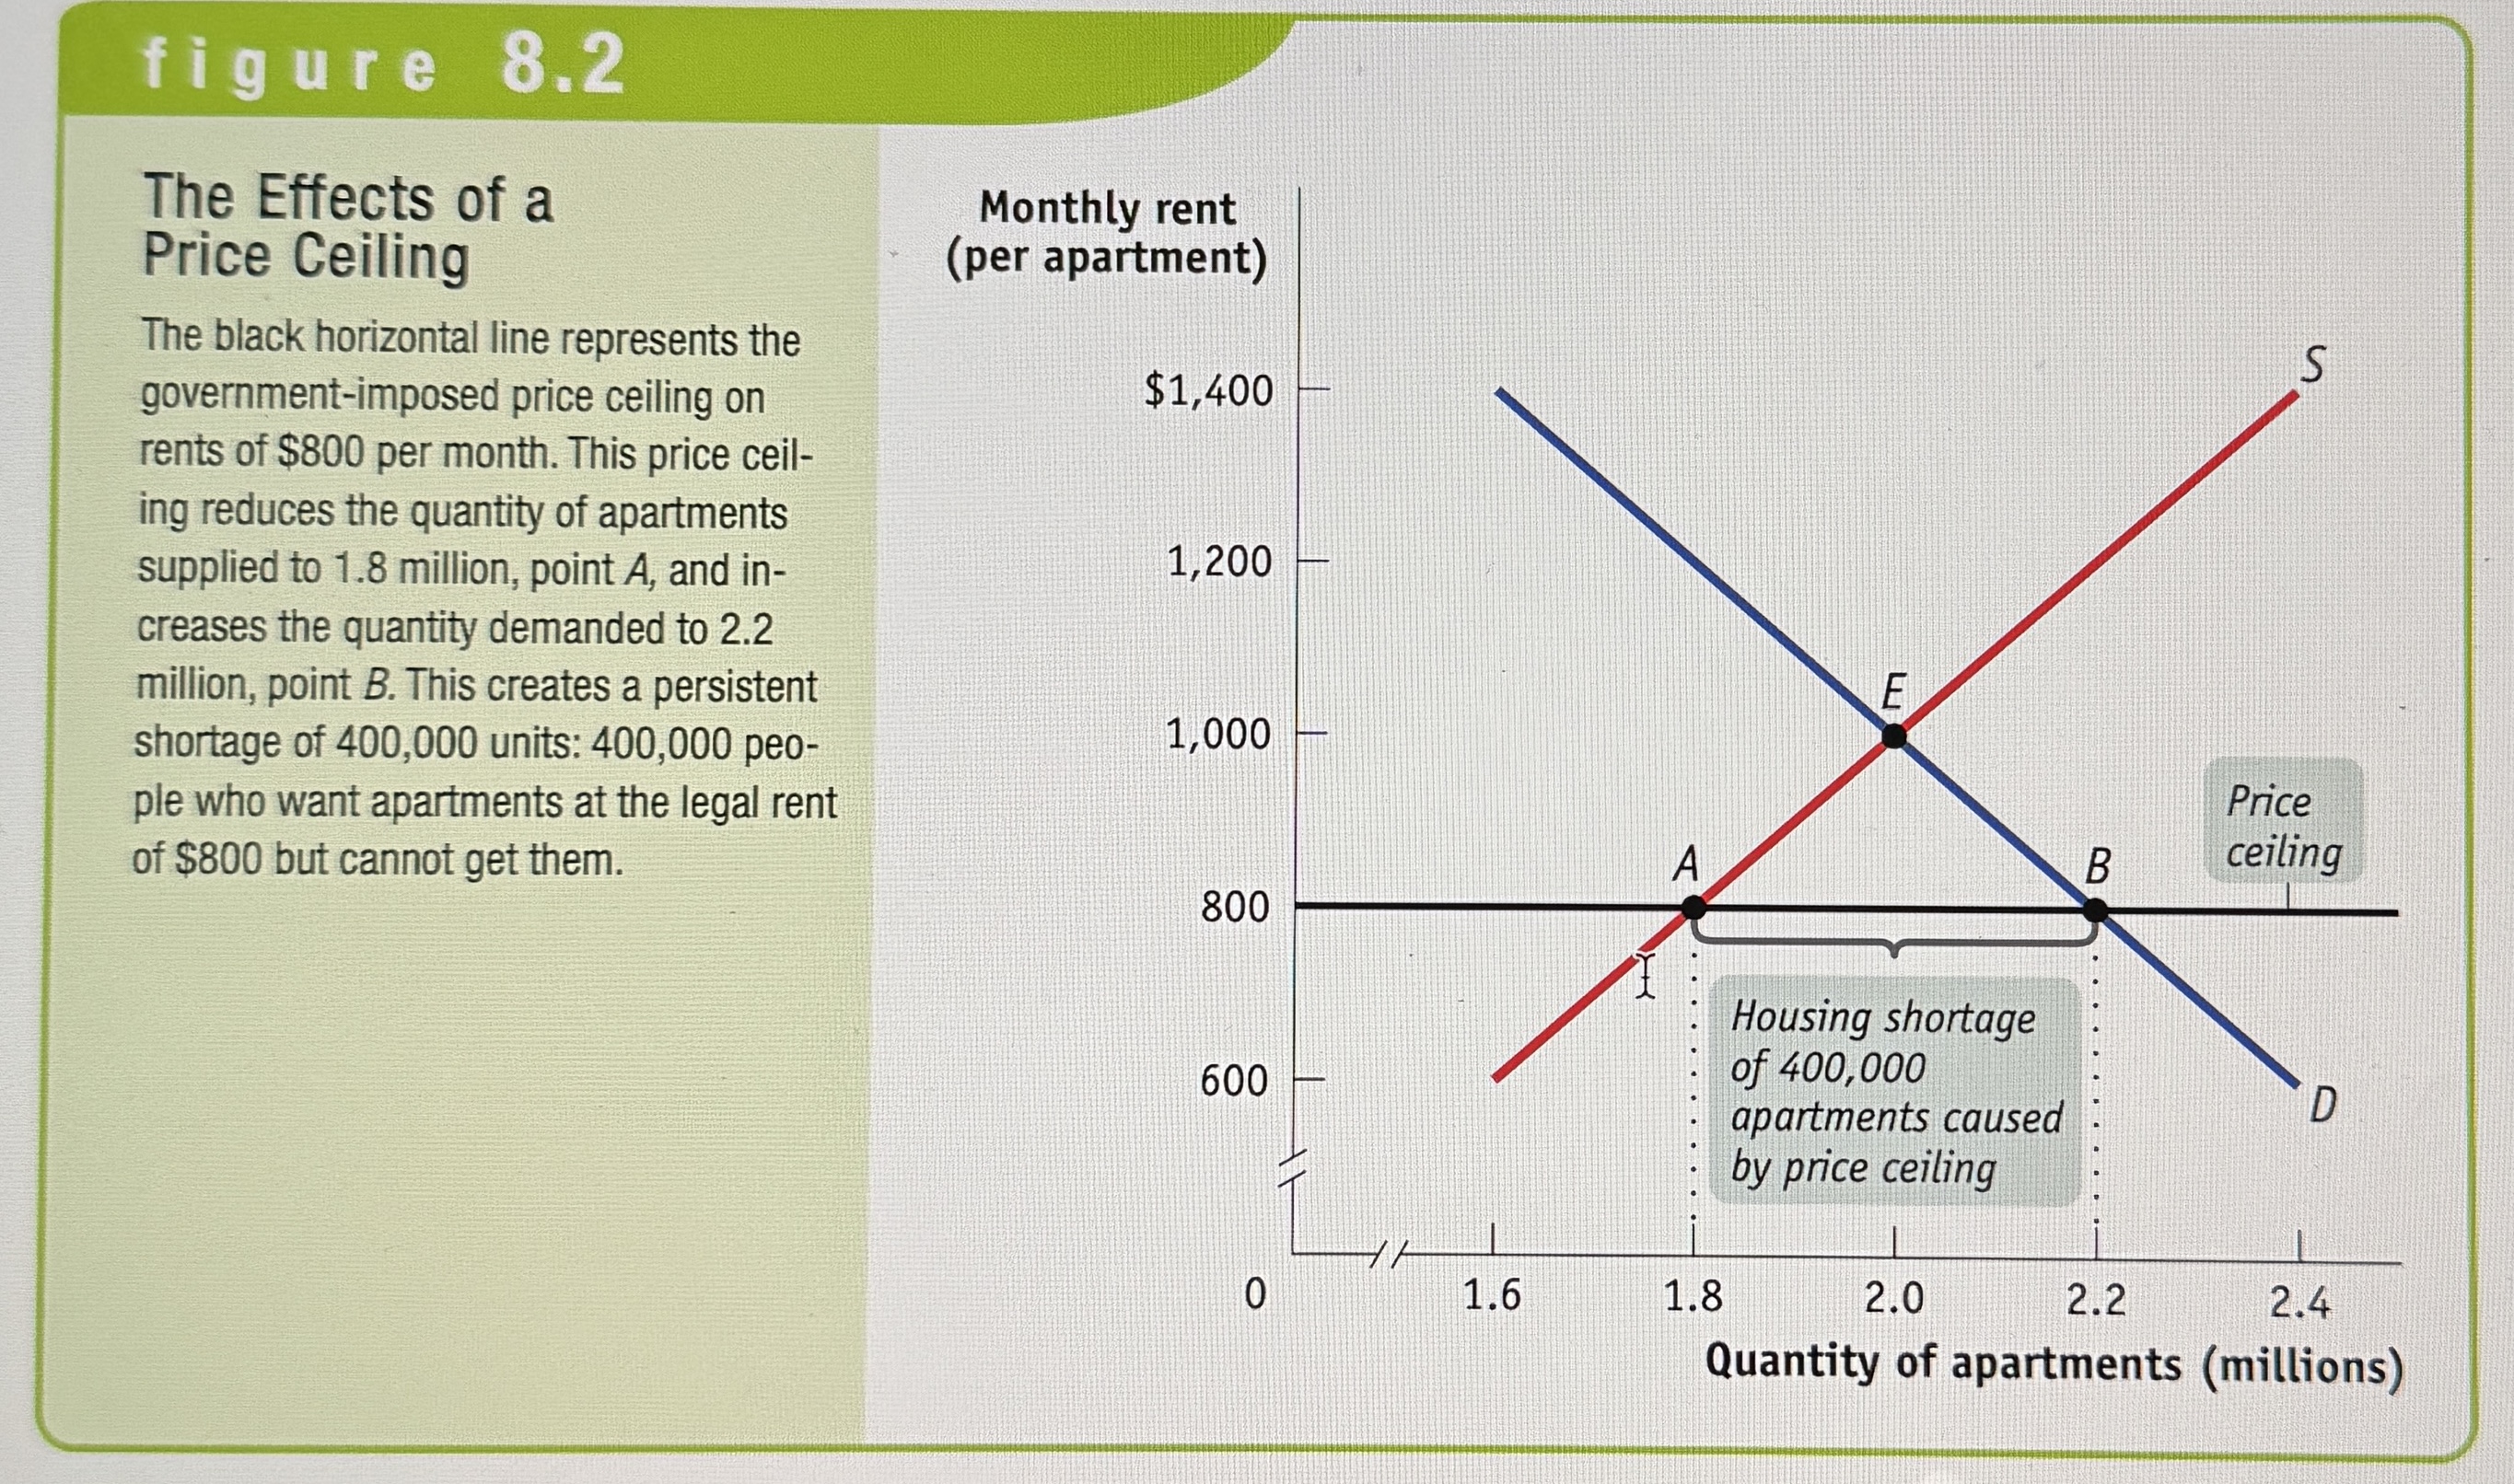
The Effects of Price Ceilings
Ex.
What inefficiencies do Price ceilings lead to?
Price ceilings often lead to inefficiency in the form of inefficient allocation to consumers: people who want the good badly and are willing to pay a high price don't get it, and those who care relatively little about the good and are only willing to pay a relatively low price do get it.
Price ceilings typically lead to inefficiency in the form of wasted resources: people expend money, effort, and time to cope with the shortages caused by the price ceiling.
Price ceilings often lead to inefficiency in that the goods being offered are of inefficiently low quality: sellers offer low quality goods at a low price even though buyers would prefer a higher quality at a higher price.
Finally, they can lead to a black market which is a market in which goods or services are bought and sold illegally-either because it is illegal to sell them at all or because the prices charged are legally prohibited by a price ceiling.
So why are there Price Ceilings?
Price ceilings are implemented to protect consumers from high prices and to make essential goods and services more affordable, especially during crises or shortages.
Minimum Wage
A type of price floor made by the government that limits the minimum amount of money workers can be payed.
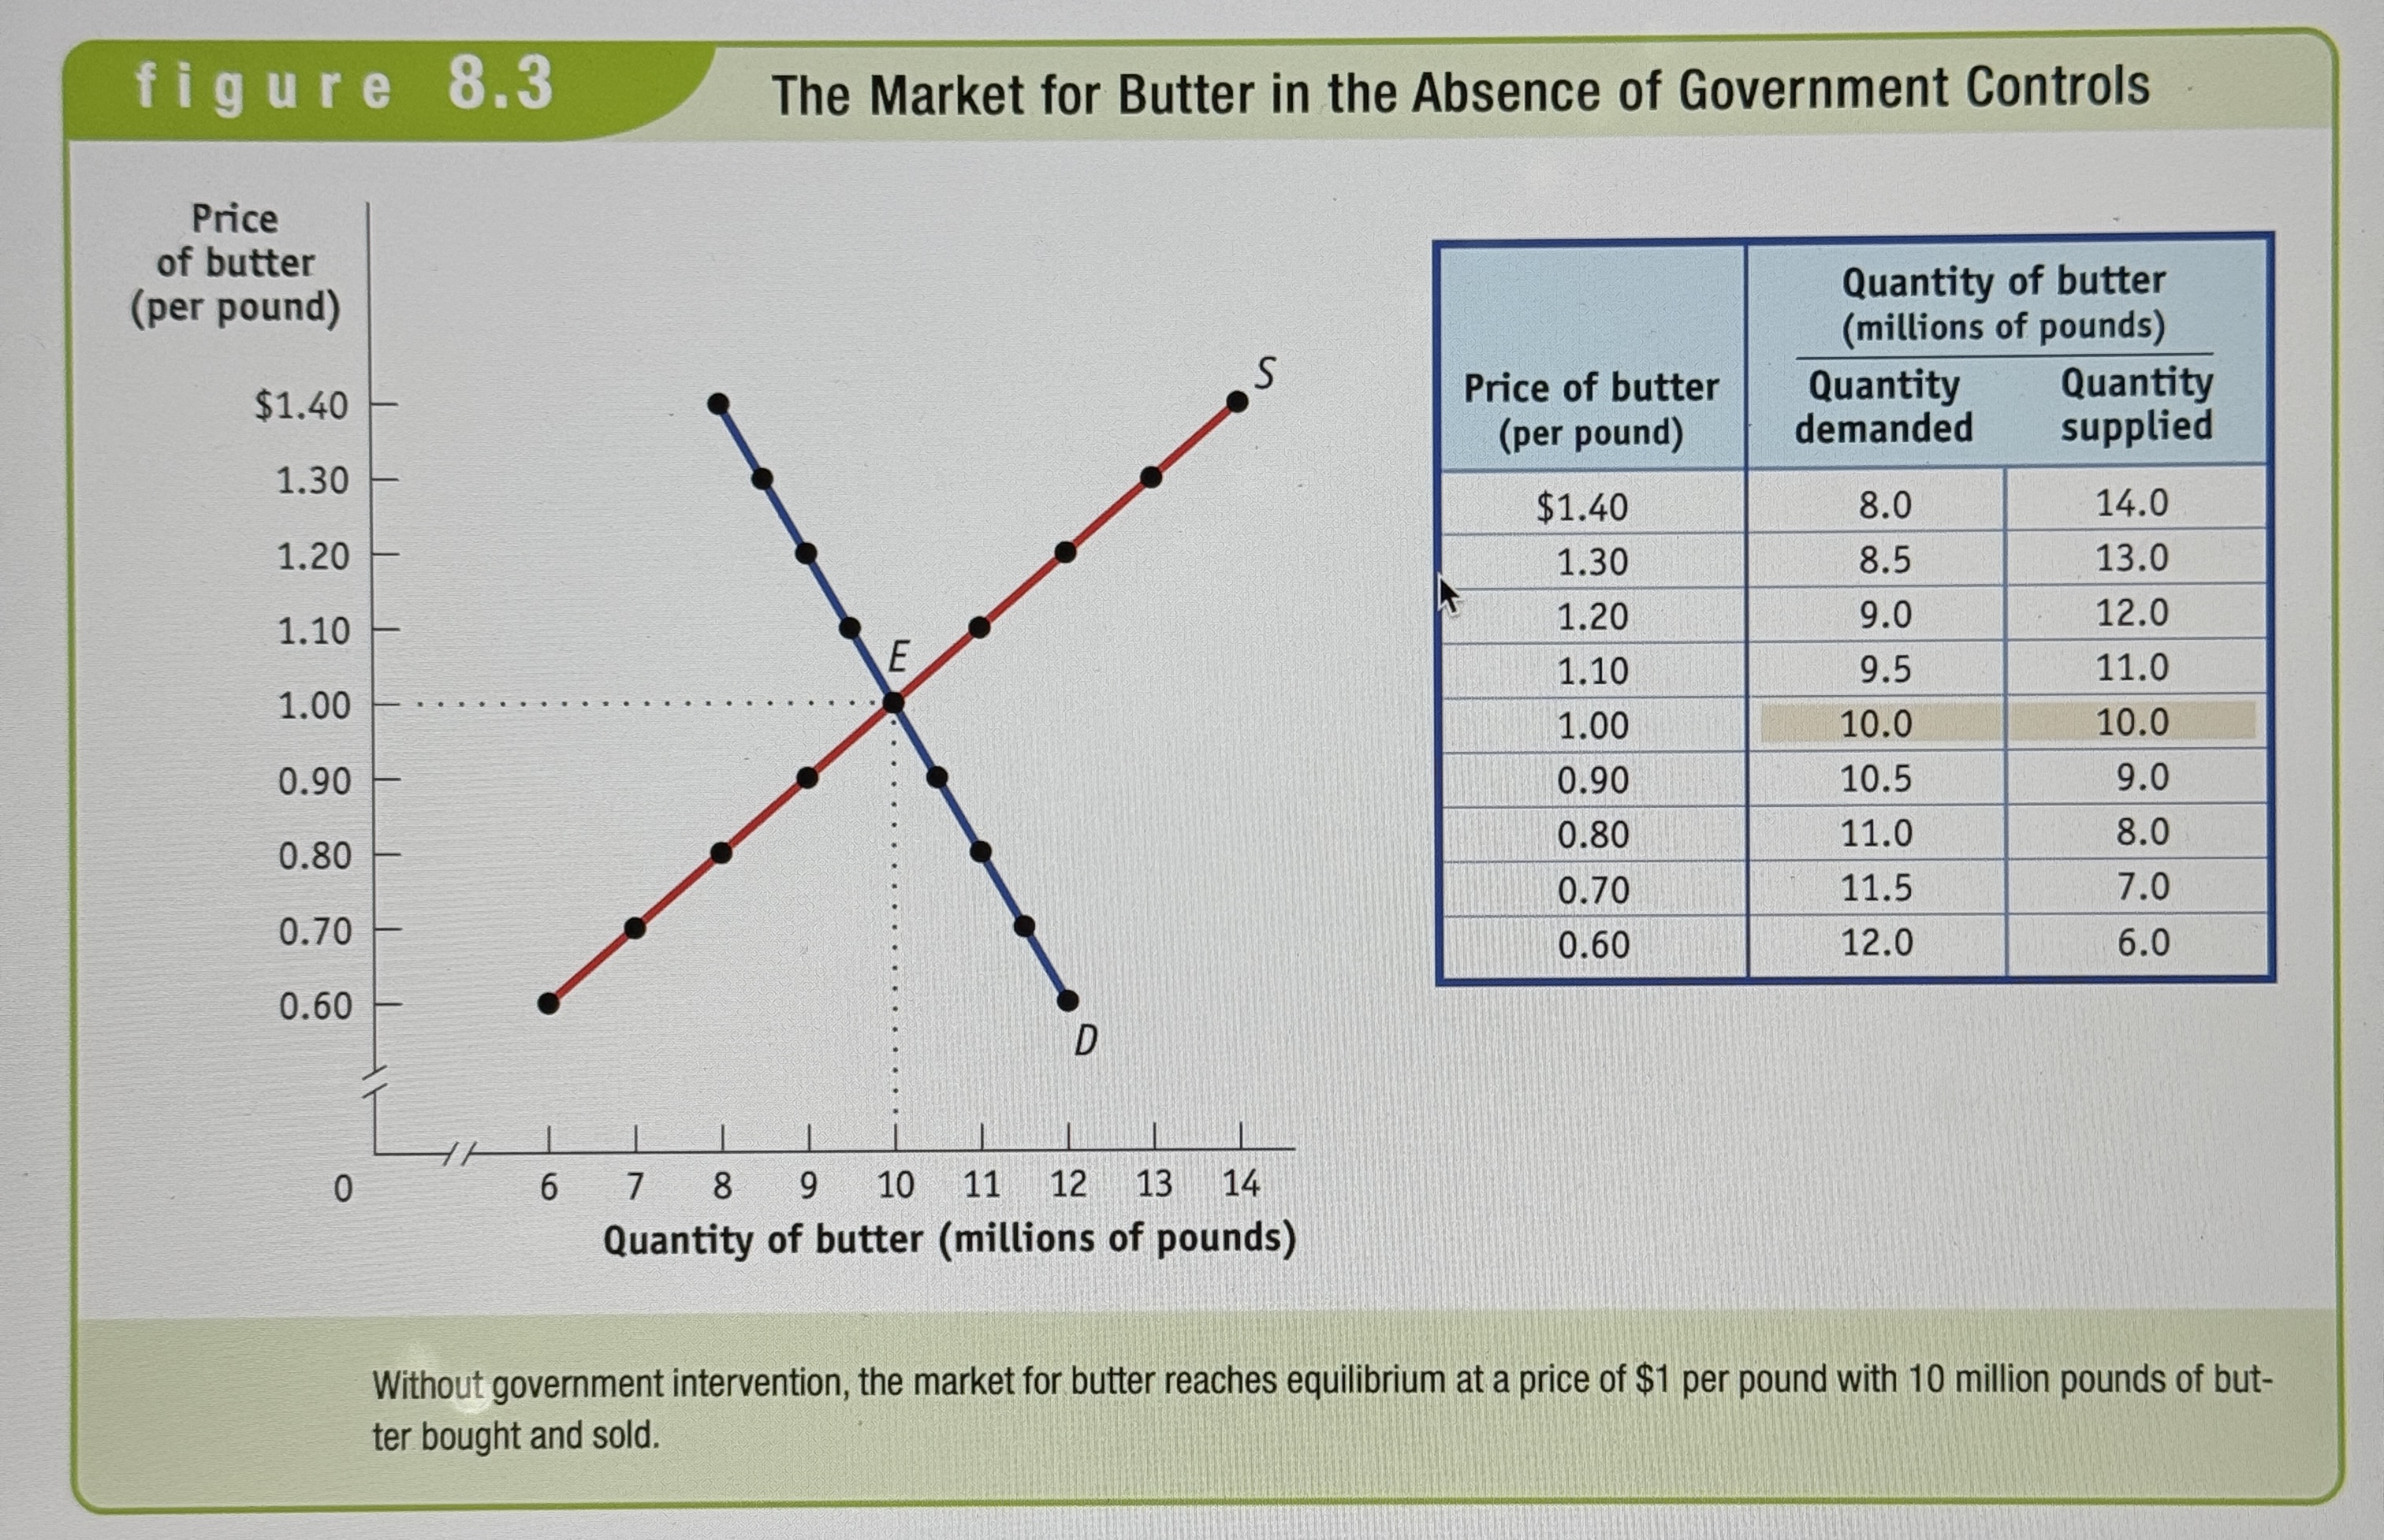
The Butter Market without Government Controls (For Context)
Ex.
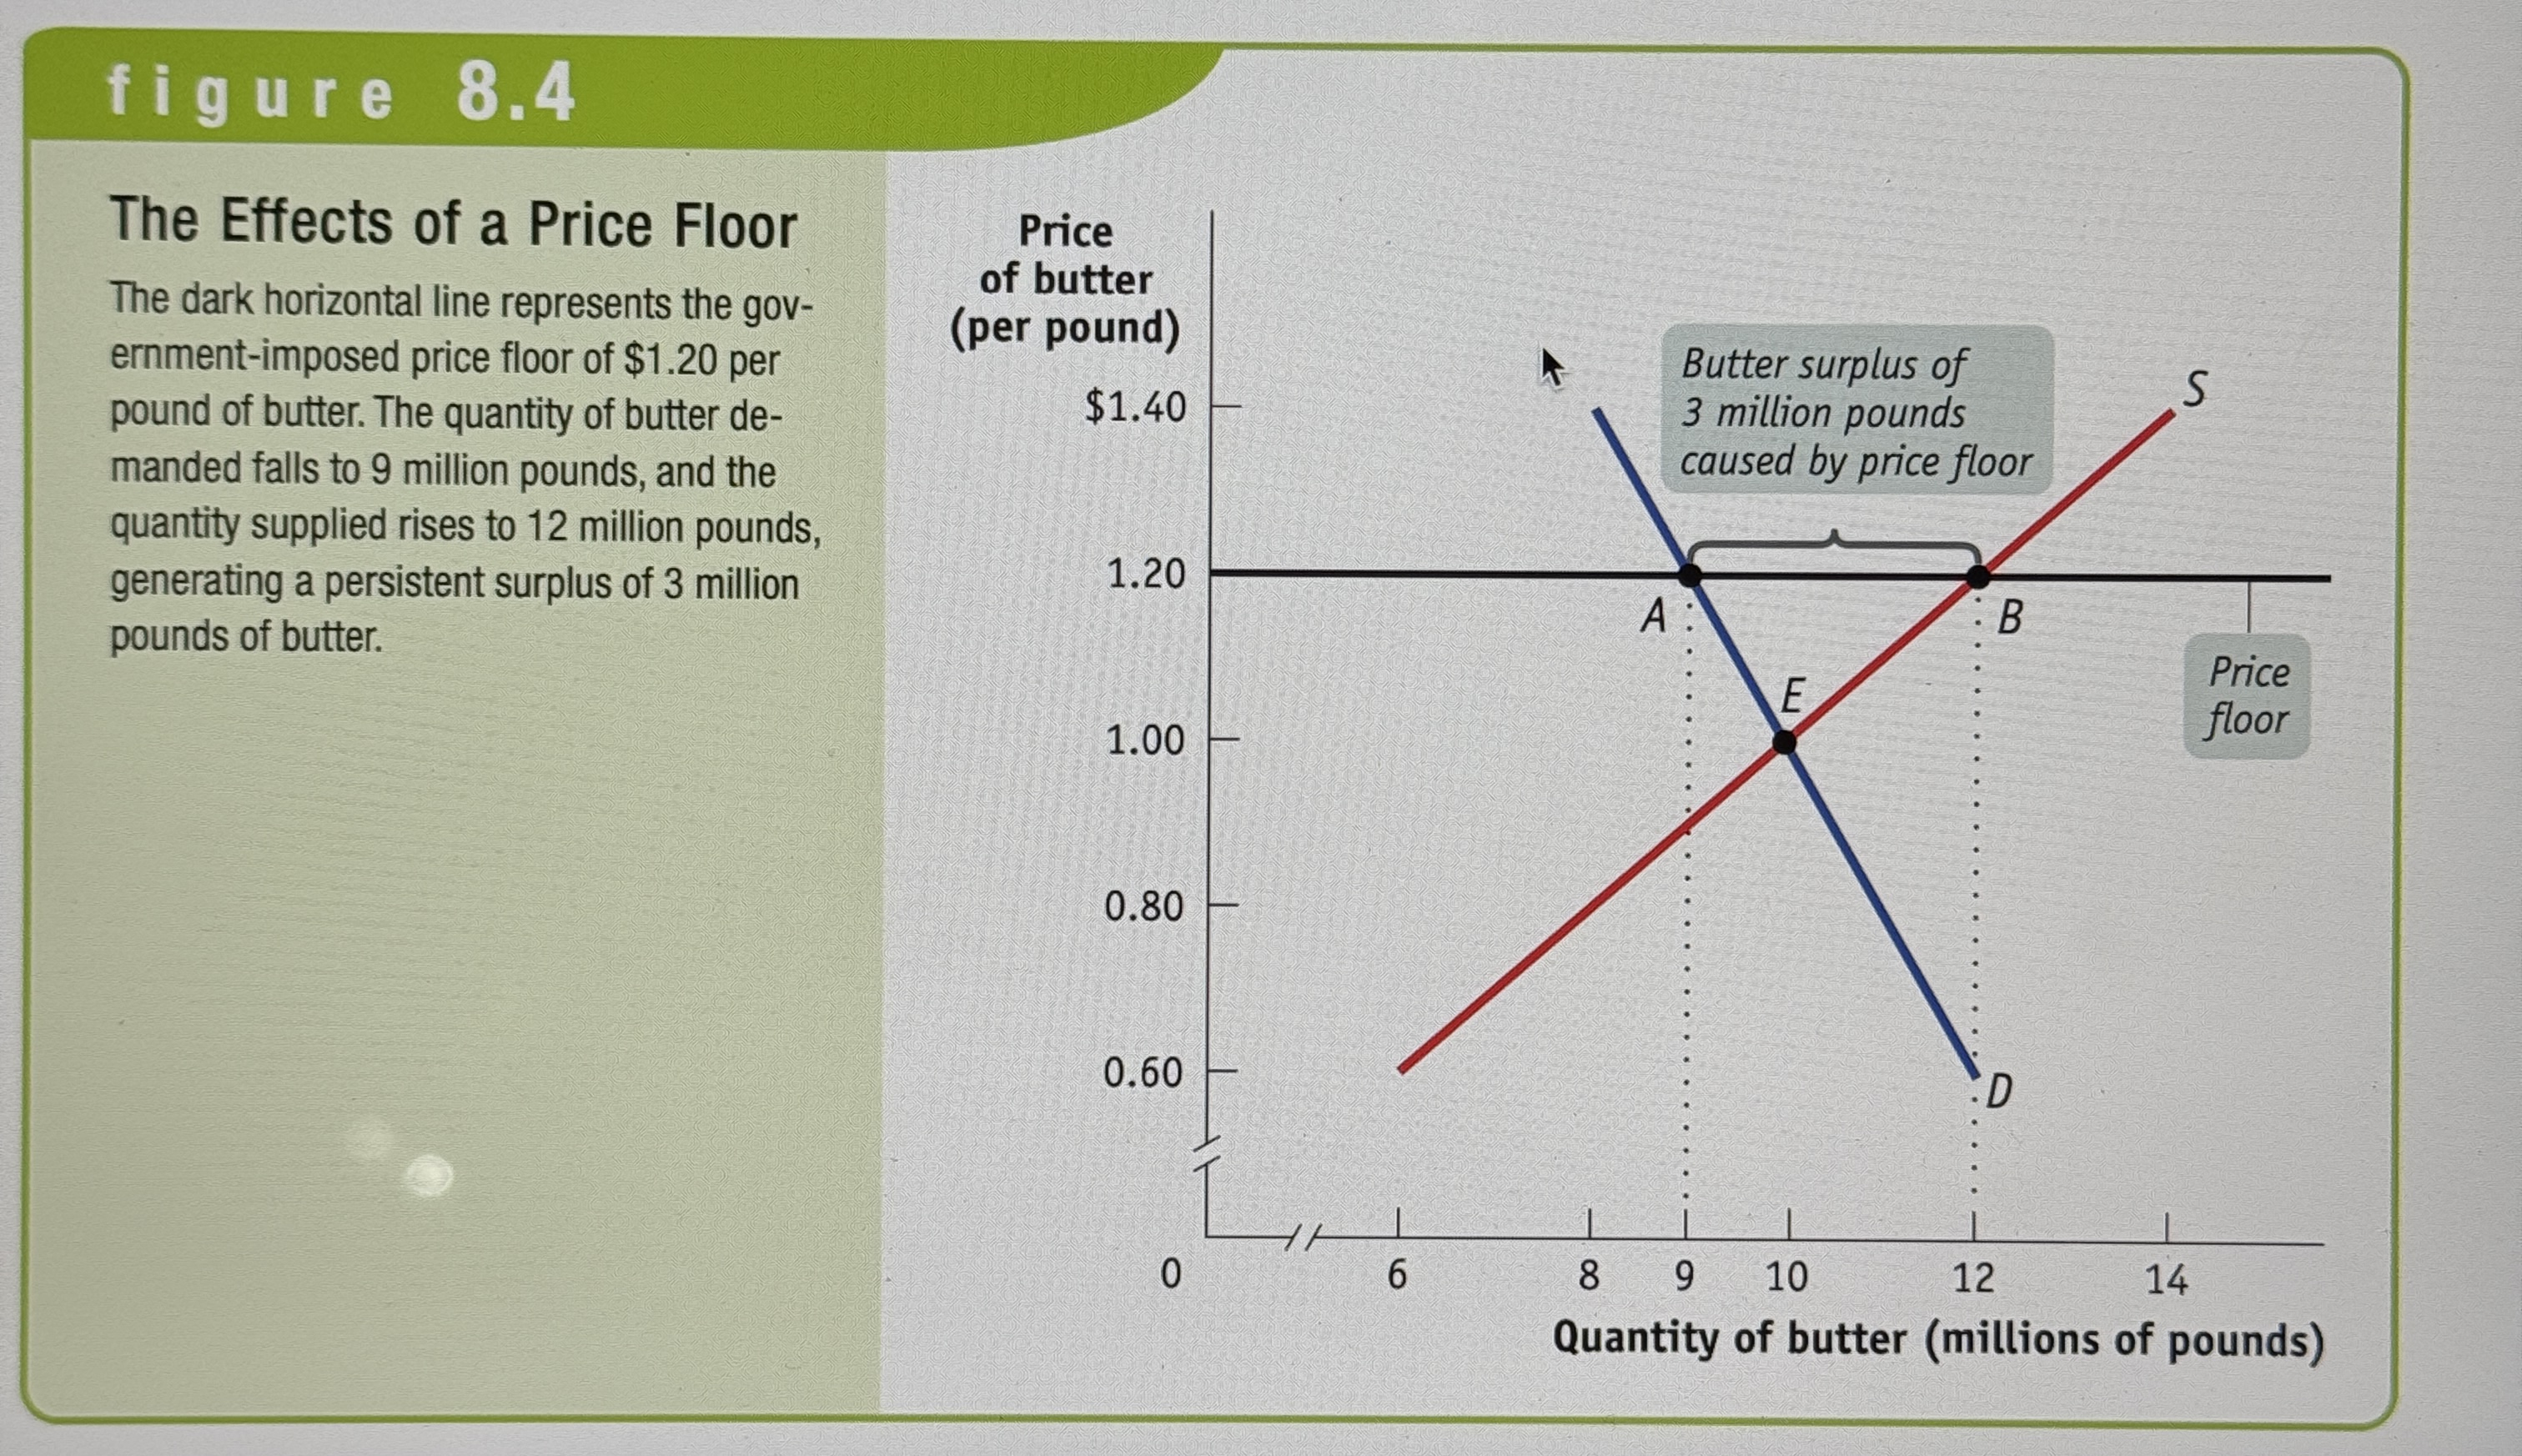
The Effects of Price Floors
Ex.
What inefficiencies do Price floors lead to?
Inefficiency Low Quantity because suppliers are selling the product for more, the demand for it is decreased resulting in less supply.
Price floor typically lead to inefficiency in the form of wasted resources: people expend money, effort, and time to cope with the shortages caused by the price floor.
Price floors lead to inefficient allocation of sales among sellers: those who would be willing to sell the good at the lowest price are not always those who manage to sell it.
Price floors often lead to inefficiency in that goods of inefficiently high quality are offered: sellers offer high-quality goods at a high price, even though buyers would prefer a lower quality at a lower price.
Also finally, price floors can lead to illegal black markets for selling cheaper goods.
So why are there Price Floors?
Price floors are implemented to ensure that a minimum price is paid for goods and services, protecting producers' incomes and ensuring they can cover production costs.
Quantity Control/ Quota
An upper limit on the quantity of some good that can be bought or sold.
License
Gives an owner the right to supply a good or service.
Demand Price
The price consumers will demand that quantity.
Supply Price
The price at which producers will supply that quantity.
The Taxi Market without Government Controls (For Context)
Ex.

The Effect of Quotas
Ex.
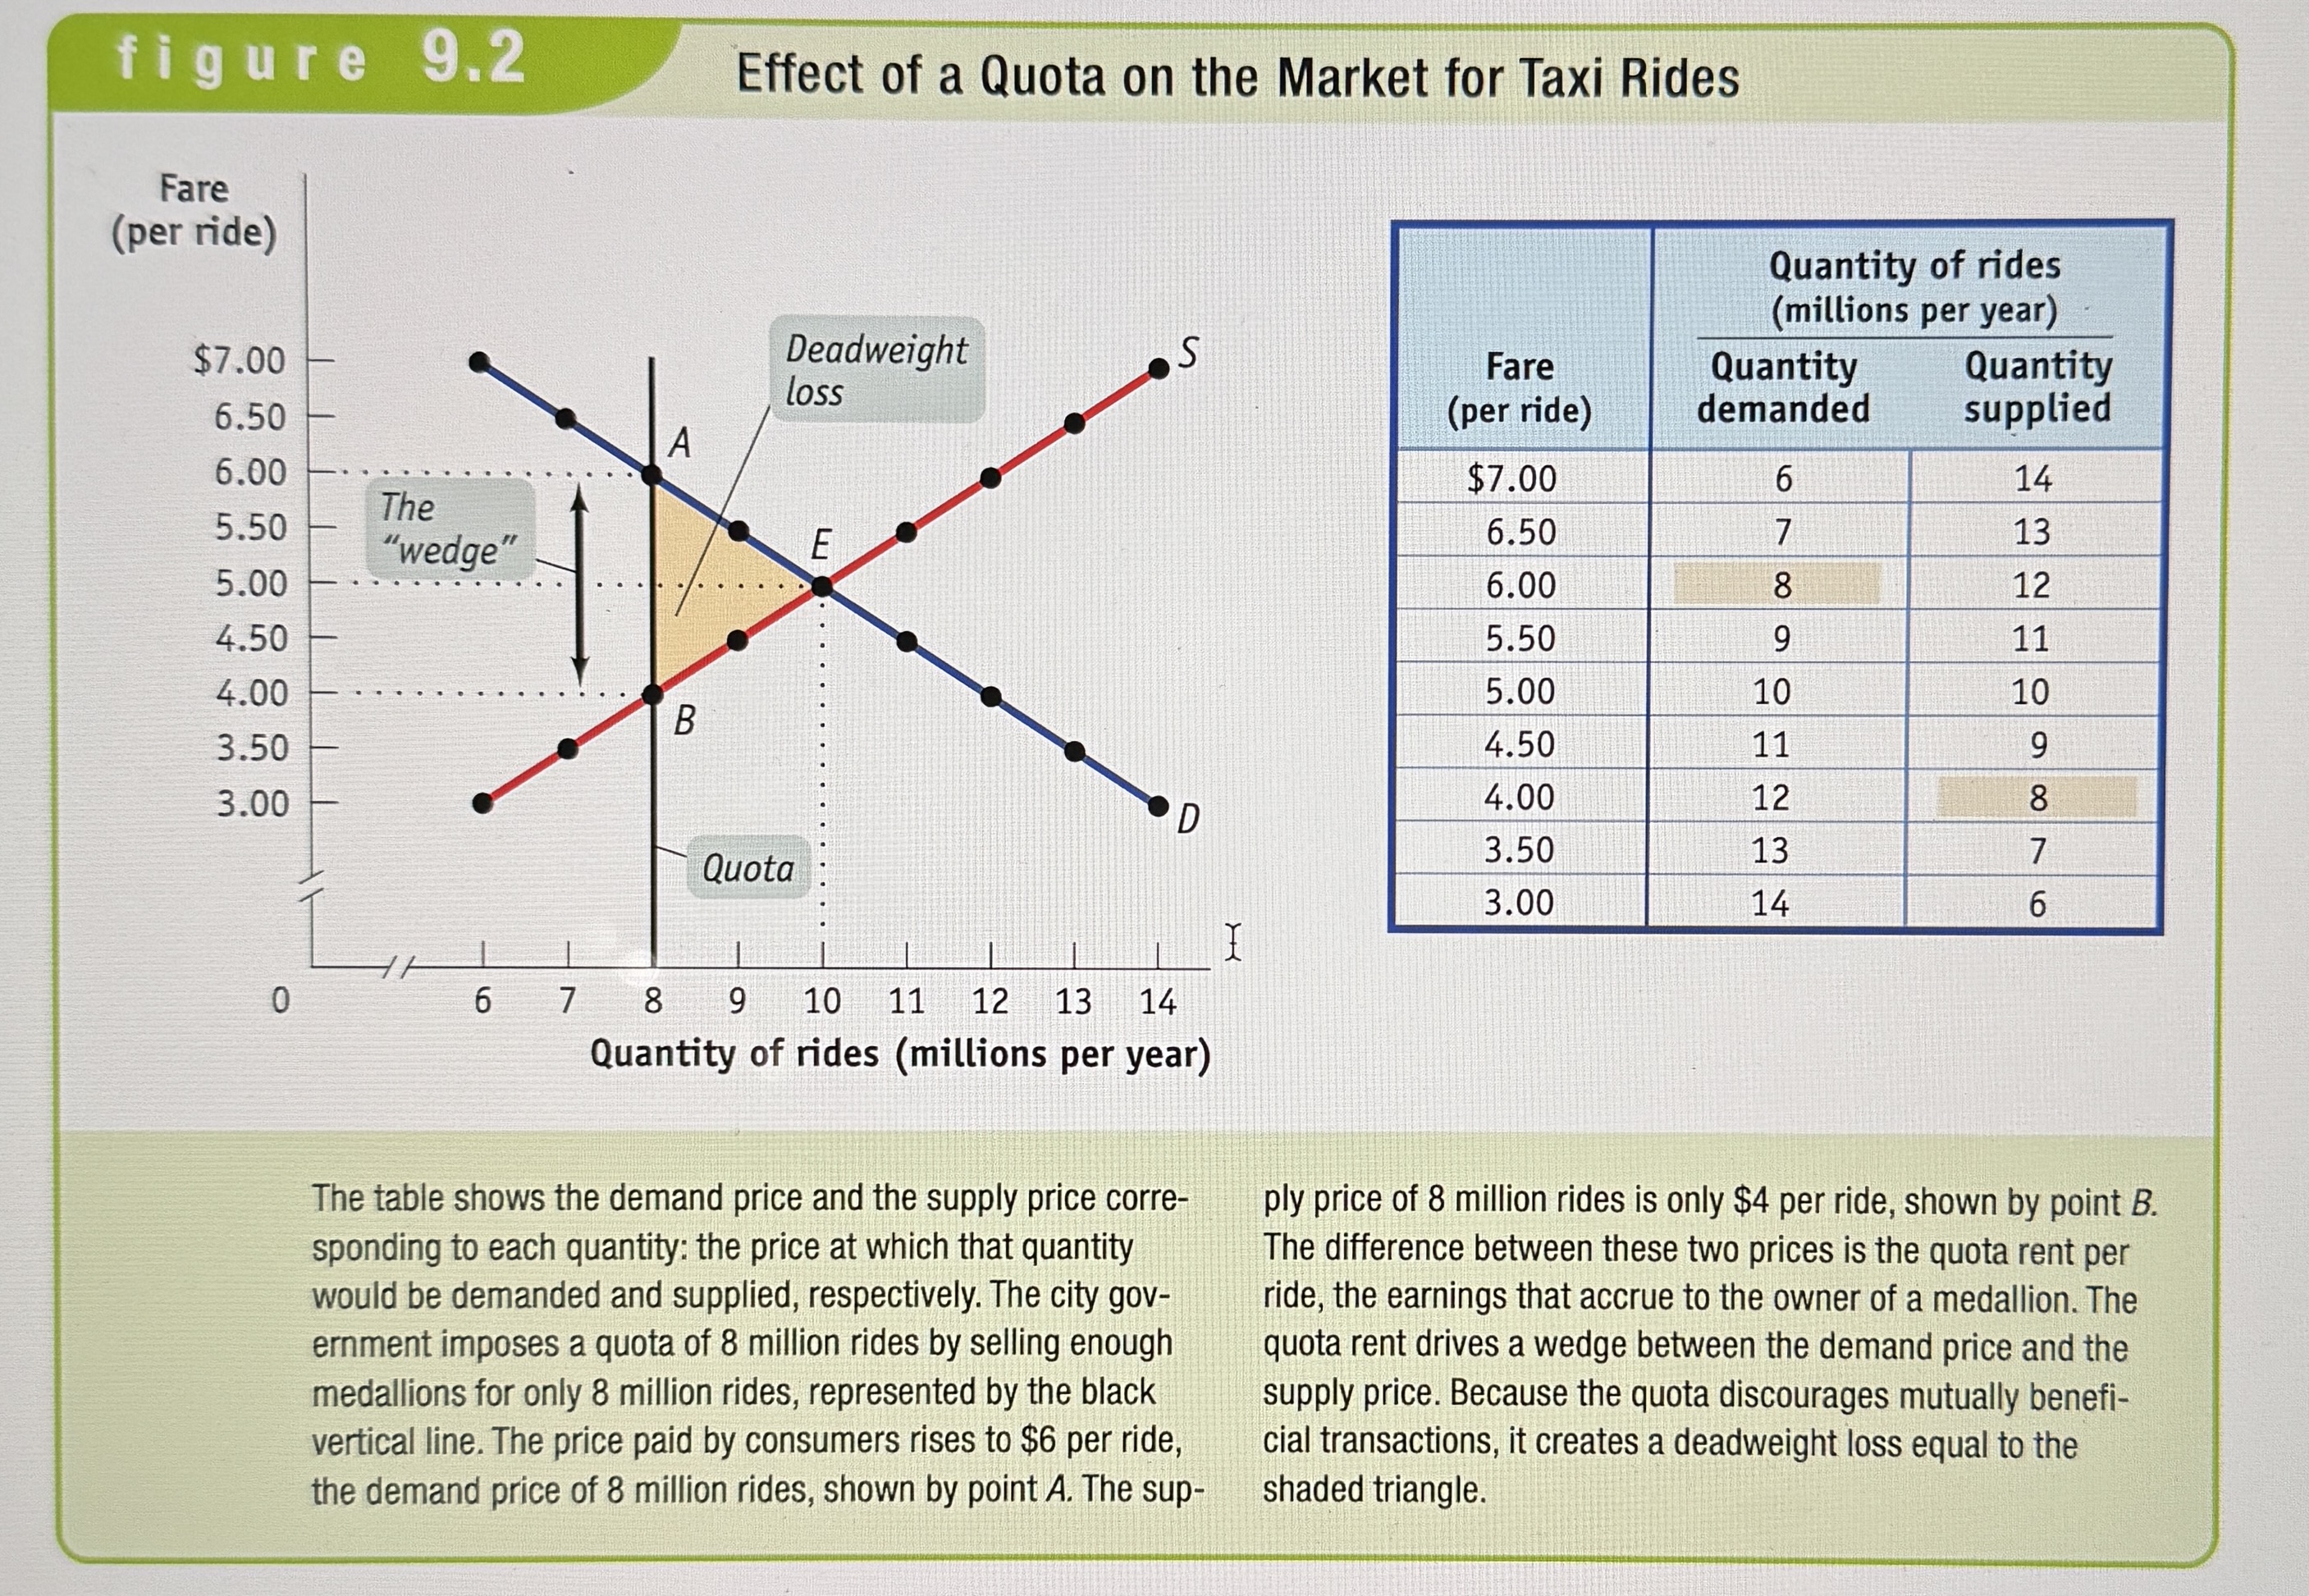
What do quotas cause?
A quantity control, or quota, drives a wedge between the demand price and the supply price of a good; that is, the price paid by buyers ends up being higher than that received by sellers. The difference between the demand and supply price at the quota amount is the quota rent, the earnings that accrue to the license-holder from ownership of the right to sell the good. It is equal to the market price of the license when the licenses are traded.
Deadweight Loss
Deadweight loss is the lost gains associated with transactions that do not occur due to market intervention.