Chapter 8 Human Population Vocabulary Flashcards
1/54
Earn XP
Description and Tags
50 vocabulary flashcards covering key terms and concepts from the notes on human population, demography, IPAT, demographic transition, and related topics.
Name | Mastery | Learn | Test | Matching | Spaced |
|---|
No study sessions yet.
55 Terms
IPAT model
A framework that links total environmental impact (I) to Population (P), Affluence (A), Technology (T), and environmental Sensitivity (S).
I = P x A x T
Total impact = population + affluence + technology
Increase population means more individuals take up space, use resources, and generate space
Population
The number of people in a given area or in the world.
Affluence
Leads to greater per capita resource consumption (footprint)
increased resource consumption when population increases
Technology
Tools and methods that can either magnify or reduce environmental impact.
Sensitivity (S)
Vulnerability of a given environment to disturbance or pressure.
can be added to the IPAT model
Demography
The study of population size, distribution, age structure, sex ratios, and birth/death/migration rates.
Principles of population ecology that can be applied to the study of statistical changes in the human population
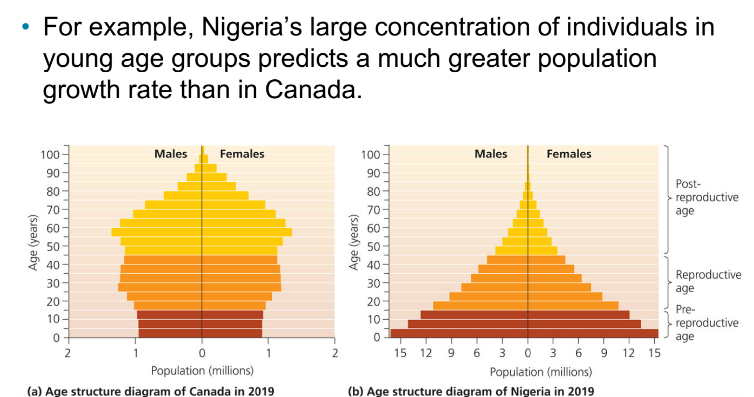
Population pyramid
A graph showing the distribution of a population by age and sex.
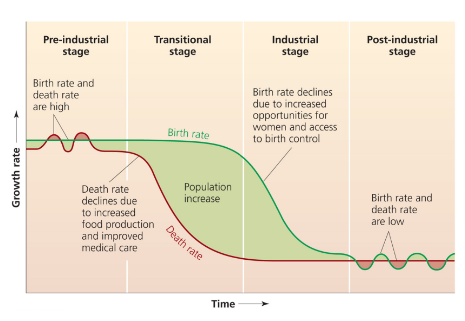
Demographic transition
The shift from high to low birth and death rates as a country develops.
Preindustrial
Stage with high birth and death rates and little population growth.
Transitional
Stage where death rates fall while birth rates remain high, increasing population size.
Industrial
Stage where birth rates decline due to opportunities for women and birth control, slowing growth.
Post-industrial
Stage where population growth stabilizes or declines.
Total Fertility Rate (TFR)
Average number of children a woman would bear in her lifetime.
Replacement fertility is the TFR that keeps the size of the population stable
Industrialization, improved women rights and health care has decreased TRF in many nations
Greater then 2.1 —> increasing population
Less then 2.1 —> decreasing population
Doubling time
Time required for a population to double; roughly 70 divided by the growth rate.
global doubling rate = 70 / growth rate (%)
Exponential growth
Growth at a constant percentage rate, producing rapid increases. Human population growth is going into a logistic curve as resources become limited, leading to a stabilizing effect on the population size.
It occurs when the population size increases rapidly due to abundant resources, typically characterized by a J-shaped curve on a graph.
Logistic growth
Growth that slows as carrying capacity is reached, leveling off.
Infant mortality rate
Number of infants dying per 1,000 live births.
closely tied to nations industrialization due to improved healthcare, hygiene and maternal support
Life expectancy
Average number of years a newborn is expected to live.
higher in industrialized nations
Age structure
Distribution of a population among age groups (age structure).
Sex ratio at birth
Natural ratio of male to female births (about 106 males per 100 females).
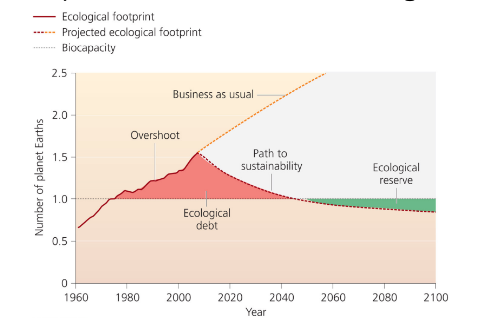
Global biocapacity
Earth’s capacity to renew resources and absorb wastes.
Ecological footprint
A measure of demand on Earth's ecosystems; can exceed biocapacity.
Ecological deficit
When humanity’s ecological footprint exceeds Earth’s biocapacity.
Ecological reserve
When the ecological footprint is smaller than Earth's biocapacity.
Immigration
Movement of people into a country.
Emigration
Movement of people out of a country.
Net migration rate
Difference between inward and outward migration per 1,000 people.
Birth rate
Annual births per 1,000 people.
Death rate
Annual deaths per 1,000 people.
Population growth rate
The rate at which a population increases or decreases.
Demographic fatigue
When some countries struggle to complete demographic transition due to factors like disease or poverty (e.g., HIV/AIDS impact).
can get stuck in the transition and creates this
One-child policy problems with the one-child policy
China’s policy restricting most couples to a single child (historical context).
Population labour force shrank, elderly increased and too few women
Two-child policy
China’s policy allowing two children per couple, implemented in the 2010s.
Not much changed, people didn’t want to go back to having more kids
Bangladesh family planning
Government program increasing contraception access and counseling, lowering TFR from 7.0 to 2.1
happened more naturally then the one child policy
Family planning
Efforts to plan the number and spacing of one’s children.
some places have higher use and acceptance
Contraception
Measures to prevent pregnancy (condoms, pills, implants, etc.).
Birth control
Actions to reduce the frequency of pregnancy.
Reproductive rights of women
Equality in decision-making, education, and employment enabling lower fertility.
Women’s education
Education of women linked to greater agency and lower fertility. Turns out empowering women is good for population control and economic development.
Economic development and fertility
As economies develop, fertility generally declines; poverty often correlates with higher fertility.
Malthus
Economist who warned that population tends to outstrip food supply.
Neo-Malthusians
Modern thinkers (e.g., Ehrlichs) warning of overpopulation and resource depletion.
Population pyramid shapes
Broad base = rapid growth; even distribution = stable; narrow base = shrinking.
India and China demographic transition
Both large countries undergoing transitions; India may overtake China due to policy differences.
Below-replacement fertility
TFR below 2.1, leading to long-term population decline.
Dust Bowl (IPAT example)
Illustrative erosion from intensive agriculture showing environmental impact (I) from IPAT.
Bottom-up population policy
Policy approach focusing on poverty reduction and social needs rather than top-down birth control.
Is population growth a problem?
Human carrying capacity, depletes resources, degrades the natural environment and stress social systems
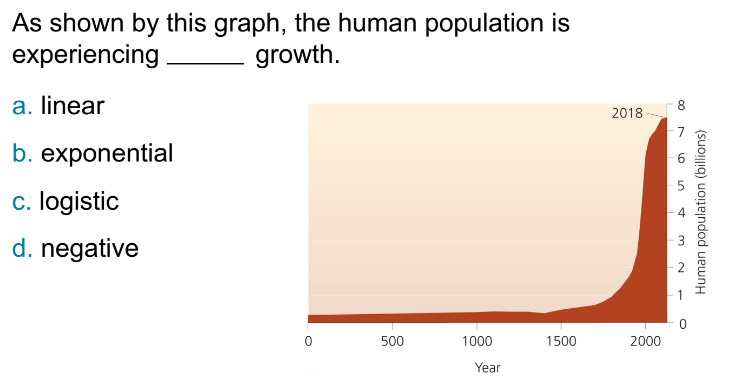
Exponential
According to the IPATS model, which of these changes would reduce environmental impact?
a. An increase in the overall affluence of the global society
b. A decrease in the human population growth rate
c. Technological advances in resource harvesting
d. Consuming resources in a more sensitive environment
b. A decrease in the human population growth rate
Demography - Age Structure diagrams
Describe the relative number of people in each age class within a population
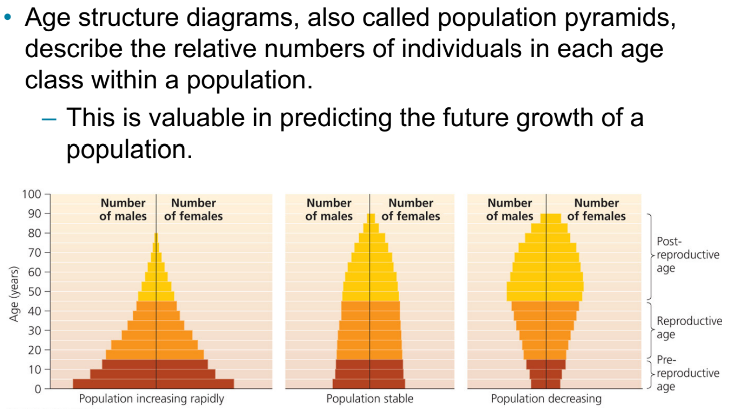
Demography - Age Structure diagrams
A pyramid with a wide base denotes a potential for rapid future growth
lots of babies, going to have a growing population
A pyramid with an even age distribution indicates a stable population
stable population
A pyramid with a narrow base indicates a shrinking population
shrinking population
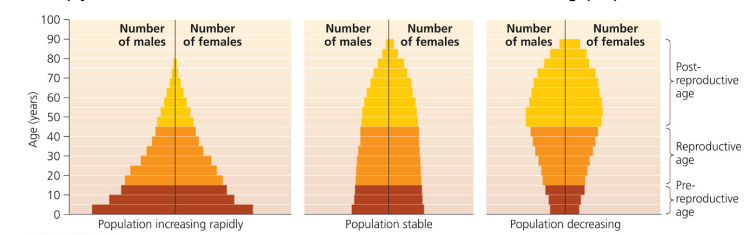
Age Structure example
Demographic Transition model/graph
Pre-industrial
equal, high, and steady birth/death rates
Transitional stage
birth rate is high, death rate drops. population increases
Industrial stage
population growth slows and stabilization begins
birth rates are declining
Post-industrial stage
population stabilizes and may decline. equal, low and stable birth/death rates
Ecological Footprint
If humanity’s ecological footprint exceeds Earth’s biocapacity, it is termed an ecological deficit.
If the footprint is less, there is an ecological reserve