UNIT 4.1. Statistics
1/24
Earn XP
Description and Tags
Formulae (SL & HL)
Name | Mastery | Learn | Test | Matching | Spaced | Call with Kai | Chat |
|---|
No analytics yet
Send a link to your students to track their progress
25 Terms
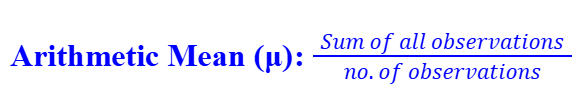
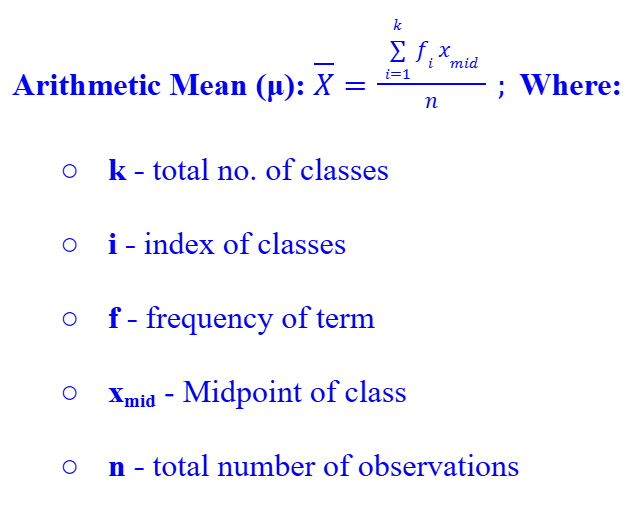
Arithmetic Mean (Ungrouped Data)
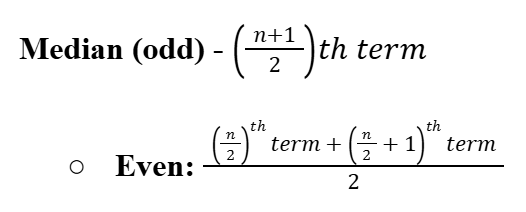
Median (Ungrouped Data)
Mode
The most common term/class in a given data set.
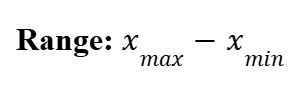
Range
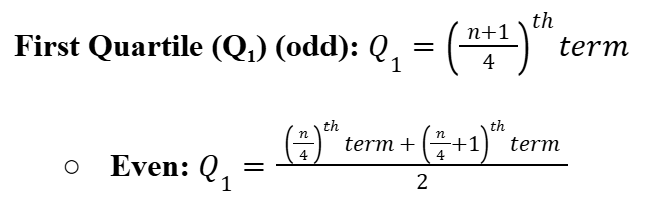
First Quartile (Q1)
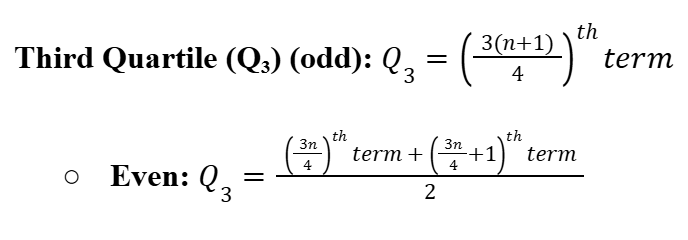
Third Quartile (Q3)
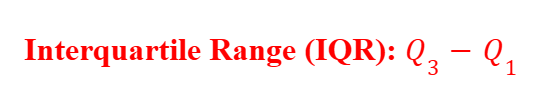
Interquartile Range (IQR)
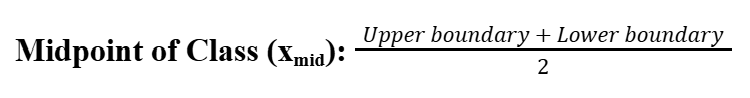
Midpoint of a class (xmid)
Arithmetic Mean (Grouped Data)
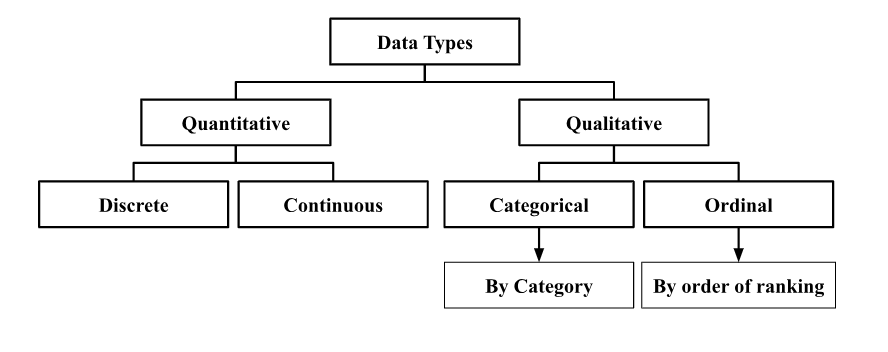
Data Classification (Statistics)
Outlier
A data point is considered an outlier if it lies more than 1.5 IQR above Q3 or lies under 1.5 IQR below Q1.
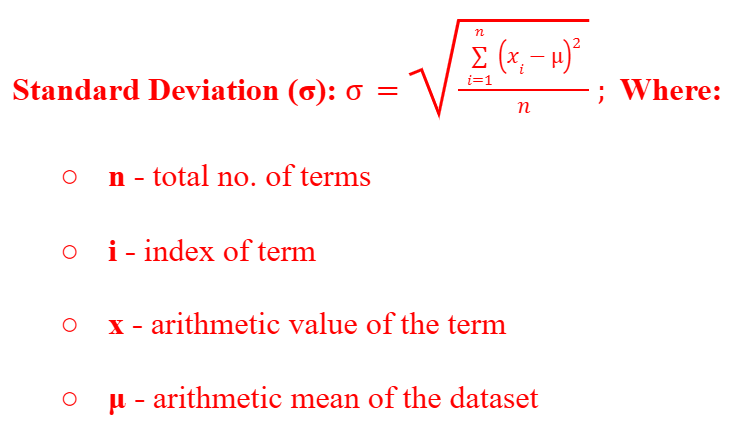
Standard Deviation
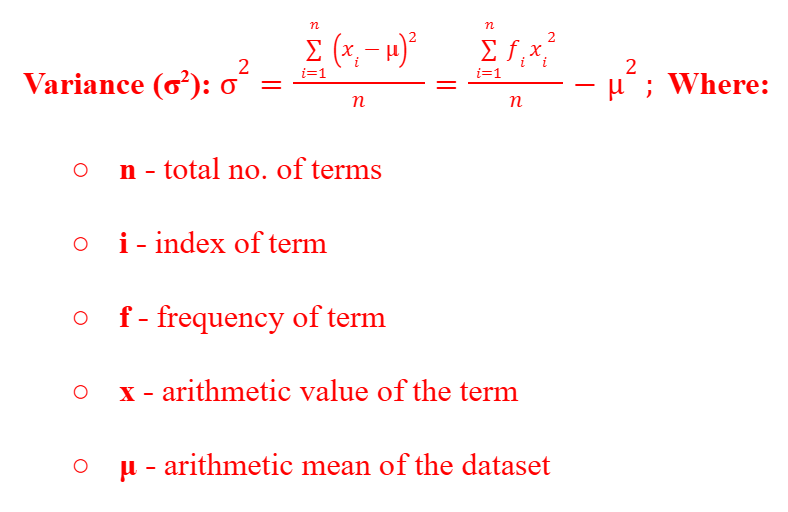
Variance
Simple Random Sampling
When you randomly choose the samples, such as drawing names from a hat.
Systematic Sampling
When you choose your samples from a fixed starting point and with a uniform interval from a data set. Eg. when sampling students in a school, you might choose every 10th person as your sample.
Stratified Sampling
When you divide the data set into classes defined by a certain trait or characteristic. Then you choose samples from each strata with the same percentage of samples available in each strata as compared to the dataset. Eg. when sampling pizza in a restaurant you might use the toppings as a stratum. The percentage of the pizzas in each topping would then decide the percentage of samples to choose from each stratum.
Quota Sampling
When you choose your samples in a specific quota (percentage ratio) to mirror real life. Eg. when sampling the same pizza in a restaurant, you might use the percentage of meat pizzas to the percentage of vegetarian pizzas to choose your samples. Then you would choose your samples in the same ratio or quota as found above.
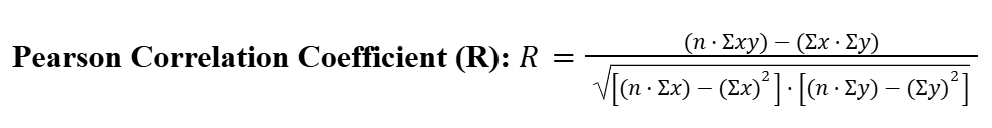
Pearson Correlation Coefficient (R-Value)
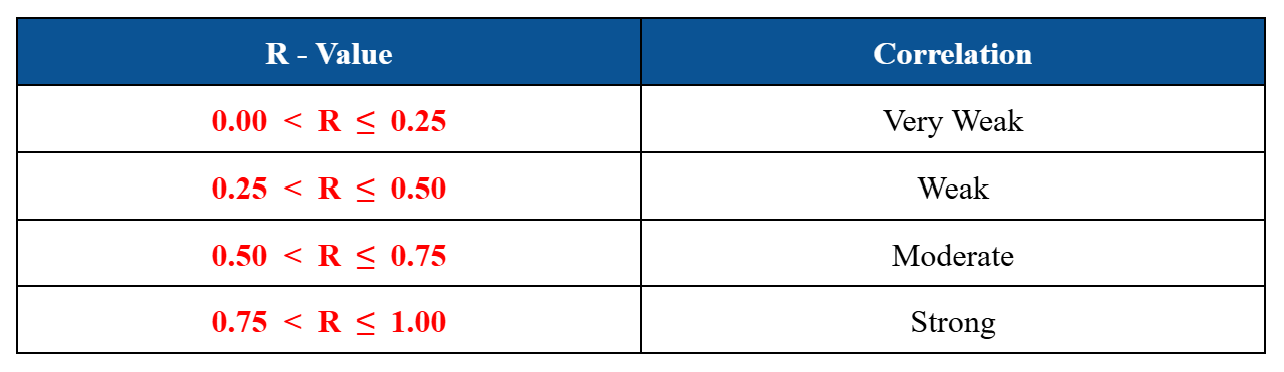
R-Value and Correlation
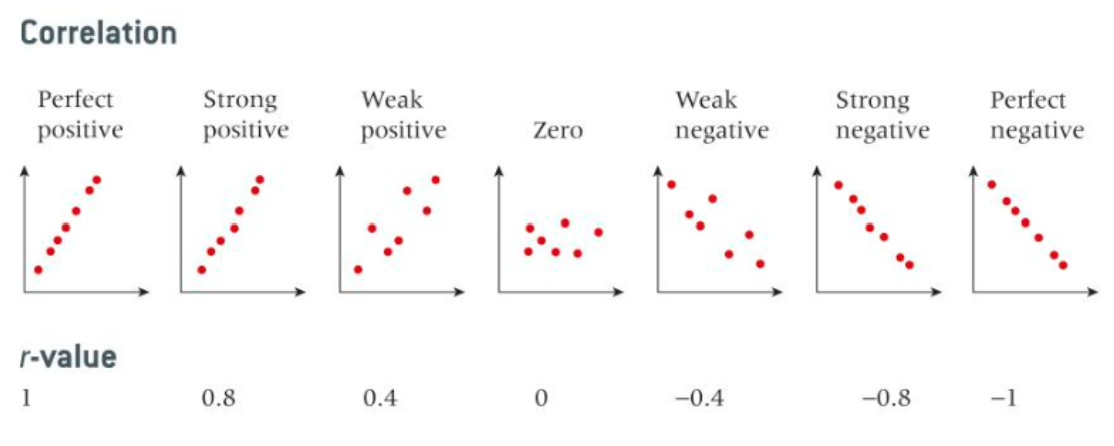
Positive and Negative Correlation
Line of Best Fit (by eye)
The line must pass through the mean point of the dataset (not necessarily part of the dataset) and there must be an equal amount of points on both sides of the line (up and down).
Line of Best Fit (Linear Regression)
Calculated by minimizing the distance of the squares of the residuals of each data point from the trendline (done by computer/calculator) in the form (y=ax+b) or (y=a+bx).
Residuals
A residual is the distance of the data point from the trendline or line of best fit.
Histogram
Bar Graph constructed from grouped frequency data with continuous data (class intervals). Unlike bar graphs, histograms have a continuous scale for the x-axis and the width is the class interval.
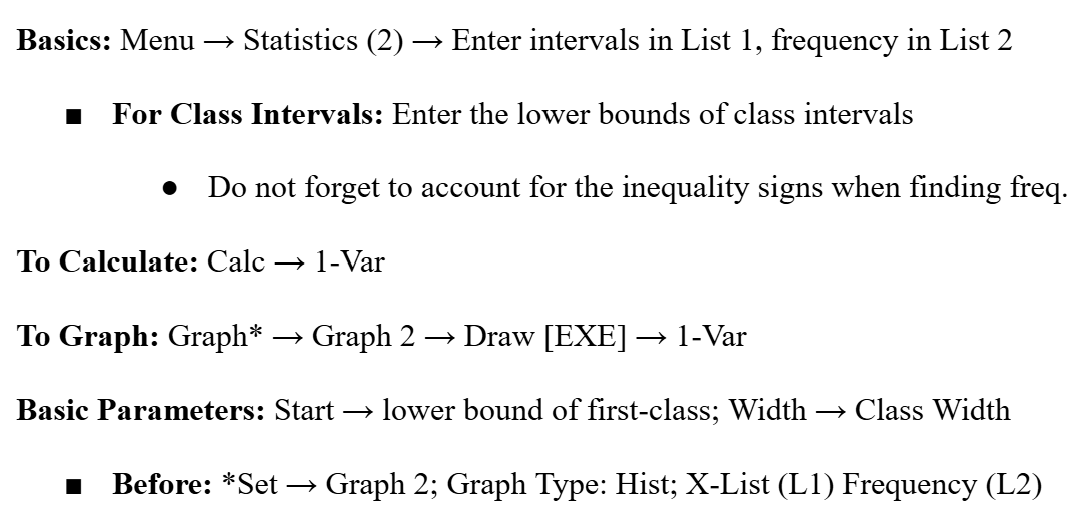
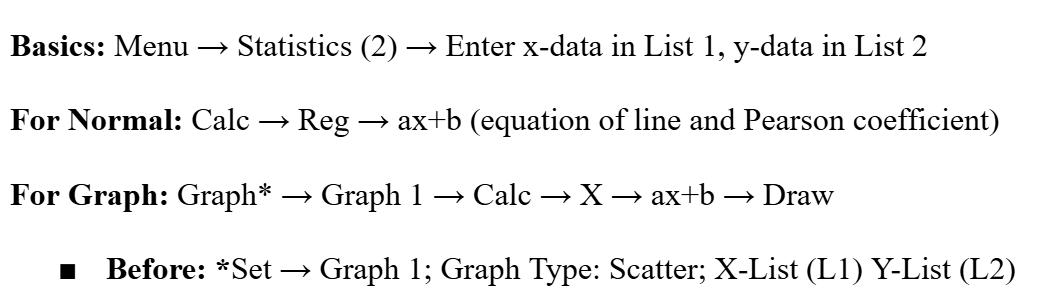
Plotting Histograms (Casio Fx-CG50)