APES Unit 3
1/43
Earn XP
Description and Tags
Name | Mastery | Learn | Test | Matching | Spaced | Call with Kai | Chat |
|---|
No analytics yet
Send a link to your students to track their progress
44 Terms
limiting resource
something that a population cannot live without and that typically occurs in quantities lower than the population would require to increase in size
carrying capacity
the limit of how many individuals in a population the environment sustain; often denoted as K
Population size (N)
the total number of individuals within a defined area in a given time
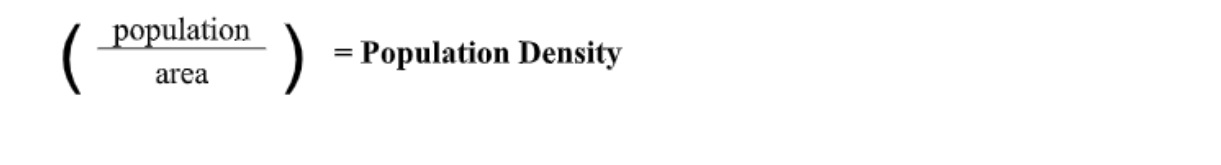
Population Density
number of individuals per unit area
Population disruption
how individuals are distributed with respect to one another
Population Sex Ratio
the ratio between males and females
Population age structure
how many individuals fit into particular age cohorts
Niche Generalist
can live under a very wide range of abiotic or biotic conditions (ex. Raccoons)
Niche Specialists
live under a very narrow wide range of conditions (ex. Panda)
2 main reproductive patterns
K selected and R selected
K selected species
species that have a low growth rate, which causes the population to increase slowly; population fluctuations are small.
R selected species
species that have a high growth rare condition which can lead to population booms and die- offs (ex. bunnies, cockroaches)
Survivorship curves
A graph showing the proportion of individuals surviving to each age in a given species or population
x axis
age or time
y axis
number of survivors
Type 1
High survival rates throughout most of their lives, but then individuals die off. (K-selected species like humans, whales, elephants)
Type 2
Constant decline in survivorship throughout their lives (squirrels, corals)
Type 3
Low survivorship at a younger age with few reaching adulthood (R-selected species like mice, weeds, frogs, fungi)
Population growth rate
the number of offspring an individual can produce in a given time period, minus the deaths of the individual or its offspring during the same period
Intrinsic growth rate ( r )
the growth rate of a population under ideal conditions
Oscillation
up and down movement
Density Dependent
influence an individual’s probability of survival and reproduction in a manner that depends on the size of the population (ex. Food available, cometition, predation)
Density Independent
Have the same effect on an individual’s probability of survival and amount of reproduction at any population size (ex. weather, natural disasters, human activities)
Exponential Growth Model
when populations are not limited by resources, their growth can be very rapid. Also illustrates density independent growth pattern. (J shaped curve)
Logistic Growth Model
Initial growth is exponential but slows as the population approaches the carrying capacity of the environment (K). Density Dependent type of growth. (S shaped curve)
crude birth rate
the number of individuals born in a population per 1000 people in the population
crude death rate
the number of individuals dying in a population per 1000 people in the population
total fertility rate
an estimate of the average number of children that each women in a population will bear throughout her childbearing years.
infant mortality rate
the number of deaths of children under 1 year of age per 1000 live births
child mortality rate
the number of deaths of children under 5 year of age per 1000 live births
net migration rate
the difference between immigration and emigration in a given year per 1000 people in a country (positive= more migration, negative= more emigration)
population pyramids
more younger people then older people. (wider at the bottom then on top) ( countries like India, Venezuela, Nigeria, Ethiopia)
population column
little difference between the number of individuals in younger age groups and older age groups. it has an age structure diagram that looks like a column ( countries like USA, Canada, Australia)
inverted pyramid
a country with a greater number of older people than younger people and has an age structure diagram that is wider up top and more narrow at the bottom. (countries like Italy, Russia, Japan)
Demographic transition theory
as a country moves from a subsistence economy to industrialization and increased affluence, it undergoes a predictable shift in population growth
Phase 1
pre-industrial, high birth and death rates and low growth rates and population sizes. (no country is in the phase)
Birth/Death rate formula
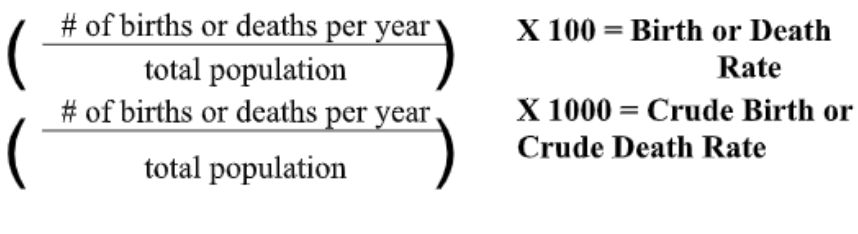
Growth rate formula

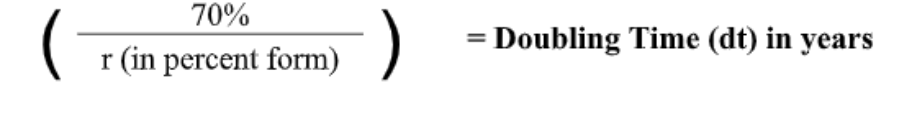
Doubling time formula
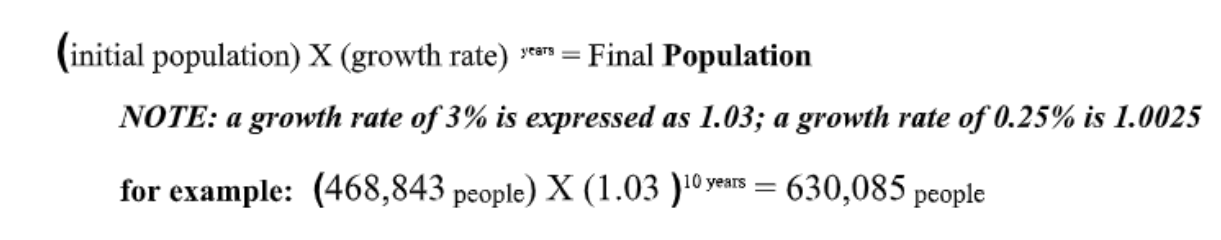
finding future population from growth rate formula
population density formula
phase 2
transitioning, low death rates, high birth rates, growth rates and population sizes increasing (countries like Ethiopia and Bangladesh)
phase 3
Industrial, low birth and death rates. Growth rate is high but steady and the population is high. (countries like USA and Canada)
phase 4
post industrial, low birth and death rates. low growth rate and population size. (countries like Japan, UK and Russia)