Biology Unit 3 Study Questions
1/47
There's no tags or description
Looks like no tags are added yet.
Name | Mastery | Learn | Test | Matching | Spaced | Call with Kai |
|---|
No analytics yet
Send a link to your students to track their progress
48 Terms
B. Abiotic
Water (H2O) is a _____ component of the environment
A. Biotic
B. Abiotic
C. Both biotic and abiotic
D. None of the above
A. Ecological communities
Groups of populations of species are organized at the next hierarchical level into
A. Ecological communities
B. Ecosystems
C. The biosphere
D. None of the above
E. Both B and C
Ecology is the study of:
A. The earth’s geological systems
B. Interactions between organisms and their biotic environment
C. Interactions between organisms and their abiotic environment
D. A, B, and C
E. Both B and C
F. None of the above
E. both b and d
Deserts or very dry environments are often located:
A. at 60 degrees latitude
B. at 30 degrees latitude
C. on the windward side of mountains
D. on the leeward side of mountains
E. both b and d
F. both b and c
D. ocean currents (warmer waters from the Gulf Stream allow coral reefs to thrive in the southern east coastal waters)
Coral reefs can be found on the southern east coast of the United States but not at similar latitudes on the southern west coast. Differences in which of the following most likely account for this?
A. sunlight intensity
B. precipitation
C. day length
D. ocean currents (warmer waters from the Gulf Stream allow coral reefs to thrive in the southern east coastal waters)
E. salinity
A. descending air masses tend to be cool and dry
Deserts typically occur in a band at 30 degrees north and south latitude because:
A. descending air masses tend to be cool and dry.
B. trade winds have a little moisture.
C. water is heavier than air and is not carried far over land.
D.ascending air tends to be moist.
E.these locations get the most intense solar radiation of any location on Earth
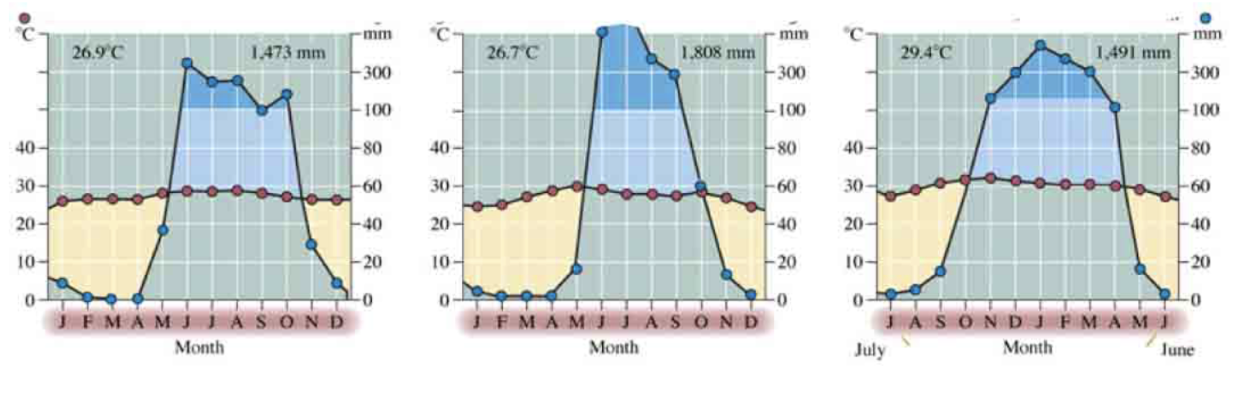
D. Tropical savanna
The Walter climate diagrams below are all from a single biome type. Which biome is it?
A. Tropical rainforest
B. Temperate forest
C. Desert
D. Tropical savanna
E. Boreal forest
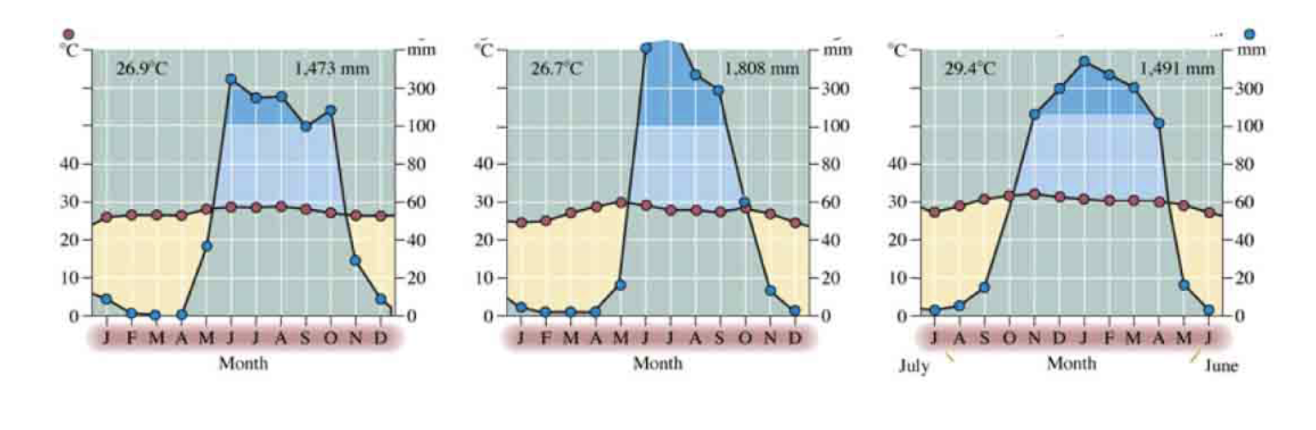
D. Distinct wet and dry seasons
What characteristic of these climate diagrams is a big clue in answering the above question?
A. Low rainfall throughout the year
B. High temperatures
C. Little variation in rainfall
D. Distinct wet and dry seasons
E. None of the above
D. temperate seasonal forest
If a temperate grassland were to receive more water, it would likely resemble which biome?
A. boreal forest
B. tundra
C. tropical rainforest
D. temperate seasonal forest
E. either boreal or temperate seasonal forest
Tropical Rainforest (Clue: stagnant temperature and constant precipitation)
This image shows which biome type?

Desert (Clue: low sporadic precipitation, temperatures don’t have a drastic change)
This image shows which biome type?

Tundra (Clue: very low precipitation that spikes along with temperature during a few months)
This image shows which biome type?

Boreal Forest (Clue: High precipitation and low temperature with some spikes in temperature in a year)
This image shows which biome type?

Temperate Forest (Clue: Precipitation and temperature change drastically depending on the season)
This image shows which biome type?

Temperate Grassland (Clue: High temperature and low to moderate precipitation)
This image shows which biome type?

Tropical Savanna (Clue: Temperatures don’t vary much; distinct wet/dry seasons)
This image shows which biome type?

B. vultures have a type II mortality curve
Consider a study of a group of vultures all born at the same time. If 1000 out of 2000 die between the age of 0 and 1 and 100 out of 200 die between the age of 10 and 11, which statement about their life history do we have the most evidence for?
A. vultures are semelparous
B. vultures have a type II mortality curve
C. the vulture population is shrinking over time
D. vultures do not reproduce before the age of 2
E. vultures have a short generation time
C. 1
In a population of 8000 snails that live for many years, in a single year, 10,000 baby snails were born and 2000 snails died. What is the per capita growth rate for this population?
A. 100
B. -100
C. 1
D. -1
E. 1000
A. growing exponentially
Given the information above, the snail population was ____________________
A. growing exponentially
B. growing, but not exponentially
C. declining exponentially
D. neither growing nor declining
C. Clumped
In a very dry habitat, there are water holes distributed randomly throughout the environment. If a particular plant species grows only on the banks of those water holes, what is the expected population dispersion for that plant in the entire environment?
A. Spaced (aka “overdispersed”)
B. Random
C. Clumped
D. No dispersion pattern
E. all of the above are correct
The equilibrium population size of a species in the absence of interspecific competitors or predators is:
A. the size at which the growth rate = 0
B. K
C. the maximum population size the environment can sustain
D. the population size at which dN/dt = 0 (where N refers to the population size)
E. all of the above are correct
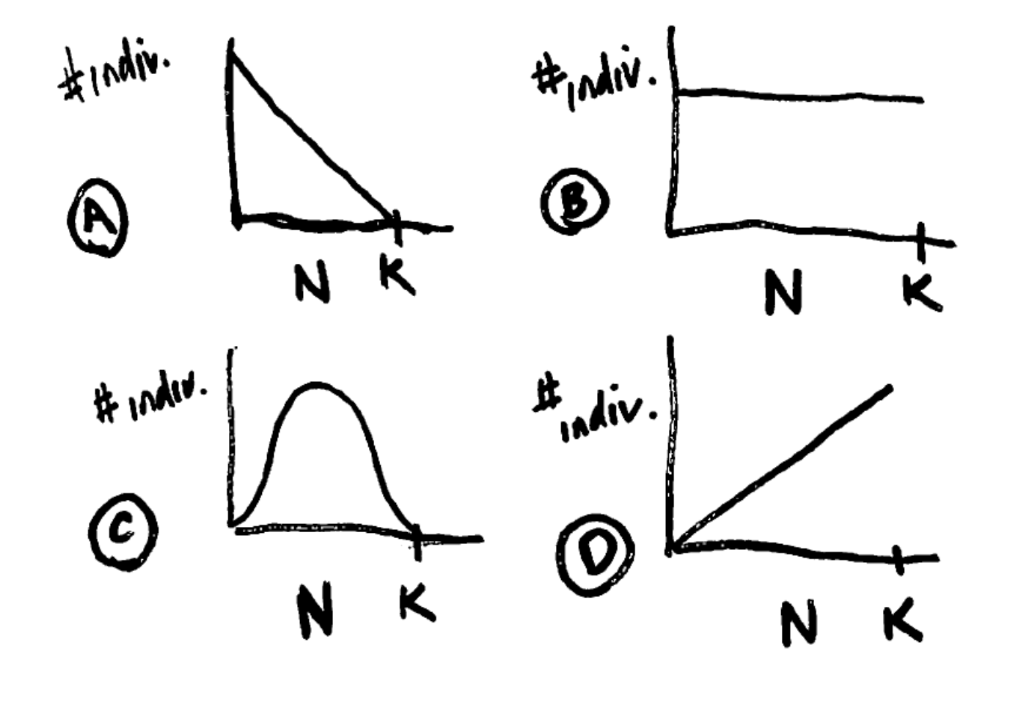
C. curve C
Below are some graphs of N (number of individuals in population) vs. the total number of individuals added to the population in each time step. Which one best fits the relationship for these two variables under logistic growth? This one requires some thinking, as the answer is NOT obvious. I suggest you take a population with a carrying capacity of 100, start with 2 individuals and an r(max) = 0.5, and then calculate dn/dt for a population of 2 individuals, then dn/dt for 20 individuals, 30, 50, 60 80 and then 100 individuals so that you can graph out the proper shape of the curve.
A. curve A
B. curve B
C. curve C
D. curve D
E. none of these curves represent the relationship between these two variables.
E. In the exponential model, K determines dN/dt
All of the following are differences between the exponential and logistic models of population growth EXCEPT
A. The exponential assumes unlimited resources; the logistic does not
B. At a given N, per capita growth rate is lower with the logistic than the exponential model.
C. The logistic has an equilibrium; the other does not.
D. In the logistic the per capita rate of increase (actual r) decreases as N increases.
E. In the exponential model, K determines dN/dt
D. 4.5
Consider a population of 100 frogs that has an r(max) = 0.05. If these frogs have a carrying capacity of 1000 individuals, how many frogs should be added to the population in the next time step?
A. 60
B. 105.5
C. 100
D. 4.5
E. this population is not growing
B. Often involves abiotic factors
Density-independent population regulation
A. depends on population size
B. Often involves abiotic factors
C. often involves biotic factors
D. only two of the above
E. A, B, and C
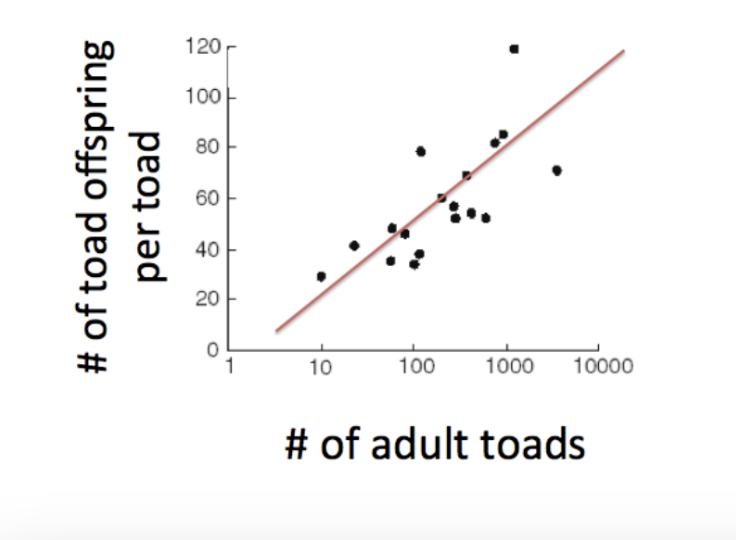
C. density dependence
The graph below shows a number of different toad populations, each represented by a black dot. These toad populations provide an example of:
A. exponential growth
B. carrying capacity
C. density dependence
D. abiotic population regulation
E. all of the above
C. interspecific competition is more intense than intraspecific competition
🌟Competitive exclusion is likely to occur when
A. two species exhibit resource partitioning
B. Interspecific competition is less intense than intraspecific competition
C. interspecific competition is more intense than intraspecific competition
D. population size reaches K
A. commensalism
Interactions between species that have a positive effect on one species and NO effect on the other species are referred to as:
A. commensalism
B. mutualism
C. predation
D. competition
E. symbiosis
E. all of these statements are true
All of the following statements about community interactions are correct EXCEPT
A. Closely related species may be able to coexist if there is at least one significant difference in their niches
B. Some predators and their prey have linked population cycles.
C. Mutualism can be described as a biological market, where goods or services are traded by species for their own benefit.
D. Some predators can control the abundances of their prey populations
E. all of these statements are true
C. When the two species coexisted, Species A and Species B had different realized niches.
You are measuring characteristics of two species of fish. When you begin your study, you observe that Species A feeds near the waters’ surface; Species B feeds near the bottom of the lake. During your study, a catastrophic disease kills all of the members of Species A so that only Species B remains in the community. Right after Species A is eliminated, you observe that Species B now forages near the waters’ surface AND near the bottom of the lake. Given this information, which of the following statements would be TRUE?
A. Species A had undergone character displacement.
B. The realized niche and fundamental niche of Species B were the same.
C. When the two species coexisted, Species A and Species B had different realized niches.
D. Species A and Species B had a commensal relationship.
E. This is an example of intraspecific competition.
D. both A and B
To measure species diversity in a community, you need to know
A. the number of species.
B. the relative abundance of each species.
C. the physical size of each species.
D. both A and B
E. A, B, and C
B. plants are limited by some factor other than water
You conduct an experiment in which you add water to a system and see no increase in primary production. This experiment suggests that
A. plants are limited by water
B. plants are limited by some factor other than water
C. plant growth can continue exponentially
D. this experiment doesn’t inform us about water limitation.
A. Heterotrophs
Which of the following terms encompasses all of the others?
A. Heterotrophs
B. Herbivores
C. Carnivores
D. primary consumers
E. secondary consumers
B. Top-down regulation
You are sampling a pond ecosystem, and find that it has a large population of algae, a small population of algae-feeding crustaceans, a large population of small fish that feed exclusively on crustaceans, and a small population of larger fish that feed exclusively on smaller fish. The evidence from these population abundances suggests that this food chain is subject to:
A. Bottom-up regulation
B. Top-down regulation
C. Upside-down regulation
D. Strangulation
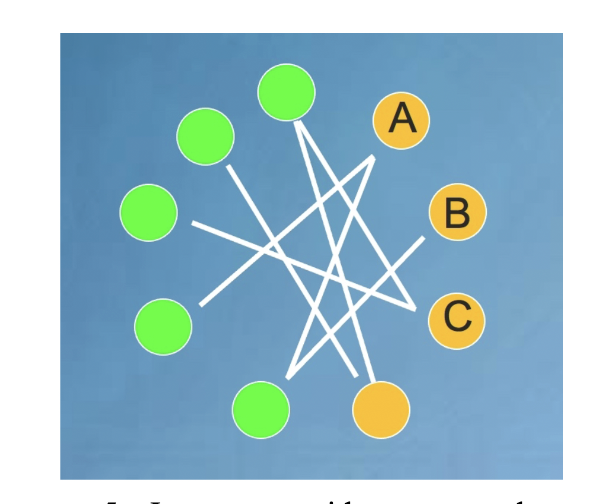
B. Species B
In the plant-pollinator network shown below, which pollinator species is most vulnerable to a random pollinator extinction event? (pollinator species are in orange, plant species are in green). Why?
A. Species A
B. Species B
C. Species C
D. They are all equally vulnerable
B. Decrease
In a system with strong top-down control that has 4 trophic levels (top predator, mesopredators, herbivores, and plants), and effort to increase the population of the top predators would ______________ the abundance of the plant community.
A. Increase
B. Decrease
C. Have no effect on
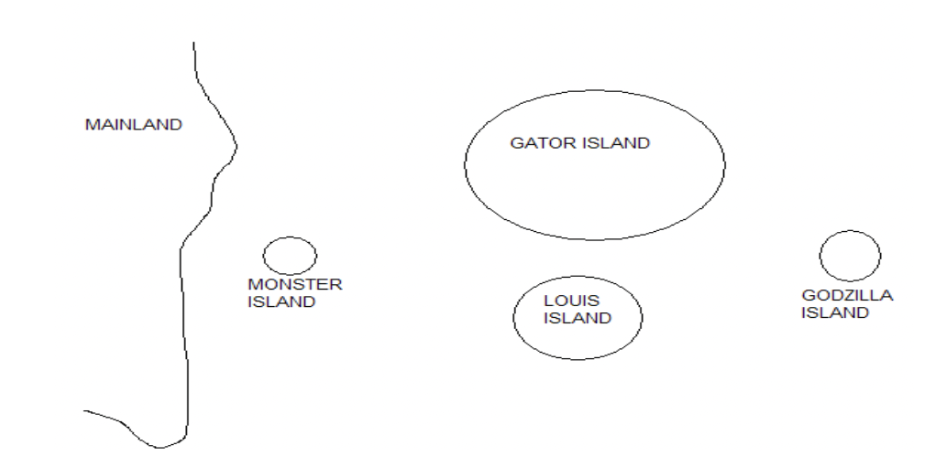
E. None of the above are true
You are examining island biogeography on the islands pictured below. The islands fit the predictions of the theory of island biogeography. Given this, which of the following is TRUE?
A. Gator island should have higher extinction rates that Louis island
B. The extinction rate on Godzilla Island is lower than on Louis Island.
C. The immigration rate on Godzilla Island is higher than on Monster Island.
D. The immigration rate on Louis Island is higher than on Gator Island.
E. None of the above are true
C. As the number of established species on an island increases, colonizing success decreases.
What is the relationship between colonizing success and the number of species already established on an island?
A. As the number of established species on an island decreases, colonizing success also decreases.
B. There is no relationship between the number of established species on an island and colonizing success.
C. As the number of established species on an island increases, colonizing success decreases.
D. As the number of established species on an island increases, colonizing success also increases.
E. As the number of established species on an island decreases, colonizing success also decreases; and as the number of established species on an island increases, colonizing success also increases.
B. The tropics have experienced major disturbances through evolutionary time.
C. The tropics have fewer predators
Two of the following are not hypotheses for why there are more species in the tropics, which are they?
A. The tropics have higher limits for the number of individuals that can be supported.
B. The tropics have experienced major disturbances through evolutionary time.
C. The tropics have fewer predators
D. Higher temperatures have increased biological rates, including that of speciation.
E. The tropics have had more time to accumulate species because of a lack of disturbance events like glaciation.
C. Temperate areas will ultimately contain the same number of species as tropical habitats, if there are no more major disturbances and enough time passes.
In the history hypothesis for the latitudinal gradient in species richness, which statement is true?
A. Temperate areas have fewer species because these environments cannot contain as many species as tropical environments
B. Tropical environments have more species because rates of speciation are higher at those latitudes
C. Temperate areas will ultimately contain the same number of species as tropical habitats, if there are no more major disturbances and enough time passes.
D. None of these statements are true
E. All of these statements are true
C. The number of breeding males and females
If you know that a population has 100 individuals, what information do you need in order to calculate the effective population size?
A. The sex ratio
B. The number of males
C. The number of breeding males and females
D. The number of females
E. All of the above
True: B, D
Mark the following statements as true or false
A. All populations within a metapopulation have r>0
B. All populations within a metapopulation are connected by dispersal to other populations within that metapopulation
C. All populations within a metapopulation have r<0
D. Populations within a metapopulation that have r<0 may persist due to the presence of connected “source” populations
D. Genetic diversity
What conservation challenge for cheetahs is the phenomenon of “Supermoms” related to?
A. Competition
B. Predation
C. Population density
D. Genetic diversity
C. they transform atmospheric nitrogen to plant-available forms of nitrogen
Nitrogen fixing bacteria are of primary importance in ecosystems because
A. they convert ammonium to nitrate
B. they break down dead plant and animal matter
C. they transform atmospheric nitrogen to plant-available forms of nitrogen
D. they infect insects and reduce herbivory on plants
E. they grow well and leave lots of offspring
A. 10 %
Of the energy that enters one trophic level, approximately (on average) what percent becomes available for the next trophic level?
A. 10 %
B. 100 %
C. 1 %
D. 0.1 %
E. 1000 %
C. Equal to net primary productivity plus the respiration of plants
Gross primary productivity is:
A. Total amount of nutrients converted to chemical energy per unit time
B. Total amount of chemical energy converted to light per unit time
C. Equal to net primary productivity plus the respiration of plants
D. Equal to net primary productivity minus the respiration of plants
E. None of the above
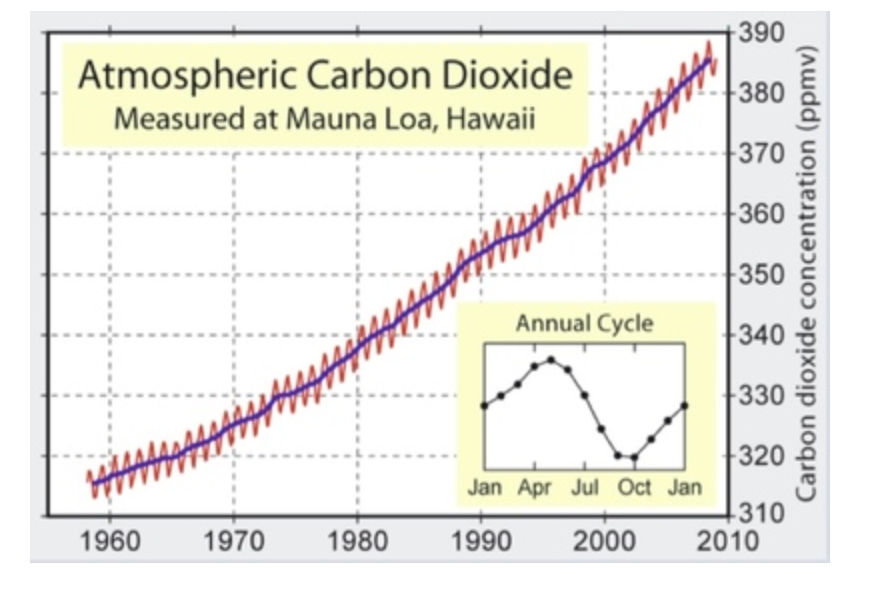
C. The burning of fossil fuels by industrial activities
The figure shows observations of atmospheric CO2 concentrations made at Mauna Loa, Hawaii. The trend in atmospheric CO2 concentrations observed over this period is caused by _________
A. The greenhouse effect
B. Changes in global photosynthesis
C. The burning of fossil fuels by industrial activities
D. Melting ice sheets
E. Variability in the flux of energy output by the sun
A. True
The flux rate from land to the atmosphere is greater than the flux rate from the ocean to the atmosphere.
A. True
B. False