3.4 Finding Z-Score, Percentiles and Quartiles, and Comparing Standard Deviation Theory
1/32
There's no tags or description
Looks like no tags are added yet.
Name | Mastery | Learn | Test | Matching | Spaced | Call with Kai |
|---|
No analytics yet
Send a link to your students to track their progress
33 Terms
Definition of Relative Standing
(1) comparing measures between or within data sets
Z-Score
(1) the number of standard deviations a data value (x) is away from the mean
(2) the number of standard deviations away from the mean
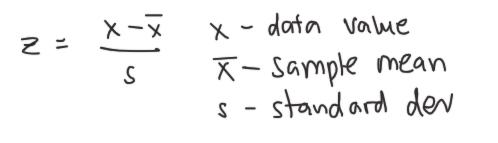
Sample Z-Score Formula
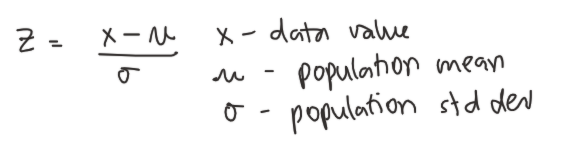
Population Z-Score Formula
The larger the z-score…
(1) the rarer the data value
What percentage of data is included within a z-score of -1 and 1?
(1) 68% — 68% of your data will lie within 1 standard deviation away from the mean
What percentage of data is included within a z-score of -2 and 2?
(1) 95% — 95% of your data will lie within 2 standard deviations away from the mean
What percentage of data is included within a z-score of -3 and 3?
(1) 99.7% — 99.7% of your data will lie within 3 standard deviations away from the mean
What is considered usual data?
(1) within 1 to 2 standard deviations
What is considered unusual data?
(1) anything beyond 2 standard deviations
Quartiles
(1) break your data up into quarters
How many quartiles exist?
(1) only 3, Q1, Q2 (Median), and Q3
1st Quartile
(1) the data value that represents the bottom 25% of sorted data
2nd Quartile
(1) the data value that represents the bottom 50% of sorted data
(2) also the median
3rd Quartile
(1) the data value that represents the bottom 75% of sorted data
4th Quartile
(1) trick question, there is no 4th quartile because that would include everything
Steps to Calculating Quartiles
Step 1: Sort or order your data values in order
Step 2: Find the median, or Q2 to split your data in half
Step 3: Find Q1 and Q3 by further splitting your median sections in half; find the median of the bottom 50% Q1, find the median for the bottom 100% Q3
Percentiles
(1) break your data up into 100 parts
How many percentiles exist?
(1) 99 percentiles only exist
What do percentiles tell you?
(1) how a value compares to the rest of the group
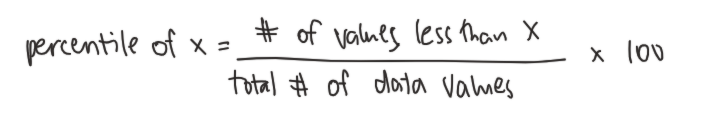
Steps to Calculating Percentiles
Step 1: Identify your position, the number of how many values below you compared to the total values (how many people did worse)
Step 2: Identify the total number of values there are
Formula for Percentiles

(1) Q1

(1) Median

(1) Q3
What does IQR stand for?
(1) interquartile range
Definition of Interquartile Range
(1) the middle 50%
(2) the difference between quartile 3 and quartile 1
Formula for IQR
IQR = Q3 - Q1
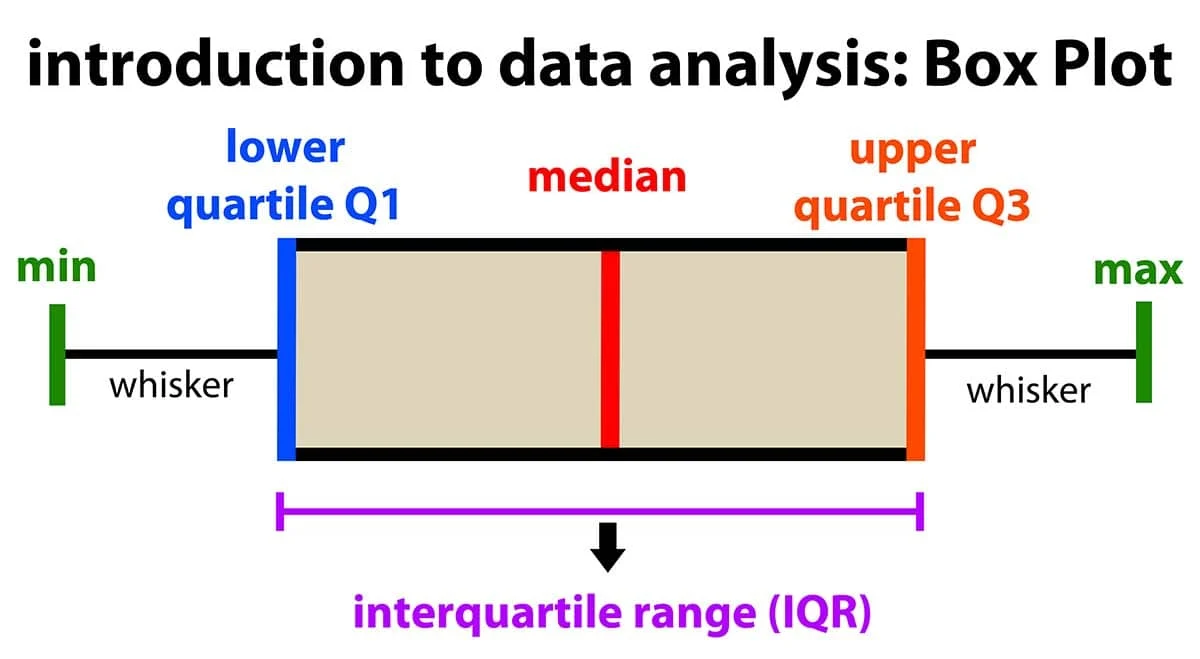
What is a box plot?
(1) a graphic representation of the five number summary
Five Number Summary
(1) composed of 5 specific values
Minimum Value
Q1
Median (Q2)
Q3
Maximum Value
Steps to Organize A Box Plot
Step 1: Organize and sort your data set
Step 2: Find the 5 number summary
Minimum Value
Maximum Value
Median (Q2)
Q1
Q3
Step 3: Make a number line and plot the five number summary to scale according to the number line
Step 4: Draw a box around Q1, Q2, Q3
Steps to Calculate Outliers
Step 1: Find IQR, Q3 - Q1
Step 2: Multiply IQR by 1.5 (1.5 × IQR)
Step 3: Take (1.5 × IQR):
Subtract that number from Q1
Add that number from Q3
Step 4: Analyze — anything outside of that number or range is mathematically an outlier
What does a box plot look like?