Res-Econ 212 Exam #1
1/105
There's no tags or description
Looks like no tags are added yet.
Name | Mastery | Learn | Test | Matching | Spaced | Call with Kai |
|---|
No analytics yet
Send a link to your students to track their progress
106 Terms
Descriptive Statistics
the method or procedure of
gathering
organizing and
summarizing data visually and numerically
interpreting data using visual displays and numerical statistics to characterize key features of the data
Inferential statistics
the method or procedure of using statistics computed from the sample data to draw conclusions about the population from which the data are drawn
population
the entire set of possible cases; an entire group of interest you want to draw conclusions about. it can be a group of individuals, objects, events, organizations, etc.
number in entire population denoted by “N”
sample
a portion or part of the population of interest — a smaller subset selected from the group to represent it
sample size denoted by “n”
statistic
a descriptive measure concerning a sample (e.g., sample mean). use roman letters x bar
parameter
a descriptive measure concerning a population (e.g. population mean) use Greek letters, μ
bias
sample statistic is not representative of population parameter
sources:
selection bias
confirmation bias
data manipulation/funding bias
outliers
nonresponses or incorrect response
omitted variable bias
leading questions in survey
sampling methods
not probability based
convenience sampling methods
probability based
simple random sampling method
systematic random sampling method
stratified sampling methods
cluster sampling methods
simple random sampling
select items from a population such that every possible sample of a specified size has an equal chance of being selected
our assumed sample design, unless specified otherwise
systematic random sampling
get a list of population items (N)
select a sample size (n)
determine the interval frequency: select every kth item on the population list
k = population size (N)/the desired sample size (n)
select a starting point between 1 and k
SystemicRS advantaged and disadvantages
easier to conduct
not every possible sample has an equal chance of being selected
cluster sampling
divide the population into internally heterogenous and externally homogenous subpopulations known as clusters
the clusters are externally homogenous as they appear to be grouped together by a shared characteristic/criteria
choose any one section
the clusters are internally heterogenous because the subpopulations within the clusters have different compositions
stratified sampling
divide the entire population into groups with different characteristics called strata. random samples are then selected from each stratum to reflect the population characteristics
need to confirm that the stratum of the population is in proportion to the stratum in the sample
form strata with similar characteristics so the heterogeneity across strata should correspond to the heterogeneity in the population
convenience sampling methods
collect market research data from a conveniently available pool of respondents
can be biased
variable
something that can take on different values. it “varies”. characteristics of an individual
observations
a single member of the collection of items
data set
a collection of all the values of all variables of all variables for all observations we have chosen to observe
data characterization
categorical or qualitative (nominal & ordinal)
values that are not numerical but can be put into distinct groups — gender, race, grades etc.
numerical or quantitative (discrete & continuous)
variables where the measurement or numbers have a numerical meaning (height, weight, # of ppl, temp, etc.)
nominal
quality not rank (student/not student, color of hair or eyes, etc.)
ordinal
rank (grades, level of education, satisfaction level, etc.)
discrete
variable with distinct values and countable (# of students, # of employees, etc.)
continuous
variables which are measurable but not countable. can have any value within an interval (temp, weight, etc.)
interval data
has meaningful distances but do not have true zeros or fixed beginning (temp. in f or c, grade levels in schools, etc.)
ratio data
have defined zeros. you can look at the ration of two variables, and it makes sense (ex. weight, income, market share, sales, etc.)
time series data
one thing of interest (one variable) across different points in time
ex. stock price of apple over the course of a year or 20 yrs. height of a child over the years
cross section data
one point in time with several variables or factors or things of interest
ex. height of children in a preschool today
panel data
combination of time series and cross sectional data
ex. height of children in a specific preschool every week in 2023
frequency
the number of times an event occurred in the experiment or study
a method of organizing data to observe or gain more insight about the properties of the data
relative frequency
the number of times an event occurs in an experiment or study divided by the number of total trials conducted. tells you how often something happens compare to all outcomes
data visualization used for…
exploring data structure (central tendency and spread/dispersion)
detecting outliers and unusual groups
identifying trends
spotting local patterns
data visualization guidelines
concentrate on the most important data to communicate the research question
include as much relevant info possible, exclude irrelevant or unnecessary details
the more info a chart is able to convert without increasing complexity, the better
not all charts are suitable for all types of data
the number and typed of variables should guide the visualization’s format
general rule for which charts to use
categorical; few; → pie chart
categorical; many; → bar chart
quantitative discrete; few → pie chart
quantitative discrete; moderate → bar chart
continuous or discrete; many; histogram
cumulative relative frequency
number of observations falling in a given class in a frequency table plus all the observations falling in earlier classes, divided by the total number of observations
problems with data visualization
using wrong chart
too many variables in one graph
3d graphs on a 2d space
manipulating the y-axis
using two y-axis
cherry picking
consistency in scale, especially for pictograms
choice of color
pie charts
good for comparing different parts of a whole but not good for comparing different data sets
not good when there are too many variables
what must you first construct for pie charts, histograms, and bar charts?
frequency table and relative frequency table
central tendency
where is the center of the distribution? where would I balance the distribution on my finger such that it wouldn’t fall?
bar chart
a visual display of the frequency or the relative frequency table constructed using discrete data
bars have same width and do not touch; labelled properly and concisely with clear title
used to display distribution of a qualitative variable
histogram
a visual display of the frequency or the relative frequency table constructed using continuous data
bars have same width, touch, and chart is properly labelled with clear title
effective way to represent distributions
used to display distribution of a quantitative variable
dispersion
an arrangement of values of a values showing their observed or theoretical frequency of occurrence
measures the level of variation in the data
can tell us central tendency
how far do the tails spread?
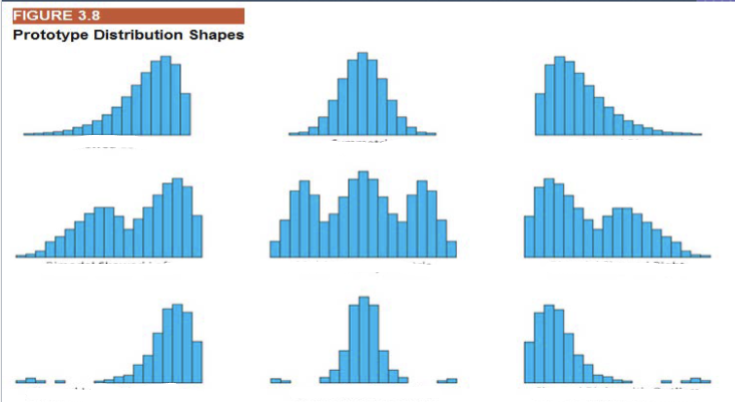
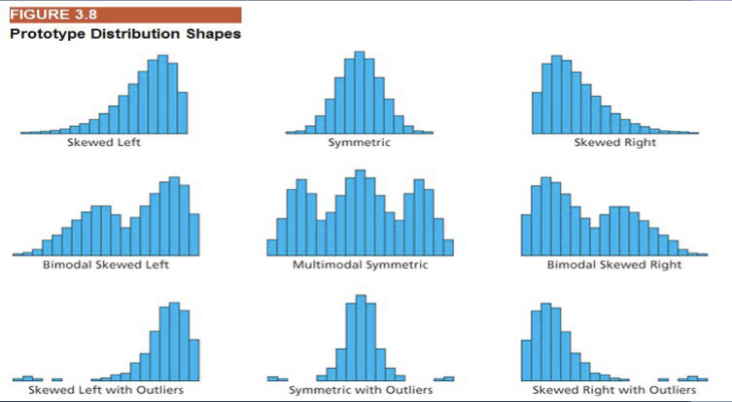
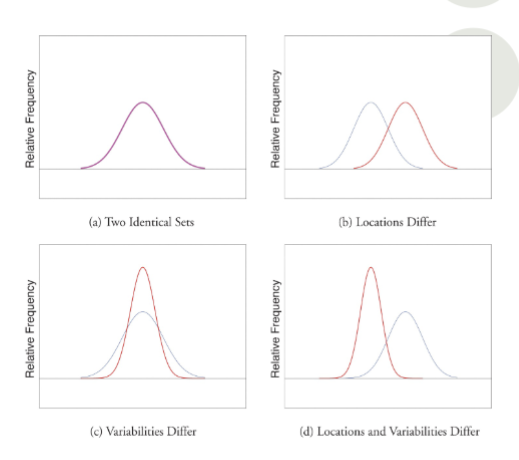
distribution shapes
data characteristics
center
what seem to be the typical middle of the data?
variability
how much dispersion/spread is there in the data? any unusual values?
shape
are the data values distributed symmetrically? skewed? bimodal?
used to measure center of data?
mean, median and mode
comparing the three → shape of distribution
mean
the sum of data values divided by the number of data items
most commonly used, includes all data
influenced by extreme data points (outliers)
for population called mean or expected value or average
for sample, called sample mean or sample average
median
the midpoint of a set of sorted data
used in presence of outliers; does not include all data
separates the upper and lower half of sorted observations
denotes the 50th percentile
determining position of median
(number of observations + 1) ÷ 2
mode
the most frequently occurring data value
can be used for categorical data. can have multiple modes. not helpful for continuous data
frequency and relative frequency are the highest among all values
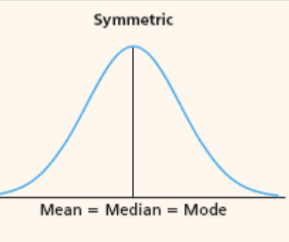
skewness if mean = median = mode?
symmetrical
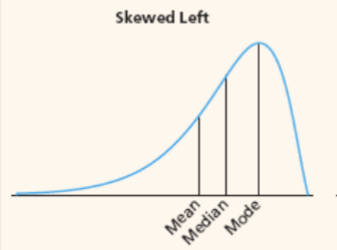
skewness if mean < median < mode?
skewed left
skewness if mode < median < mean?
skewed right
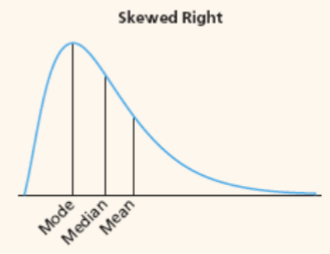
skewness
a measure of the asymmetry of a distribution
outlier
a value that is higher or lower than the rest of the data values in an extreme way
effects:
mean is affected bc it is calculated into the mean
median unaffected since values do not matter when locating
mode typically unaffected since it would not be the most frequent observation
variance
average of the squared distances between the data values and their mean
looking at dispersion around a measure of central tendency — the mean
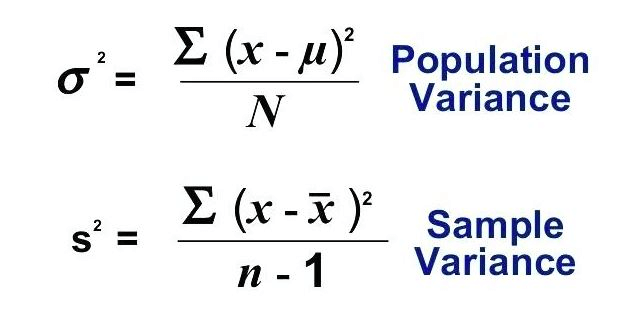
formula for computing variance
σ2 = population variance
S2 = sample variance
N = total number of observation in the population
n is the number of data points in the sample
xi = each individual data point
μ = the population mean
x bar = sample mean
to calculate, subtract the mean from each data point, square the result, sum all squared values, and
for population divide by total number of observations
for sample divide by n - 1
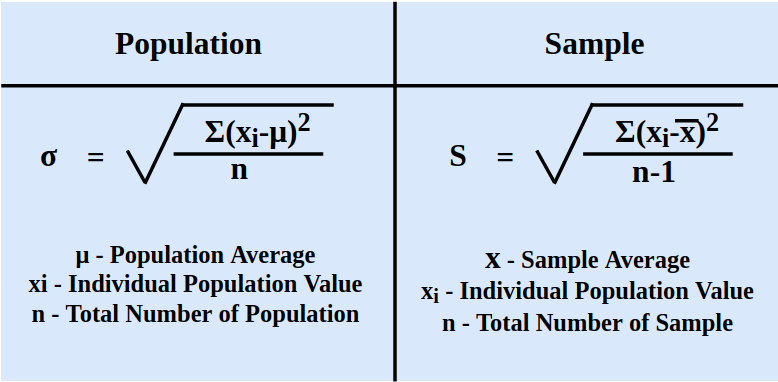
standard deviation
the square root of the variance
use for unit matching
standard deviation formula
remember to square each individual difference
range
the difference between the max and min values in a data set
easy to calculate but caution
very sensitive to outliers
only considers two points and nothing in between
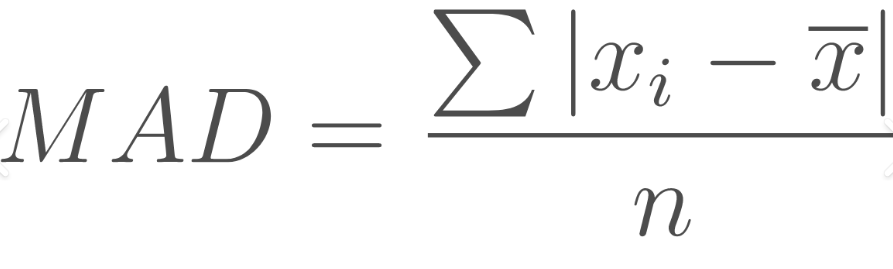
mean absolute variation
measure the average of the absolute from the center
absolute values must be used since otherwise the deviations around the mean would sum to zero. stated in the unit of measurement
justified using MAD instead of standard deviation to measure dispersion when the data contain certain outliers that could distort standard deviation
mean absolute deviation MAD formula
coefficient of variation
useful for comparing variable measured in different units or with different means
a unit-free measure of dispersion
expressed as a percent of the mean
only appropriate for nonnegative data. undefined if the mean is zero or negative
formula
CV = 100 (standard deviation/mean)
dispersion vs central tendency
percentile
a value below which a certain percentage of the data fall
ex. 55th percentile → the value below which 55% of the data fall
divide the data into equal chunks
quartiles
3 values that divide the data into 4 equal chunks
(deciles: 9 values that divide the data into 10 equal chunks)
used to characterize the distribution of the data
computing quartiles
sort the raw data in ascending order
Q1 at the position .25(n+1)
25th percentile or P25
Q2 at the position .5(n+1) → the median, ½ (n+1)
50th percentile or P50
Q3 at the position 0.75(n+1) → ¾ (n+1)
75th percentile or P75
if the position is not an integer, linear interpolation is used (a.k.a take the average)
linear interpolation
define the integer portion and the fractional points
ex. 2.25 —> 2, 0.25
find the position of number with nearest integer, and that plus one
ex. 2, 3
interpolate by multiplying the difference between them by fractional portion, add result to lowest score
ex. (0.25)(# difference between in position 2 and 3) + (lower #, either 2 or 3)
five number summary
an exploratory data analysis tool. each describes where a particular value falls in the distribution. can tell you the shape of the distribution
minimum value
Q1
Q2 (median)
Q3
maximum value
to make this determination, compare the median to Q1 and Q3
when the median is
approx. halfway between Q1 and Q3, data are symmetrical
closer to Q1, data are right-skewed
closer to Q3, data are left-skewed
interquartile range
the range within which the middle 50% of the data lie
not affected by outliers
small IQR → data is tightly clustered around the median, indicating low variability
large IQR → data is more spread out, indicating high variability
importance of quartiles for distribution shapes
for uniform and bell shaped → Q1, 2, 3 equally shaped
right skewed → distance between Q1 and 2 < dist. Q2 and 3
left skewed → distance between Q1 and 2 > dist. Q2 and 3
IQR vs standard deviation
std dev is generally preferred since it includes all observations, but it is easily influenced by extreme values
use IQR for skewed distributions or data with outliers
IQR and outliers
to find outliers
check histogram
use IQR formula
high outlier → x ≥ Q3 + (1.5 x IQR)
low outlier → x ≤ Q1 − (1.5 x IQR)
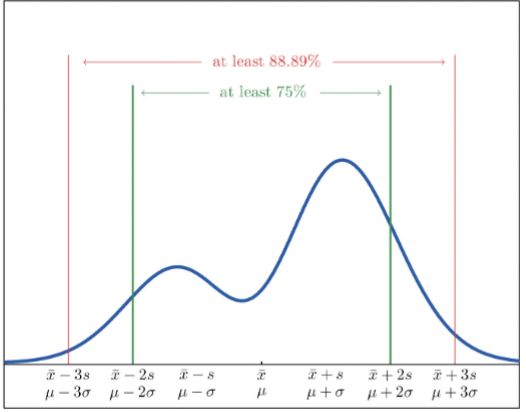
Chebyshev’s rule uses and importance
helps us determine where most of the datapoints fall in reference to the mean
applies to all datasets and distributions of shapes
uses only the concept of mean and std. deviation to estimate the percentage of values within 2, or 3 std. deviations of the mean
Chebyshev’s rule
for any population (sample data) with mean μ( x bar) and population
(sample) standard deviation σ( s), the percentage of observations that lie within k standard deviations of the mean, k>1, must be at least
100[1-1/k2]
normal distribution
a bell-shaped curve that is symmetrical
can be completely characterized by its mean and standard deviation
empirical rule
if the data is normally distributed, then the empirical rule states that we expect the interval [μ - kσ, μ + kσ] to contain a known percentage of data
k = 1; ±1 s.d. from the mean to contain 68.26% of the data
k = 2; ±2 s.d. from the mean to contain 95.44% of the data
k = 3; ±3 s.d. from the mean to contain 99.73% of the data
![<p>if the data is normally distributed, then the empirical rule states that we expect the interval [μ - kσ, μ + kσ] to contain a known percentage of data </p><p>k = 1; ±1 s.d. from the mean to contain 68.26% of the data</p><p>k = 2; ±2 s.d. from the mean to contain 95.44% of the data</p><p>k = 3; ±3 s.d. from the mean to contain 99.73% of the data</p><p></p>](https://assets.knowt.com/user-attachments/5e38cf12-a395-4d9f-9713-9bd51bd144e1.png)
Chebyshev’s theorem vs empirical rule
chebyshev’s theorem gives lower bound percentages for any distribution
if the data is normal, empirical rule fives exact percentages
central limit theorem
the mean of many samples independently drawn from the same distribution nearly normal for large enough sample size
why normal distribution is one of the most important distributions in natural and social sciences
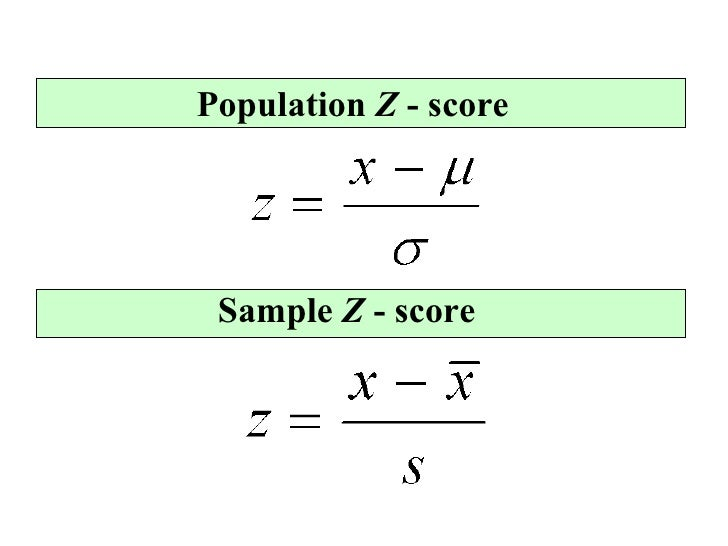
z-score
tell us the position of any observation relative to the mean. how far it is from the mean in terms of std. dev.
unit free
one-to-one relationship between z-score and data value; in other words, we can move between these two equations easily
original equation and x = z(s or σ) + mean
important z-scores
Z = -3: Three standard deviations below the mean.
Z = -2: Two standard deviations below the mean.
Z = -1: One standard deviations below the mean.
Z = 0: Exactly at the mean.
Z = +1: One standard deviation above the mean.
Z = +2: Two standard deviations above the mean.
Z = +3: Three standard deviations above the mean.
bivariate dataset
a data set consisting of two variables; goal to show some association between two variables
can be used to analyze the association between two variables visually or numerically
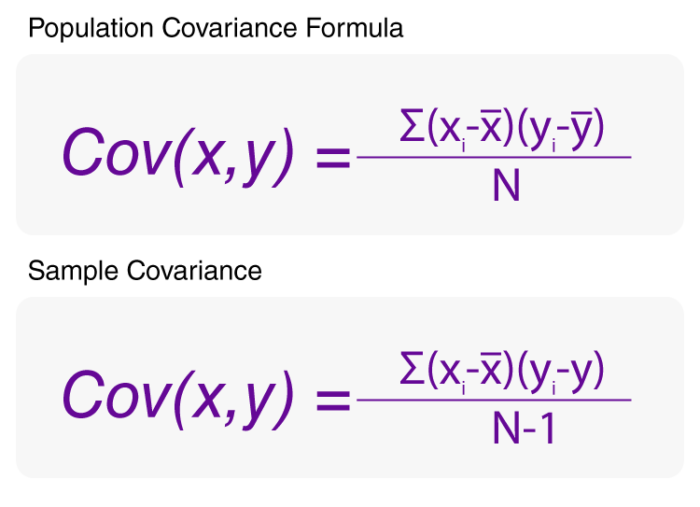
covariance
shows the direction of linear relationship between two random variables
measures how two variables change together
positive → direct positive relationship between two variables and they move in the same direction
negative → two variables move in the opposite direction, negative association
formula for covariance
each y observation minus mean for y values; same for x
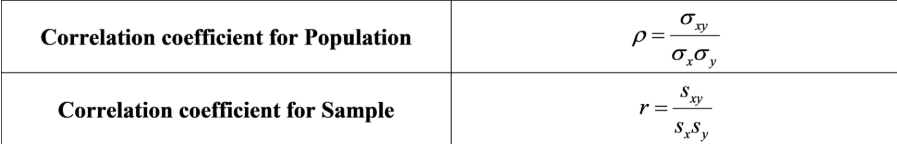
correlation coefficient
a measure of the degree of linear association between two variables
strength and direction of linear association between two variables
gives more info than the covariance:
how closely related are the two variables x and y
a unit free number with range [-1,1]
value of -1 means perfect negative linear association
value of 1 means perfect positive linear association
value of 0 means no linear association
formula for correlation coefficient for 2 variables x and y
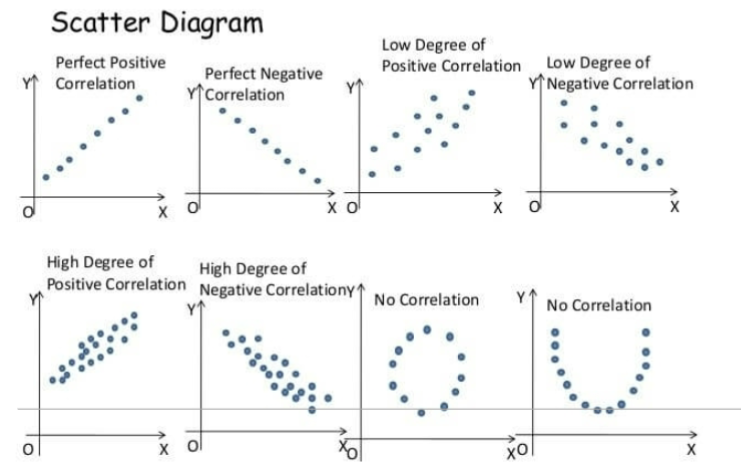
scatter diagram
best to visually examine the relationship between two quantitative variables
correlation vs causation
correlation does not mean causation
even if there’s a correlation between two variables, we cannot conclude that one variable causes a change in the other. could be a coincidental relationship or have another factor causing both variables to change
could be spurious relationship — meaningless
frequency vs relative frequency (bins)
frequency: number of observations in each bin
relative frequency: proportion of observations in each bin
all-inclusive classes
a class for each and every distribution
when looking at a sample, can you tell for sure if it was drawn without replacement?
no. only if the same sample point appears more than once can you tell it was drawn with replacement
value of k for systematic random sampling
between one and population/sample size
the lowest form of data assigned to categories that have no order associated with them?
nominal data
data whose measurement is inherently categorized?
qualitative data
cumulative relative frequency
the proportion of observations with values less than or equal to the upper limit of the class
frequency distribution
a summary of the set of data that displays the number of observations in each of the distributions distinct categories or classes
the balancing point of your histogram?
the mean
the covariance of an asset with itself is equal too..
the asset’s covariance
when visualizing bivariate data in XY space…
the means break up our data into 4 quadrants
sample mean
calculated using subset of population data
unlikely to equal population mean
an estimator of the population mean
calculate median
number of observations +1 / 2 = position of median
tells us the midpoint of the data
median
the larger the covariance …
the wider the distribution