Econ - Unit 2
1/46
There's no tags or description
Looks like no tags are added yet.
Name | Mastery | Learn | Test | Matching | Spaced | Call with Kai |
|---|
No analytics yet
Send a link to your students to track their progress
47 Terms
Demand
Various amount of product someone will buy over a range of prices and time
microeconomics
individual behavior and decision making by individual units like people and firms
What are the variables for calculating demand?
The price of a product and the quantity available
ceteris paribus
Other variables held constant to rule out any changes.
Demand schedule
a table showing who would be willing and able to purchase over a range of possible prices
Demand Curve
Demand schedule modeled on a graph
What is the X coordinate in a demand curve?
Quantity demanded
What is the Y coordinate in a demand curve?
Price
What happens to the demand of a product as price rises?
Demand decreases
Incentive
Motivating force causing one to act
Market Demand Curve
Shows Quantities demanded by everyone who is interested in purchasing the product
If Mike were to buy 2 burritos fr $4 dollars and Patricia were to buy 1 burrito for $4 dollars, what is the market demand?
The market demand is 3 burritos at $4. (add up quantities demanded by everyone.)
Utility
satisfaction received from a product
marginal utility
additional satisfaction received from using one or more units of a product
Diminishing marginal utility
The more of a product we use, the satisfaction we get from that product decreases
Why does the demand curve slope down?
To account for diminishing marginal utility
Who is credited for coming up with marginal utility, and using food to model it?
Carl Meneger
Law of Demand
There is an inverse relationship between demand and price. (As price goes up, demand decreases)
Why does the Law of Demand occur?
Occurs as a result of separate behavior patterns overlapping.
Substitution effect
income effect
law of diminishing marginal utility
Substitute effect
if the price of a product goes up, consumers buy less of the product and more of the substitute.
Income effect
If price goes down, purchasing power of consumer increases, so they can purchase more
What happens to the demand curve when you drop the ceteris paribus assumption?
The ENTIRE curve shifts. Not just line movement.
What does a shift in demand curve mean?
At the same price, more people are willing to and able to purchase that good.
(True/false) Price shifts the demand curve.
False, price only causes line movements in the curve.
What are the five factors that cause demand to shift?
Taste, number of consumers, price of related goods, income, future expectations
What are two examples of a related good?
Substitutes and Complements
Substitutes
goods used in place for one another.
Complements
Two goods that can be bought and used together
normal good
a good who’s demand increases as income increases.
ex. luxury cars, jewelry
Inferior good
A good who’s demand decreases as income increases
ex. top ramen, Shasta cola, good value
What moves quantity demanded? (NOT demand)
line movements caused by price changes
Supply
Different quantities of goods sellers are willing and able to sell (produce) at different times
Law of Supply
Direct or positive relationship between price and quantity supplied
Why does the Law of Supply occur?
At higher prices, profit seeking firms have an incentive to produce more
What are the five shifters of supply?
prices/availability of resources
number of sellers
technology
government action (taxes and subsides)
expectations of future profit
subsidy
government payment to business or market which cause an increase in supply
Surplus
Quantity of supply available is greater than the quantity demanded (QS > QD)
What do producers do when there’s a surplus?
They lower prices.
Shortage
Quantity of supply available is less then the quantity demanded (QS < QD)
Free Market pushes system toward _________.
equilibrium
Price Signals
How prices convey information and help society use scarce resources efficiently.
Double Shift rule
When supply and demand both shift, either price or quantity will be indeterminate.
Price Ceiling
Maximum legal price a seller can charge for a product.
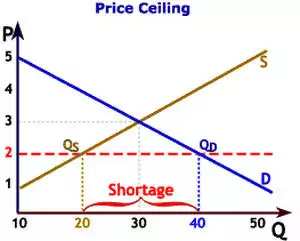
Goal of price ceiling
Make goods affordable by keeping price from reaching equilibrium
Do price ceilings help consumers?
No, they result in black markets. 😨
Price floor
Minimum legal price a seller can sell a product
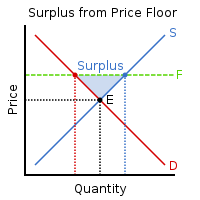
Goal of price floor
Keep prices high by keeping prices from falling into equilibrium