3.7.1 Inheritance
1/25
There's no tags or description
Looks like no tags are added yet.
Name | Mastery | Learn | Test | Matching | Spaced | Call with Kai |
|---|
No analytics yet
Send a link to your students to track their progress
26 Terms
Define the term genotype and phenotype. (3 marks)
- Genotype is the genetic makeup of an organism.
- Phenotype is the observable characteristics of an organism resulting from its genotype.
- Phenotype is also influenced by interactions between genes and the environment.
Describe what alleles are and how they are produced. (2 marks)
- Alleles are different versions of the same gene found at the same locus.
- They are created by mutations, which involve changes to the DNA base sequence.
State how many alleles of a gene can be present in diploid organisms. (2 marks)
- There are two alleles of each gene in diploid organisms because they have two sets of homologous chromosomes.
- However, in a population, more than two different alleles of the same gene may exist.
Describe the different types of alleles. (3 marks)
- Dominant alleles are always expressed in the phenotype if present.
- Recessive alleles are only expressed when two copies are present (homozygous recessive) and are not shown when a dominant allele is present.
- Codominant alleles are both expressed in the phenotype when inherited together.
Define the terms homozygous and heterozygous. (2 marks)
- Homozygous means having identical alleles for a gene on each homologous chromosome.
- Heterozygous means having different alleles for a gene on each homologous chromosome.
State what monohybrid and dihybrid crosses demonstrate. (2 marks)
- Monohybrid crosses show the inheritance of a single phenotypic trait controlled by one gene.
- Dihybrid crosses show the inheritance of two different phenotypic traits controlled by two different genes.
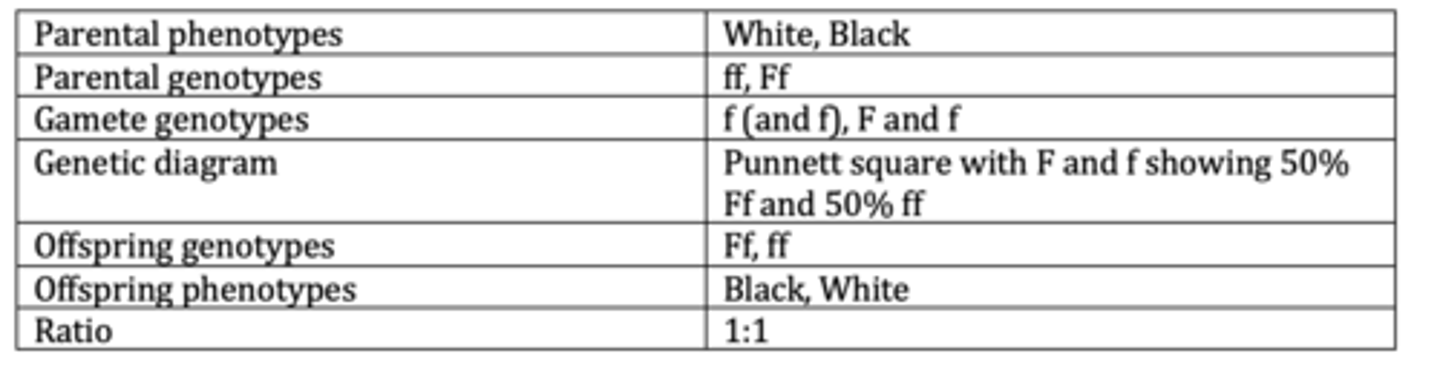
Display the results of an example of a basic monohybrid cross. (6 marks)
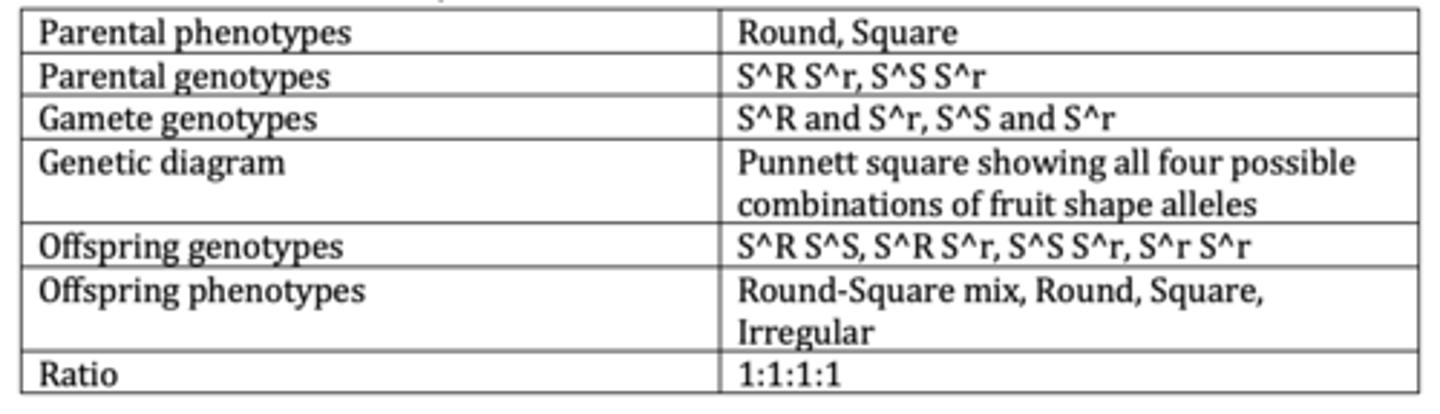
Display the results of an example of a monohybrid cross with multiple alleles. (6 marks)
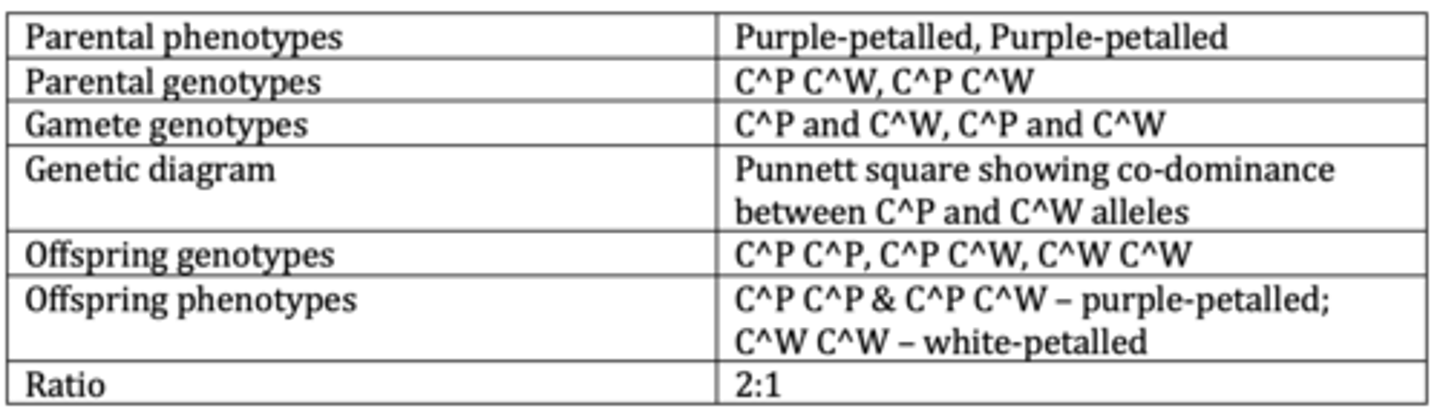
Display the results of an example of a monohybrid cross with codominance and multiple alleles. (6 marks)
Explain how a pedigree diagram can indicate that the allele for [named phenotype] is dominant. (2 marks)
- Parents who both have the [named phenotype] can produce a child without the [named phenotype].
- This means both parents must be heterozygous, carrying one dominant allele and one recessive allele.
Explain how a pedigree diagram can indicate that the allele for [named phenotype] is recessive. (2 marks)
- Parents who do not show the [named phenotype] can produce a child who does have the [named phenotype].
- This means both parents must be heterozygous carriers of the recessive allele.
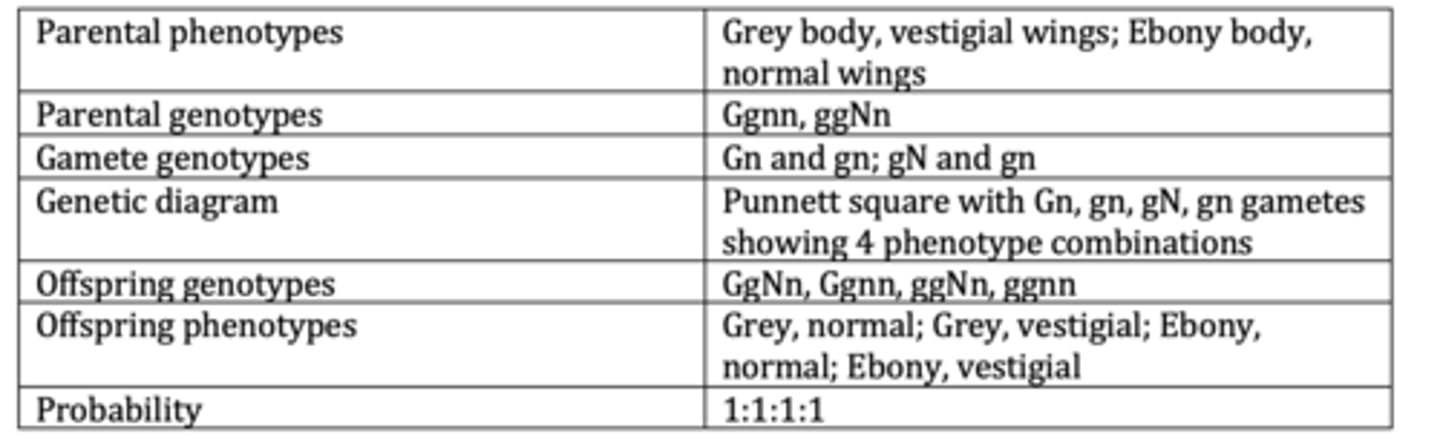
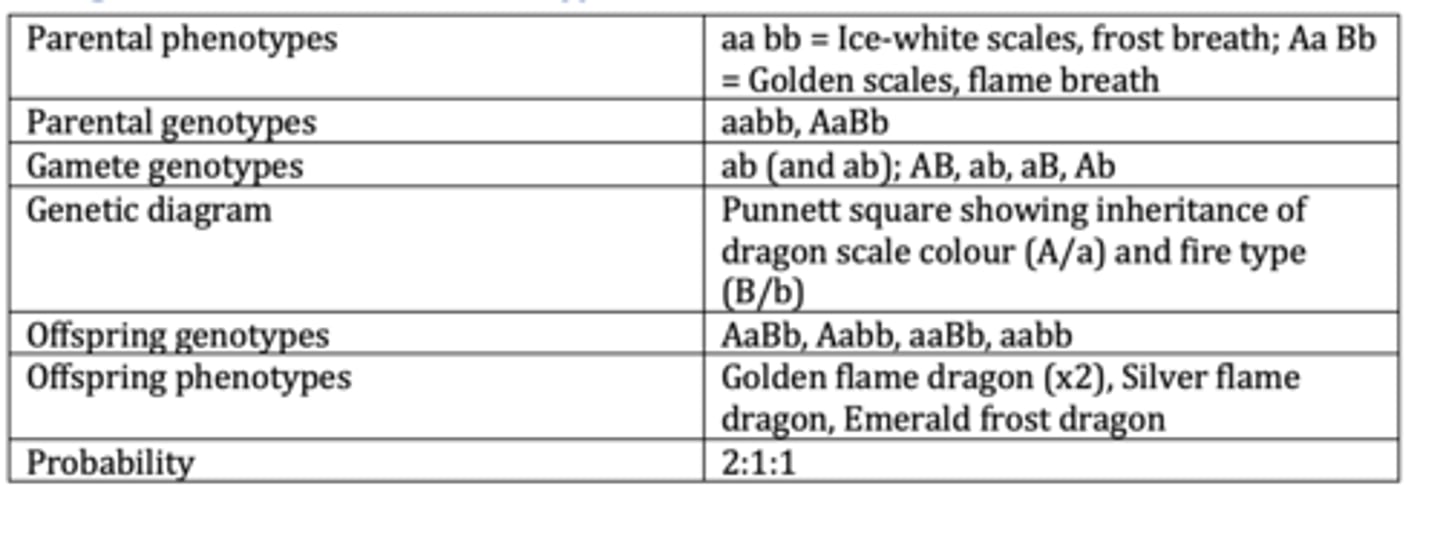
Display the results of an example of a basic dihybrid cross. (6 marks)
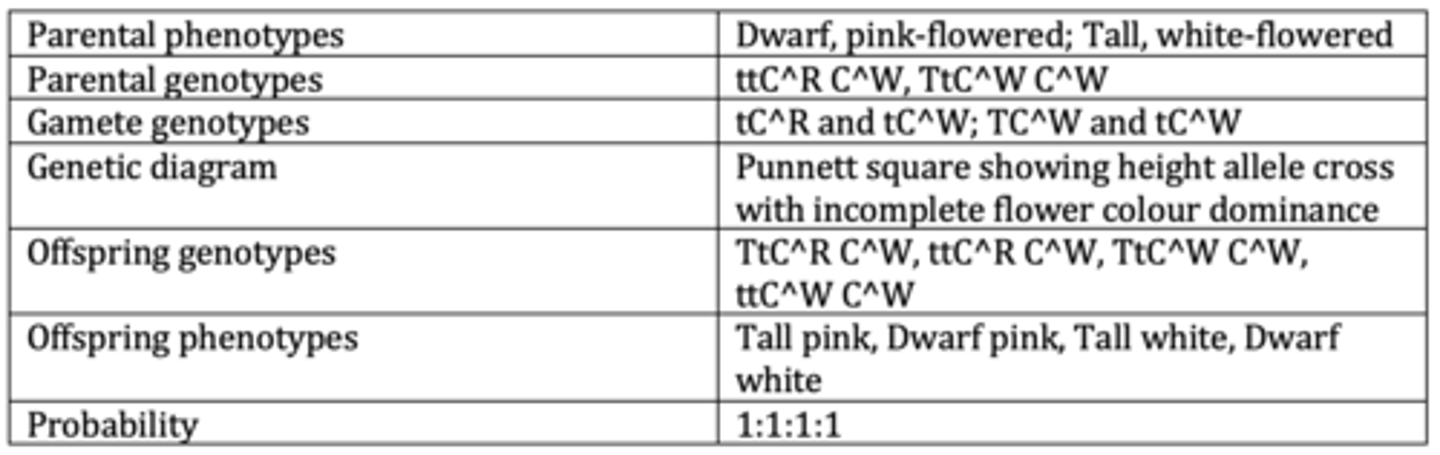
Display the results of an example of a dihybrid cross with codominance . (6 marks)
Define a sex-linked gene and explain why males are more likely to show a recessive X-linked allele. (3 marks)
- A gene that is located on a sex chromosome, most often the X chromosome.
- Females (XX) have two copies of the gene, so the recessive allele is only expressed if both copies are recessive, and they can be carriers.
- Males (XY) have only one copy of the gene on the X chromosome, so the recessive allele is always expressed if inherited.
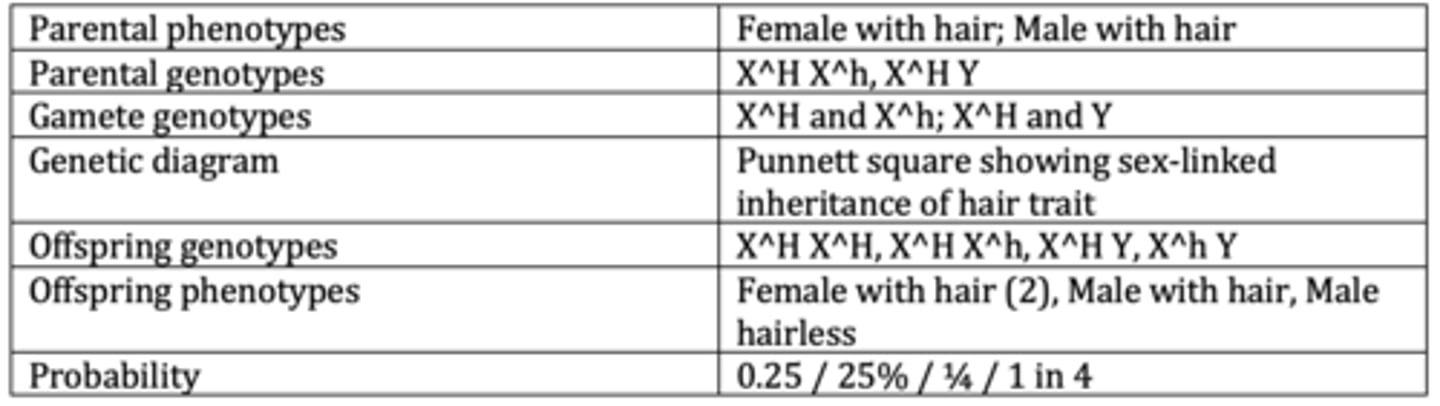
Display the results of an example of a monohybrid cross with sex linkage. (6 marks)
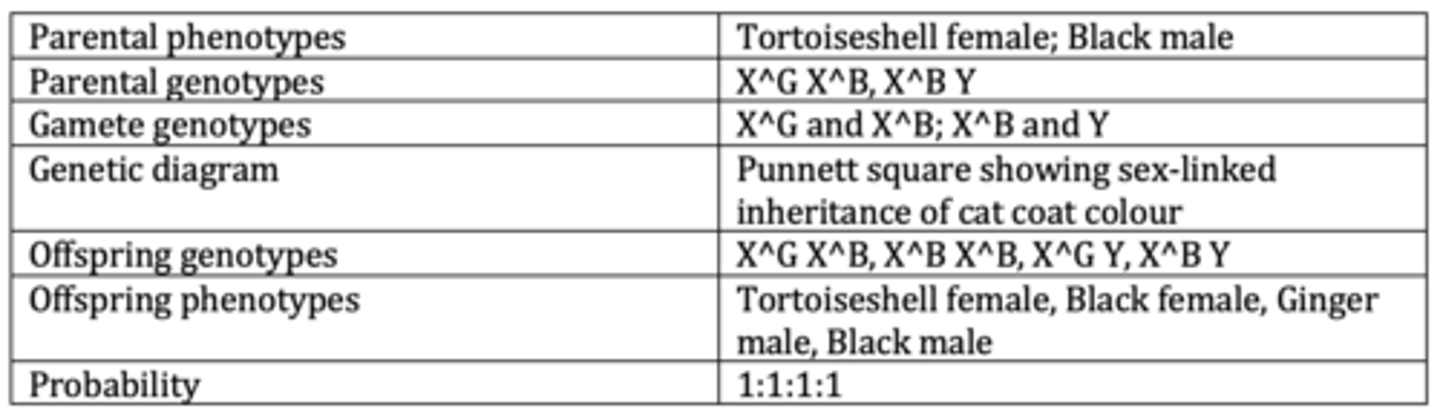
Display the results of an example of a monohybrid cross with sex linkage and codominance. (6 marks)
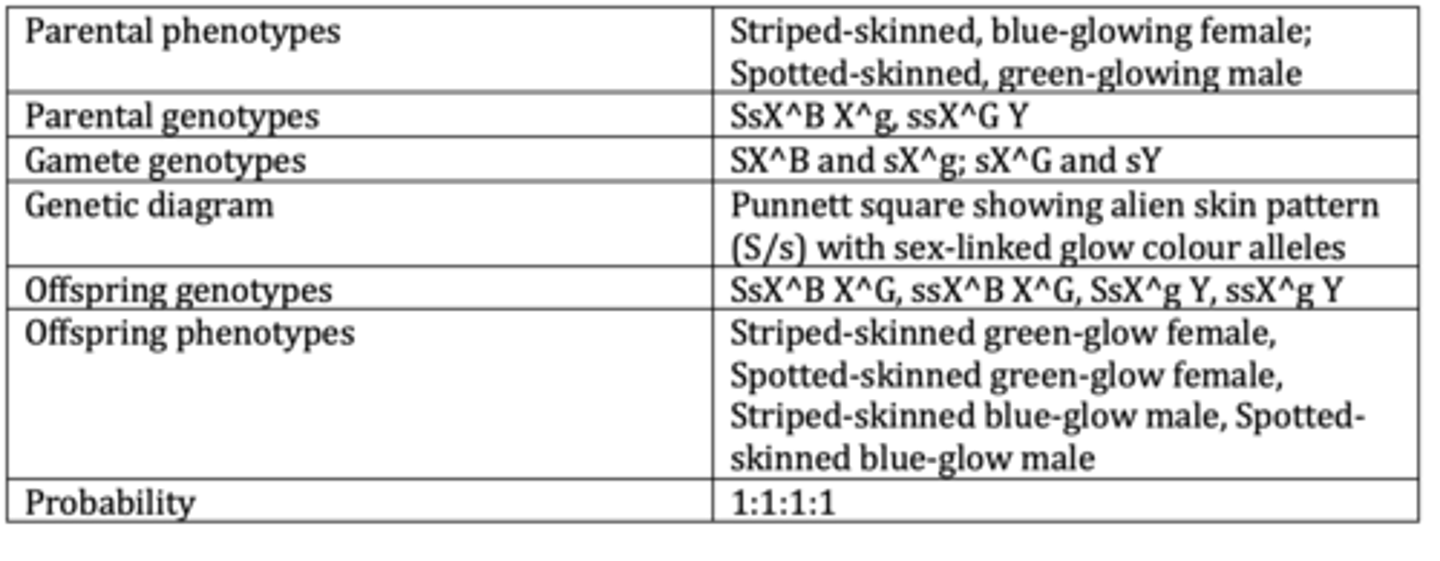
Display the results of an example of a dihybrid cross with sex linkage. (6 marks)
Explain how a pedigree diagram can show that the gene for [named phenotype] is not X-linked. (2 marks)
- If a father with the [named phenotype] has a daughter without the [named phenotype], the gene cannot be X-linked because he would pass the X chromosome to all daughters.
- Alternatively, if a mother with the [named phenotype] has a son without the [named phenotype], the gene cannot be X-linked because she would pass the X chromosome to all sons.
Explain how autosomal linkage can influence allele inheritance. (3 marks)
- When two genes are found on the same non-sex chromosome, their alleles are usually inherited together.
- They tend to remain linked during meiosis unless separated by crossing over.
- The closer the genes are on the chromosome, the less likely they are to be separated by crossing over, meaning they are more often inherited together.
Explain why only two types of gametes are produced in some autosomal linkage cases. (4 marks)
- The two genes are linked on the same chromosome, showing autosomal linkage.
- No crossing over occurs because the genes are positioned very close together.
- Only parental gametes are produced (GL and gl), with no recombinant gametes, so other offspring types are not formed.
- This explains why expected frequencies of offspring don't correspond to observed.
Define epistasis. (1 mark)
Interaction of non-linked genes where one masks the expression of the other.
Display the results of an example of a dihybrid cross with epistasis. (6 marks)
Explain why observed phenotypic ratios in genetic crosses may differ from expected ratios. (4 marks)
- The fusion or fertilisation of gametes is random.
- The effects of autosomal linkage, epistasis, or sex-linkage can alter ratios.
- A small sample size may not represent the whole population accurately.
- Some genotypes may be lethal, causing the death of certain offspring.
Describe when a chi-squared (χ²) test can be used. (3 marks)
- When determining if observed results are significantly different from expected results (frequencies).
- For example when comparing the goodness of fit between observed and expected phenotypic ratios.
- When the data is categorical, meaning it can be separated into groups such as phenotypes.
Describe how a chi-squared (χ²) value can be calculated. (2 marks)
- Use the formula χ² = Σ (O − E)² / E, where O is the observed frequency and E is the expected frequency.
- The expected frequency is calculated by multiplying the total number of individuals by the proportion for each expected category.
Describe how a chi-squared (χ²) value can be analysed. (4 marks)
1. Calculate the degrees of freedom by subtracting one from the number of categories.
2. Use a chi-squared table to find the critical value at p = 0.05 (5% probability).
3. If the χ² value is greater than the critical value, the difference is significant, and the null hypothesis is rejected.
4. If the χ² value is less than the critical value, the difference is not significant, and the null hypothesis is accepted.