HL Biology Unit 4 Ecology
1/82
Earn XP
Description and Tags
Name | Mastery | Learn | Test | Matching | Spaced | Call with Kai | Chat |
|---|
No analytics yet
Send a link to your students to track their progress
83 Terms
Species
Organisms that can potentially interbreed to produce fertile offspring (mules are HYBRIDS, but they don’t have fertile offspring)
Reproductive Isolation
Members of a species may be isolated in different populations or by location or behavior → eventually they may not be able to reproduce with other members anymore → new species (speciation)
Autotrophic Species
Generates organic nutrition from inorganic substances
Heterotrophic Species
Feeds on other organisms for nutrition
Mixotrophic
Uses more than one method for organic nutrition (ex. Euglena algae are both hetero and autotrophic)
Photoautotrophs
Generate organic nutrition by harvesting light energy
Chemoautotrophs
Generate organic nutrition through oxidation of inorganic compounds
Detritivores
Ingest detritus by internal digestion
Saprotroph
Decompose detritus by external digestion (ex. mycelium hyphae release digestive enzymes onto a material to break it down before absorbing it)
Population
Members of the same species in an area at a given time
Community
All populations living and interacting with each other in an area
Ecosystems
Organisms in interaction with their environment, both biotic and abiotic factors
Quadrat Sampling
-used for sessile organisms that don’t move around much
-uses a large grid, smaller areas within the grid are chosen randomly and their averages are used to estimate pop. size
Sampling Error
The difference between the estimated population size and the true size of the population
“Capture-mark-release-recapture” Sampling and its assumptions
-used for motile organisms that move around environment
-measured using the Lincoln Index
Assumptions
The population is a closed system
The time between samples is very small
The marked organisms mix freely and completely within the population
Lincoln Index
pop. size estimate = M(N/R)
M = # of individuals marked initially
N = total # of individuals recaptured
R = # of marked individuals recaptured
Limiting Factors
Anything that constrains a population’s size and slows/stops it from growing
Carrying Capacity
The number of individuals that an ecosystem can sustainably support
Negative Feedback
A change in conditions that causes a reaction in the opposite direction (if something increases, negative feedback decreases it to maintain status, or vice versa)
Density Dependent Factors
Reduce pop. size when an area’s too densely populated (ex. Prey and Predator control e/o pop., or pathogens)
Density Independent Factors
Impacts a population regardless of its density (ex. natural disasters)
Interspecific Competition
Competition between DIFFERENT species
Intraspecific Competition
Competition WITHIN a species, where better adapted organisms survive and reproduce, leading to evolutionary diversity
Phases of an idealized Sigmoid Population Growth Graph
Exponential Curve: Stage of exponential growth where there are few factors to affect pop. size
Transitional Phase: As pop. grows, density dependent factors provide negative feedback
Plateau Phase: Population reaches carrying capacity
Can be modeled by duckweed and yeast growth
Ecological Niche
An organism’s role within an ecosystem that includes the spatial habitat and its interactions with other species
Competitive Exclusion Principle
States that two species cannot survive indefinitely in the same ecological niche (besides scenarios like cohabitation, but that leads to competition)
6 types of interspecific relationships
Herbivory, Predation, Mutualism, Parasitism, Interspecific Competition, Pathogenicity
Herbivory interspecific interactions
Where primary consumers ingest producers
Predatory interspecific interactions/Predation
Where consumers feed on another consumer
Mutualism
Where two (often distantly related to avoid competition) species benefit from their relationship
ex. Root nodules in Fabacea, Mycorrhizae in Orchidaceae, Zooxanthellae in coral polyps
Explain the mutualistic relationship between Rhizobia and Fabacea
Rhizobia infect Fabacea and form root nodules and convert atmospheric N to a usable form for the plants while they receive organic nutrition from the plant roots
Explain the mutualistic relationship between Zooxanthellae and Coral
Coral polyps produce CO2 as waste, and the zooxanthellae need CO2 for food. The coral provides the zooxanthellae with shelter and CO2 for food, so the zooxanthellae gets rid of waste for the coral
Explain the mutualistic relationship between Mycorrhizae and Orchidaceae
Orchids rely on the mycorrhizae in early life to get all its food from external digestion while the fungi receives food through the orchid’s carbohydrates → they both get food off each other
Parasitism
When one organism feeds off another (usually) without killing it
Pathogenicity
Pathogens are an example of interspecific relationships because they often have specific host organisms
Zoonotic Infection
When a pathogen evolves so that it can spread to different species (ex. bird flu)
Invasive Species
Species that outcompete or have negative impacts on endemic species
-If humans introduce them to a new area, they experience fewer limiting factors and experience rapid population growth
(ex. Red Lionfish)
Field Manipulation Studies
Studies that can be used ot measure the effects of potential invasive species, where one species is removed from the experimental area to see its effects
Allelopathy
The chemical inhibition of one plant by another due to the release of substances acting as germination/growth inhibitors into the environment
(ex. antibiotics produced naturally by fungi to control microbial populations, specifically penicillin making penicillin)
Null Hypothesis (about population distribution)
States that there is no significant difference between the distribution of two species (random distribution)
Alternative Hypothesis (about population distribution)
States that there is a significant difference between the distribution of species (species are therefore associated)
Using the Chi-Square test to measure the distribution between species
Make a table measuring the frequency that of each species: species 1 only, species 2 only, both, none
Create a contingency table using those values to find the total of when each species is present
Create an expected frequency table using the expected frequency formula
Create the final chi-squared table using the chi-squared formula
Find degrees of freedom to determine if chi-square value is significant
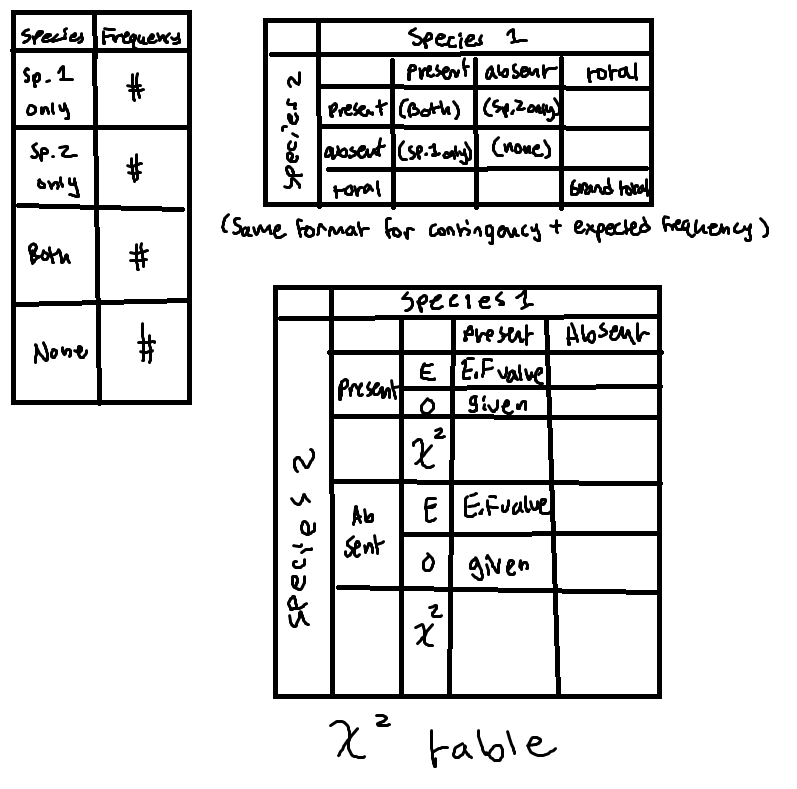
Expected Frequency Formula
from contingency table:
(Row total x Column Total)/ Grand Total
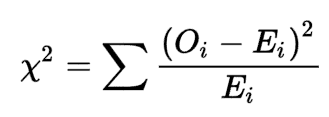
Chi-squared formula
For two species, the sum of (o-e)²/e of the 4 different X² values
Degrees of Freedom Formula
(m-1)(n-1)
m = # of rows
n = # of columns
Bioaccumulation
The absorption of toxins into an organisms body tissue over time
Biomagnification
When toxins are not excreted in orgasnisms and therefore become more concentrated in tissues of higher trophic levels as feeding occurs
(ex. DDT pesticides in aquatic animals/plants → raptors → weak egg shells, or macro/microplastics)
Rewilding
The restoration of natural processes in ecosystems by positive interventions (ex. the forests of Hinewai Reserve have now mostly recovered)
Cyclical Oscillators of Predator Prey Relationships as Density-Dependent Population Control
more prey → more food for preds → more pred pop → more predation → less prey pop → less pred food → less pred pop → less predation → more prey pop…. repeats
Where are cyclical oscillations usually observed?
Habitats where the weather conditions vary from year to year: when beneficial weather occurs one year, the cycle starts from increased producers/prey
Direct interactions between trophic levels
When sequential trophic levels interact with each other, ex. herbivores eating producers
Indirect interactions between trophic levels
When a trophic level has an indirect effect on a non-sequential trophic level, ex. predators decrease herbivore pop, therefore increasing producer pop
Top-Down Population Control
Population control that occurs from changes in a higher trophic level that affects a lower trophic level ex. more preds = less prey
Bottom-Up Population Control
Population control that occurs from changes in a lower trophic level that affects a higher trophic level ex. less water nutrients = less producer pop
Primary Production
The amount of solar energy converted to chemical energy, carried out by producers and measured as the amount of carbon compounds in the biomass produced by autotrophs (usually gm-²yr-1)
Net Primary Productivity equation
Net Primary Productivity = Gross Primary Productivity - Respiration
List of biomes from most to least amount of primary productivity
Tropical rain forest, temperate deciduous forest, savanna, taiga, cultivated land, temperate grassland, tundra
Algal beds, coral reeves, estuaries, open ocean
How/where does chemical energy flow after it is created during primary production?
It flows through the food chain and is lost between trophic levels bc the 2nd law of thermodynamics states that energy transformations are inefficient (10% rule)
How is energy lost between trophic levels?
Cellular respiration: food → ATP → lost as body heat
Food not being completely absorbed → chemical energy lost as waste
Secondary Production
The amount of carbon compounds in biomass formed by heterotrophs (gm-²yr-1), ends up lower than primary production bc heterotrophs usually have increased metabolism and respiration
What happens after secondary production?
Nutrients are recycled
How is carbon cycled?
Oceans store dissolved CO2
Aquatic producers use CO2
Decomposers cycle nutrients ex. filter feeders like mussels
Carbon Flux
The movement of carbon
Carbon source
Sources of carbon that increase carbon flux (ex. respiration)
Carbon sink
Things that store carbon (ex. ocean, atmosphere)
What are the largest natural carbon sinks?
Atmosphere, Ocean, Fossil Fuels
What are abiotic requirements for ecosystem stability?
A steady supply of energy
Nutrient cycling without leakage from the ecosystem
Climate variation that is within tolerance
What are biotic requirements for ecosystem stability?
Biodiversity (many species)
Genetic diversity (within species)
Tipping Point
A threshold past which it is difficult/impossible for an ecosystem to recover, caused by things like deforestation
Describe the effects of deforestation
Positive Feedback Loop: tree removal → decreased rainfall → more drought/wildfire → less trees
Percent Change Formula
(Final-Initial)/Initial x 100 = %
Keystone Species
Species that have a disproportionate effect on the structure and sustainability of a community. The removal of these species affects several parts of the food web (ex. sea urchins controlling kelp forests)
Environmental Gradient
Things like altitude, latitude, soil horizons, tidal level, distance from water - all determined by distance usually
Transect Lines
Lines used to measure abundance and distribution along an environmental gradient, usually displayed on kite diagrams
Succession
The replacement of one community by another in an area over time due to changes in biotic/abiotic variables, a temporal phenomenon
Zonation
The gradual change in the composition of species/communities across a landscape based on environmental gradients, a spatial phenomenon
Primary Succession
Forms on newly formed substratum where there was not previously soil or communities
-new substratum formed by volcanos and glacial moraines
Pioneer Community
The first organisms to colonize new substratum, which then die and decompose to change the ecosystem to be more fertile for the next seral community
Secondary Succession
Succession occurring on bare soil where there were pre-existing communities
-bare soil could be caused by rewilding or forest fires
Factors that change during succession
Increased species diversity
More complex energy flow → more diversity → more complex food webs
Increased decomposition → increased soil depth
Increased nutrient cycling
Productivity….
How does productivity change during succession?
NPP initially high because all organisms are simple autotrophs, but later decreases as more heterotrophs are introduced and increase respiration
Ecological Disturbance
A short-term event that causes ecosystem changes that can be abiotic (flood, fires), biotic (new species, disease) or anthropogenic
What does an ecosystem’s ability to tolerate disturbances depend on?
The ecosystem’s diversity and resilience