APES Unit 3 - Populations
1/53
Earn XP
Description and Tags
Name | Mastery | Learn | Test | Matching | Spaced | Call with Kai |
|---|
No analytics yet
Send a link to your students to track their progress
54 Terms
generalist
larger range of tolerance, broader niche makes them less prone to extinction & more likely to be invasive
generalists characteristics
Broad food requirement
High adaptability
Less likely to become extinct
Broad niche
Use a variety of resources
High Range of tolerance
Advantage when change of conditions
specialists
smaller range of tolerance, or narrower ecological niche makes them more prone to extinction
specialists characteristics
Specific food requirements (bamboo)
Less ability to adapt to new conditions
narrow niche
more likely to become extinct
use a specific set of resources
easily affected by changing conditions
have an advantage with constant conditions
why are generalist species advantaged in habitats that change constantly?
they are able to thrive in a wide variety of environmental conditions and can make use of a variety of different resources
why are specialists advantaged in habitats that remain more constant?
they can thrive only in a narrow range of environmental conditions or has a limited diet.
K-selected species characteristics
Few offspring, heavy parental care to protect them
Usually reproduce many times
Long lifespan, long time to sexual maturity = low biotic potential = slow pop. growth rate
More likely to be disrupted by env. change or invasives
K-selected species
most mammals, birds, chimpanzee, humans
R-selected species characteristics
Many offspring, little to no care
May reproduce only once
Shorter lifespan, quick to sexual maturity = high biotic potential = high pop. growth rate
More likely to be invasive
Better suited for rapidly changing env. conditions
R-selected species
insects, fish, plants
biotic potential
The maximum reproductive capacity of an organism under optimum environmental conditions
biotic potential of salmon and whales
whales have low biotic potential because they have fewer offspring salmon have high biotic potential because they have many offspring
Describe whether invasives species are generally k-selected or r-selected
generally r-selected due to their quick pop. growth and faster generation time
why are k-selected species are more negatively impacted by invasive species than r-selected species
Invasives outcompete for resources with high biotic potential & rapid pop. growth, therefore making k selected species less likely to adapt & more likely to go extinct
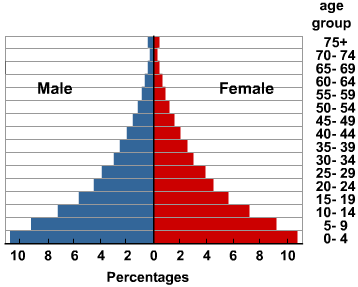
age cohort
people born at roughly the same time who pass through the life course together
survivorship curve
line that shows survival rate of a cohort (group of same-aged individuals) in a pop. from birth to death
Type 1 Curve
K selected
High survivorship early in life due to high parental care
High survivorship in mid life due to large size & defensive behavior
Rapid decrease in survivorship in late life as old age sets in
Type 2 curve
in between r and k selected
Steadily decreasing survivorship throughout life
Type 3 Curve
r selected
High mortality (low survivorship) early in life due to little to no parental care
Few make it to midlife; slow, steady decline in survivorship in mid life
Even fewer make it to adulthood; slow decline in survivorship in old age
why K-selected species generally follow survivorship curve I
They invest a lot of parental care to their offspring which is why their family sizes are smaller. Because time, energy and resources are invested into child rearing
Why do r-selected species generally follow survivorship curve 3?
most of the offspring die off during their early ages and the few live to their old age.
carrying capacity
the max. Number of individuals in a pop. that an ecosystem can support (based on limiting resources)
what factors determine the carrying capacity for deer in a temperate forest ecosystem
disease, predator/prey relationships, habitat destruction and degradation, food availability, hunting pressure, and weather conditions.
overshoot
when a population briefly exceeds carrying capacity
Ex: deer breed in fall, give birth all at once in spring; sudden spike in pop. = overshoot
die off/back
harp decrease in pop. size when resource depletion (overshoot) leads to many individuals dying
Ex: many deer starve with too many new fawns feeding in spring
limiting resource
a particular natural resource that, when limited, determines the carrying capacity of an ecosystem for a particular species.
examples of a limiting resource for a moose population in a boreal forest ecosystem
Predation, habitat, hunting, and environmental conditions have all been implicated as regulatory mechanisms
mortality
the frequency of death in a population.
fecundity
the potential to for a female to become pregnant and carry that pregnancy to a live birth in demography,
how do decreasing resources impact the carrying capacity for a given population
population growth rate slows and eventually stops = known as logistic growth. The population size at which growth stops = the carrying capacity (K), which is the number of individuals of a particular population that the environment can support.
density independent factor
factors that influence pop. growth independent of their size
Ex: natural disasters (flood, hurricane, tornado, fire)
Density-Dependent Factors
factors that influence pop. growth based on size:
Ex: food, competition for habitat, water, light, even disease
A population that is growing and grow at an even faster rate in the future
A population that is in a steady state of gradual population growth
A population that is experiencing negative growth
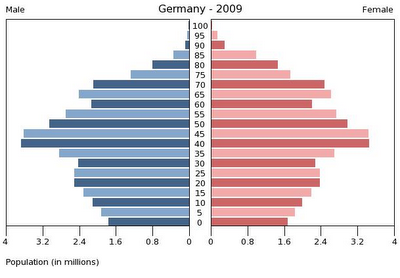
the significance of the base (0-14 age cohorts) of an age structure diagram
prereproductive
current & future growth
population momentum
a consequence of the demographic transition. explains why a population will continue to grow even if the fertility rate declines. defined as the ratio of the size of the population at that new equilibrium level to the size of the initial population.
TFR
avg. number of children a woman in a population will bear throughout her lifetime
Higher TFR = higher birth rate, higher pop. growth rate (generally)
Factors affecting TFR
Development (Affluence): more developed, or wealthy nations have a lower TFR than less developed nations
More educational access for women
More econ. opportunity for women
Higher access to family planning education & contraceptives
Later age of first pregnancy
Less need for children to provide income through agricultural labor
Gov. Policy: can play a huge role in fertility by coercive (forceful) or noncoercive (encouraging) policies
Forced or vol. sterilization
China’s 1 (now 2) child policy
Tax incentives to have fewer children
Microcredits or loans to women without children to start businesses
replacement level fertility rate
the TFR required to offset deaths in a population and keep population size stable
why is replacement level fertility rate higher in developing nations than in developed nations
due to higher infant mortality
the base replacement level fertility rate in developed nations
About 2.1 in developed countries (replace mom & dad)
infant mortality rate
number of deaths of children under 1 year per 1,000 people in a pop.
Higher in less developed countries due to lack of access to: health care, clean water, enough food
Higher IMR = higher TFR, due to families having replacement children
2 factors that contribute to a higher infant mortality rate
No access to clean water
no access to healthcare (hospitals, vaccines, vitamins & supplements for moms & babies)
the relationship between education for women and TFR
More education = fewer unplanned pregnancies
More education = more job. opportunities for women
Alternative to marrying young
Crude Birth Rate & Crude Death Rate (CBR & CDR)
Births & deaths per 1,000 people in a pop.
the equation for determining the growth rate of a country using CBR and CDR
[CBR-CDR] / 10
Thomas Malthus’ theory about human population growth
Earth has a human carrying capacity, probably based on food production
Human population growth is happening faster than growth of food production
Humans will reach a carrying capacity limited by food
the rule of 70
The time it takes (in years) for a population to double is equal to 70 divided by the growth rate
theory of demographic transition
the transition from high to lower birth a death rates in a country or region as development occurs and that country moves from a pre-industrial to an industrialized economic system.
Stage 1 - Preindustrial
High IMR & high death rate due to lack of access to clean water, stable food supply, and healthcare
High TFR due to lack of access to:
Ed. for women
Contraceptives/family planning
Need for child agricultural labor
Little to no growth due to high CBR & CDR balancing each other out
Ex: Virtually no country is in this phase
Stage 2 - Industrializing/Developing
Modernizations brings access to clean water, healthcare, stable food supply
IMR & CDR decline
TFR remains high due to
Lack of ed. for women & contraceptives/family planning
Need for child agricultural labor
Generational lag ( takes time for ed. & societal change to spread
Rapid growth, due to high CBR and declining CDR
Low per capita GDP
Shorter life-expectancy
High infant mortality
High TFR
Low literacy rate & school life expectancy for girls
Stage 3 - Developed/Industrialized
Modernized economy and society increase family income, so TFR declines significantly due to
More ed. opportunities for women
Delayed age of marriage & first child to focus on ed./career
Access to family planning & contraceptives
Slowing growth rate as CBR drops closer to CDR
High per capita GDP
Long life-expectancy
Low infant mortality
TFR, near replacement level (2.1)
High literacy rate & school life expectancy for all
Stage 4 - Post-Industrialized/Highly Developed
Highly modernized countries that are very affluent
TFR declines even further as families become more wealthy and spend even more time on educational & career pursuits
Increased wealth & education brings even more prevalent use of family planning & contraception
CBR drops lower that CDR & growth becomes negative(pop. decline)
Very high per capita GDP
Longest life-expectancy
TFR, below replacement level (2.1)
Highest contraceptive use rates