AP Macro Unit 2 Test
1/96
There's no tags or description
Looks like no tags are added yet.
Name | Mastery | Learn | Test | Matching | Spaced | Call with Kai |
|---|
No analytics yet
Send a link to your students to track their progress
97 Terms
Macroeconomics
Macroeconomics- is the study of the large economy as a whole. It is the study of the big picture.
Instead of analyzing one consumer, we analyze everyone.
Instead of one business, we study all businesses.
Macro was created to:
Macro was created to:
Measure the health of the whole economy.
Guide policies to fix problems.
How do we measure economic growth?
Economists collect statistics on production, income, investment, and savings.
This is called national income accounting.
Gross Domestic Product (GDP)
Gross Domestic Product (GDP) is the dollar value of all final goods and services produced within a country in one year.
-Dollar value
-Dollar value- GDP is measured in dollars.
-Final goods-
-Final goods- GDP only counts NEW goods and services
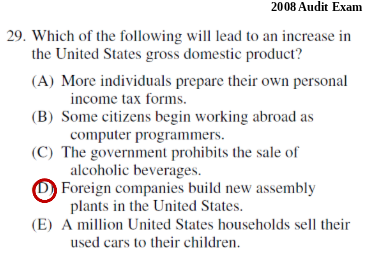
-Within a country
-Within a country- GDP measures production within the country’s borders
-One Year-
-One Year- GDP measures annual economic performance.
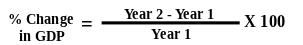
How can you measure growth from year to year?
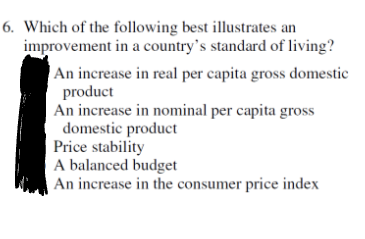
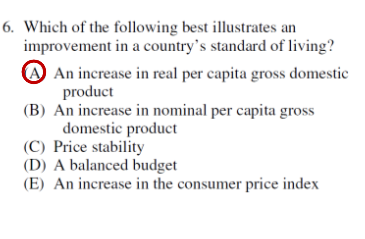
Does GDP accurately measure standard of living?
Standard of living can be measured, in part, by how well the economy is doing…
But it needs to be adjusted to reflect the size of the nation’s population.
Real GDP Per Capita (per person)
Real GDP divided by the population. It identifies on average how many products each person makes.
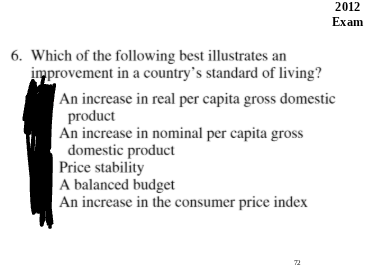
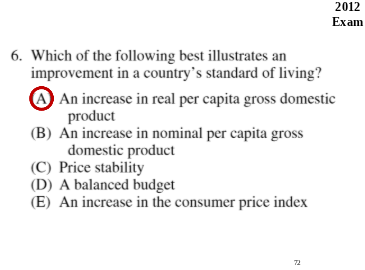
Real GDP per capita is the best measure of a nation’s standard of living.
1. Economic System
Capitalism promotes innovation and provides incentives to improve productivity.
2. Rule of Law-
Countries with solid institutions and political stability have historically had more economic growth.
3. Capital Stock
Countries that have more machines and tools are more productive.
4. Human Capital-
Countries that have better education and training are more productive.
5. Natural Resources
In general, countries that have access to more natural resources are more productive.
Productivity
Output per unit of input
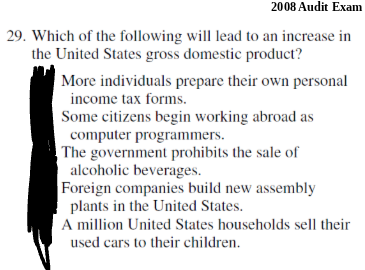
What is NOT included in GDP?
Intermediate Goods
Goods inside the final goods don’t count.
Ex: Price of finished car, not the stock radio or tires.
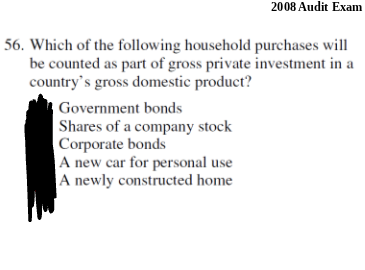
2. Nonproduction Transactions
Financial Transactions (nothing produced)
Ex: Stocks, bonds, real estate
Used Goods
Ex: Old cars, used clothes
3. Nonmarket and Illegal Activities
Things made at home- household production
Ex: Unpaid work, black markets, drugs
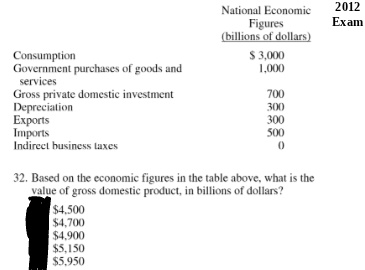
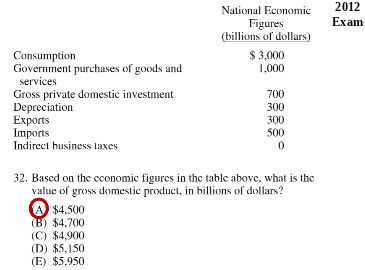
Expenditures Approach
Expenditures Approach-Add up all the spending on final goods and services produced in a given year.
Consumer Spending- ≈ 70% of U.S. GDP Purchases of final goods and services by individuals. Ex: $5 Sandwich at Subway
Business Investment- ≈ 16% of U.S. GDP
Businesses spending on tools and equipment.
Ex: Walmart buys self checkout machines.
3. Government Spending- ≈ 17% of U.S. GDP
Ex: Schools, roads, tanks (NOT transfer payments)
4. Net Exports- Exports (X) – Imports (M) ≈ -3%
Ex: Value of 3 Ford Focuses minus 2 Hondas.
GDP (Y) = C + I + G + (X-M)
Income Approach
Income Approach-Add up all the income earned from selling all final goods and services produced in a given year.
The income approach adds up all the income earned from producing goods and services.
Labor Income - Wages earned from performing work.
Rental Income - Income earned from property owned by individuals.
3. Interest Income- Interest earned from loaning money to businesses.
4. Profit - Money businesses have after paying all their costs.
These are called FACTOR PAYMENTS. Labor earns wages, land earns rent, capital earns interest, and entrepreneurship earns profit.
Value-added Approach
Value-added Approach-Add up the dollar value added at each stage of the production process. In other words, add up the difference between the costs for each business (input) and the price at each step of the production process.
Consumer spending is made up of three components:
1. Durable goods- (ex: washing machines, refrigerators, cars)
2. Non-durable goods- (ex: food, clothes, toilet paper)
3. Services- (ex: dental work, repairs, tutoring)
Investment (I) Explained
In economics we use the word “investment” differently than you usually hear it. Be careful!
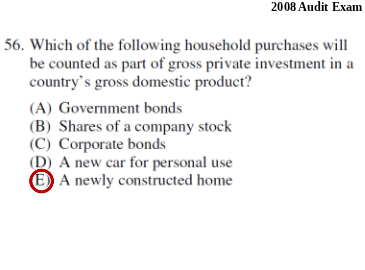
- Investment is NEVER when individuals buy assets like stocks and bonds.
- Investment is ALWAYS when businesses buy capital like machines, resources, and tools.
Is the production of a new home Consumer Spending (C) or Investment Spending (I)?
New real estate counts as Investment spending since a new home can potentially be rented out.
What if a business produces something one year, but doesn’t sell it until the next year?
Inventories- Goods produced and held in storage in anticipation of later sales (count as Investment)
Inventories are counted in the year they are produced, not the year they are sold. The change in inventories is a valuable economic indicator.
Government (G) Explained
Government expenditures tracks the spending made in the “public sector”.
-This includes payments made by the government for goods and services.
Ex: the price of fighter jets and the salaries of the pilots.
-It does not include money spent on transfer payments like welfare, social security, and subsidies.
-It also does not include interest payments on the national debt.
Net Exports (Xn or X-M) Explained
Exports are domestically produced goods and services that are sold/transported abroad.
Imports are foreign produced goods and services that are sold/transported domestically.
Net Exports (Net Xports) are Exports minus Imports (Xports – Mports).
Private Sector-
Part of the economy that is run by individuals and businesses.
Public Sector-
Part of the economy that is controlled by the government.
Factor Payments-
Payment for the factors of production, namely rent, wages, interest, and profit.
Transfer Payments-
When the government redistributes income (ex: welfare, social security).
Subsidies-
Government payments to businesses.
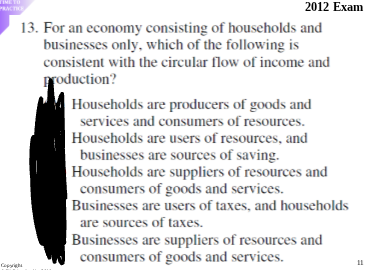
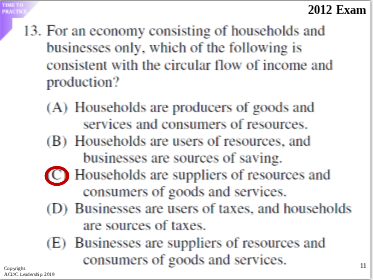
1. Do individuals Supply or Demand?
Both, they demand products and supply resources
2. Do businesses Supply or Demand?
Both, they supply products and demand resources
3. Who Demands in the Product Market?
Individuals and the government
4. Who Supplies in the Product Market?
Businesses
How do we measure economic growth?
Economists collect statistics on production, income, investment, and savings.
This is called national income accounting.
Nonmarket Transactions
Many goods and services provide value, but don’t count towards GDP.
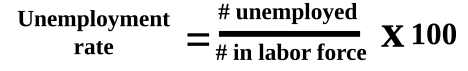
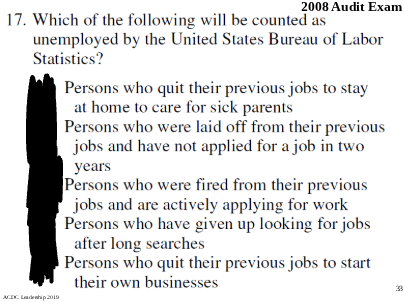
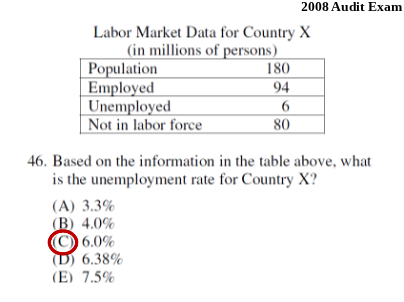
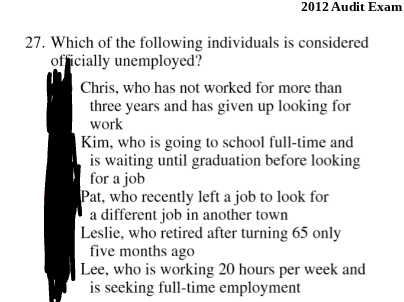
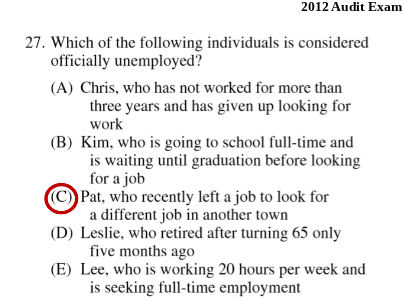
Who is in the Labor Force?
In the Labor Force:
At least 16 years old (to retirement age)
Employed (worked full or part-time in last week)
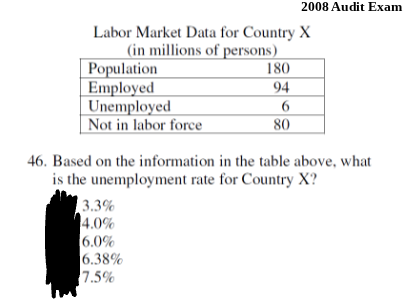
Unemployed (must be actively seeking in last 4 weeks)
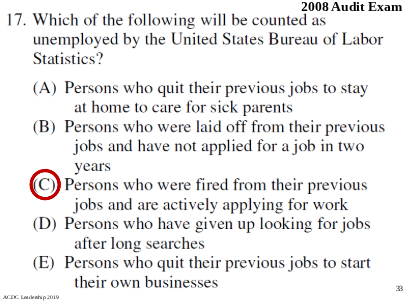
Labor Force = # employed + # unemployed
NOT in Labor Force:
Institutionalized (in jails or hospitals)
In military, in school full time, or retired
Labor Force Participation Rate
What it measures: The percentage of people within the working-age population who are actively seeking employment or currently employed.
Calculation: (Labor Force / Adult Population) x 100
Importance: Indicates the overall level of economic activity within a population.
Factors affecting it: Age demographics, retirement trends, educational attainment, economic conditions, & societal norms around work participation
#1. Frictional Unemployment
Frictional unemployment- Temporary unemployment or being between jobs.
Individuals are qualified workers with transferable skills.
Examples:
High school or college graduates looking for jobs.
Individuals that were fired or are looking for a better job.
Seasonal Unemployment
is a specific type of frictional unemployment, which is due to time of year and the nature of the job.
#2. Structural Unemployment
Structural Unemployment- Changes in the labor force make some skills obsolete.
These workers DO NOT have transferable skills and these jobs will/may never come back. Workers must learn new skills to get a job.
The permanent loss of these jobs is called “creative destruction.”
Examples: VCR repairman, Milkman
Technological Unemployment
Type of structural unemployment where automation and machinery replace workers.
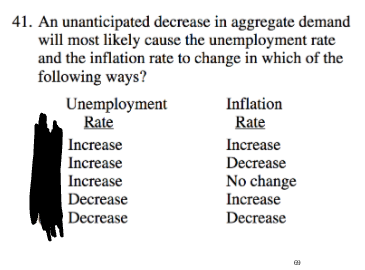
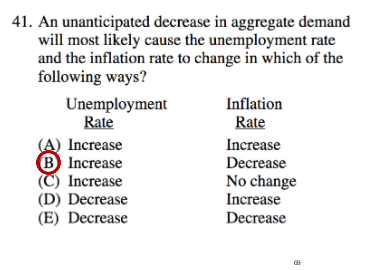
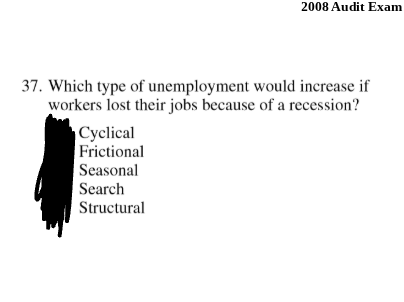
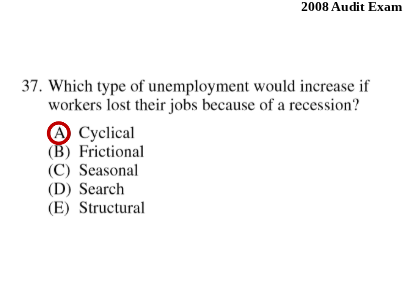
#3 Cyclical Unemployment
Cyclical Unemployment- Unemployment caused by a recession.
As demand for goods and services falls, demand for labor falls and workers are laid off.
This is sometimes called “demand deficient unemployment.”
Examples:
Steel workers laid off during recessions.
Restaurant owners lay off waiters after months of poor sales due to recession.
High unemployment during the Great Depression.
The Natural Rate of Unemployment
Frictional and structural unemployment are present at all times because some people will always be between jobs or replaced by technology.
So, the economy is doing great if there is only frictional and structural unemployment.
Natural Rate of Unemployment (NRU)- Frictional plus structural unemployment. The amount of unemployment that exists when the economy is healthy and growing.
Full Employment Output (Y)
The Real GDP created when there is no cyclical unemployment.
The US is at full employment when there is 4-6% unemployment.
What factors do you think influence a country’s NRU?
When someone is unemployed, what incentives might they have to search for a new job?
For what reasons might a person decide NOT to look for a new job?
How does the government play a role in this?
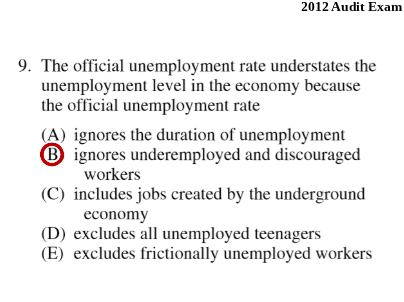
Discouraged Workers-
Some people are no longer looking for a job because they have given up.
Labor Force Participation Rate
Percent of population in the labor force.
If people leave the labor force the unemployment rate falls
Underemployed Workers-
Someone who wants more hours but can’t get them is still considered employed.
Race/Age Inequalities-
The overall unemployment rate doesn’t show disparities for minorities & teenagers.

What is Inflation?
Inflation is rising general level of prices and it reduces the “purchasing power” of money.
Is inflation good or bad?
In general, high inflation is bad because banks don’t lend and people don’t save.
This decreases Investment and GDP.
What about deflation?
Deflation- Decrease in general prices or a negative inflation rate.
Deflation is bad because people will hoard money and assets.
This decreases consumer spending and GDP.
Disinflation
Prices increasing at slower rates.
How is inflation measured?
The government tracks the prices of specific “market baskets” that included the same goods and services.
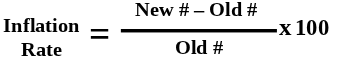
The Inflation Rate
The percent change in prices from year to year.
Price Indices-
Index numbers assigned to each year that show how prices have changed relative to a specific base year.
Calculating the Market Basket
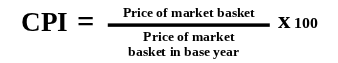
To get the cost of the basket, add up the prices of all items in the basket in a given year. The quantity in the basket must be the same as the base year.
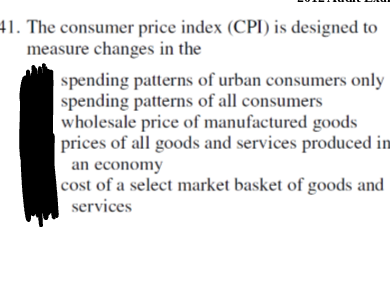
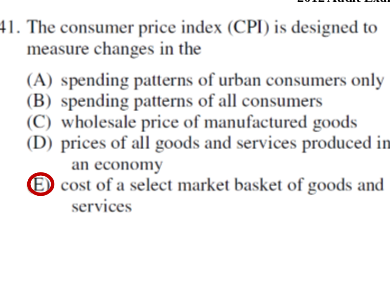
Only items that consumers would normally purchase are included in the Consumer Price Index (CPI)
Consumer Price Index (CPI)
The most commonly used measurement of inflation for consumers is the Consumer Price Index (CPI).
Here is how it works:
The base year is given an index of 100.
To compare, each year is given an index # as well.
Inflation rate calculation
Substitution Bias
As prices increase for the fixed market basket, consumers buy less of these products and more substitutes that may not be part of the market basket. (Result: CPI may be higher than what consumers are really paying.)
New Products
The CPI market basket may not include the newest consumer products. (Result: CPI measures prices but not the increase in choices.)
Product Quality
The CPI ignores both improvements and decline in product quality. (Result: CPI may suggest that prices stay the same though the economic well being has improved significantly.)
Achieving the Three Goals
The government’s role is to prevent unemployment and prevent inflation at the same time.
If the government focuses too much on preventing inflation and slows down the economy, we will have unemployment.
If the government focuses too much on limiting unemployment and overheats the economy, we will have inflation.
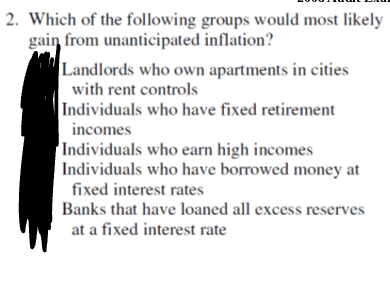
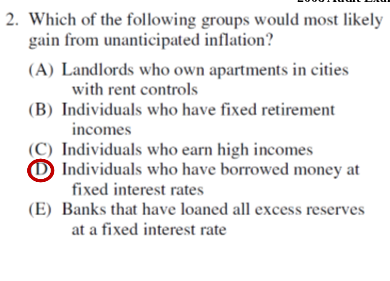
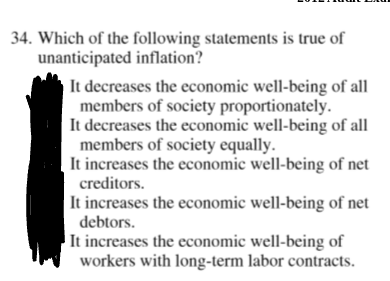
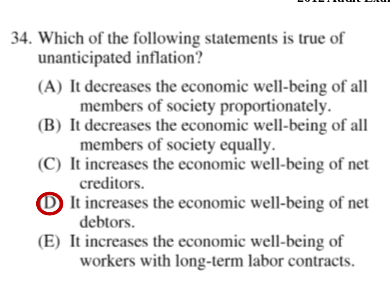
Hurt by Inflation
Lenders-People who lend money (at fixed interest rates).
People with fixed incomes.
Savers
Helped by Inflation
Borrowers-People who borrow money.
A business where the price of the product increases faster than the price of resources.
Nominal Wage
Wage measured by dollars rather than purchasing power.
Real Wage
Wage adjusted for inflation.
. Menu Costs
Costs money to change listed prices.
Businesses must update menus, signs, etc.
2. Shoe Leather Costs
The costs of transactions increase.
People reduce their real money holdings so they must spend time and effort making additional trips to the bank.
3. Unit of Account Costs
Money doesn’t reliably measures the value of goods/services.
Leads to less efficient use of resources because of uncertainty caused by changes in currency value.
Nominal GDP
is GDP measured in current prices. It does not account for inflation from year to year. (ex. Current Yr. Price X Current Yr. Qty)
Real GDP
is GDP expressed in constant, or unchanging, dollars
(ex. Base Yr. Price X Current Yr. Qty).
Real vs. Nominal GDP
Real GDP is better than Nominal GDP for measuring actual growth
CPI vs. GDP Deflator
The GDP Deflator measures the prices of all goods produced, whereas the CPI measures prices of only the goods and services bought by consumers.
An increase in the price of goods bought by firms or the government will show up in the GDP Deflator but NOT in the CPI.
The GDP Deflator includes only those goods and services produced domestically. Imported goods are NOT a part of GDP and therefore don’t show up in the GDP Deflator.
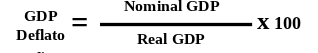
Calculating GDP Deflator
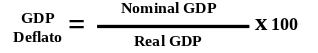
Calculating Nominal GDP

Calculating Real GDP

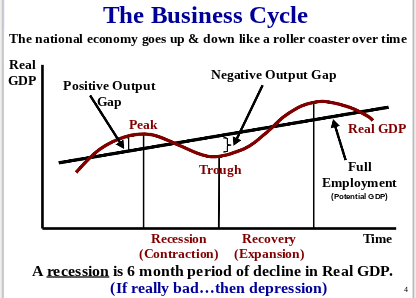
The Business Cycle