Stats exam 2 mega deck
1/35
There's no tags or description
Looks like no tags are added yet.
Name | Mastery | Learn | Test | Matching | Spaced | Call with Kai |
|---|
No analytics yet
Send a link to your students to track their progress
36 Terms
Measuring
assigning a numerical value to represent a property
instrument
thing used to make a measurement
Valid Variables/Measurement
If it is relevant and appropriate as a representation of the property.
Predictive validity
extent to which a test or measurement accurately forecasts future outcomes
Count
Total amount of occurences
Rate
Frequency of those occurrences over a specific time period, often a better measurement than counts
Bias
systematic over- or under estimation of the value of a variable
random error and measurements
measurements have random error when repeated measurements give different results
Variance
How much random error an instrument has
Reliable measurement
has small random error
x̄
Sample mean
deviation
distance of a point from the mean
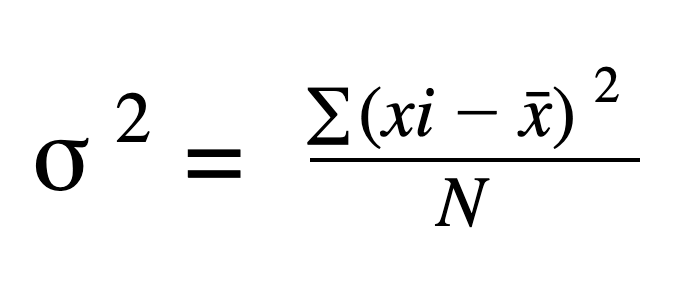
Variance formula
Standard deviation
average distance of points from the mean
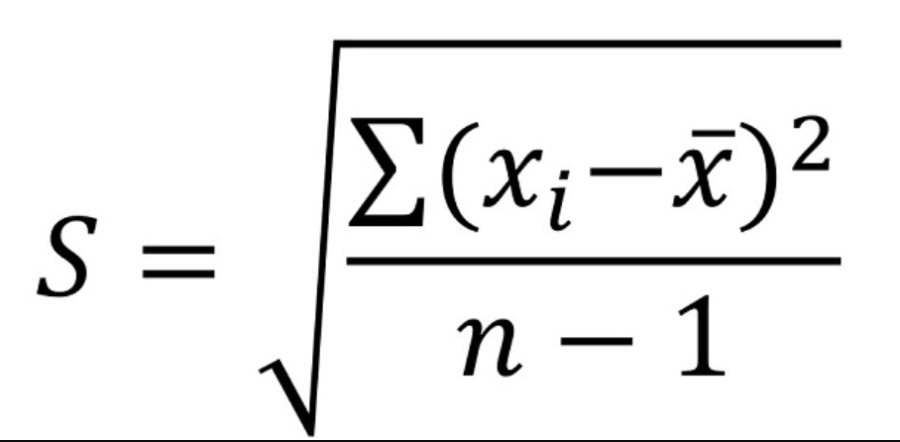
Standard deviation formula
What does a smaller deviation mean?
More consistency
distribution
the possible values that a variable takes on and how often it takes on these values.
Pie chart usage scenarios
When the number of categories is reasonably small(5 or under), and they should each be part of a whole.
Bar chart rules
Vertical axis must start at 0
Bars must have same width
Bars can’t touch, lets you know variable is categorical
Bar chart usage
When comparing larger quantities
timeplot usage
to show how the value of a numerical variable changes over time
Histogram usage
with numerical, especially continuous data with many possible values
Stemplots usage
Numerical, smaller data, allowing for a more detailed view
Stem and leaf example
143
stem would be 14, leaf would be 3
Center
middle of a distribution
Spread
how far the numbers can get from each other
Symmetric shape
left and right sides of the distribution are mirror images
Skewed left
left tail is longer than the right
Skewed right
right tail is longer than the left
Irregular shape
neither skewed nor symmetric
Mode
high point in the distribution, can be uni, bi, or multimodal
Outliers
are individuals which fall outside of the general pattern of the graph
Median
is the 50th percentile of a data set, half the data is above and half is below
Measures of center
Mean and median
percentile
Percent where the rest of the data is at or below
5 number summary components
Minimum
1st Quartile(25 Percentile)
2nd Quartile/Median
3rd Quartile (75 Percentile)
Maximum