AP Macro Unit 2 - Economic Indicators and the Business Cycle
0.0(0)
Studied by 9 people0%Exam Mastery
Build your Mastery score
Supplemental Materials Call Kai
Card Sorting
1/52
Last updated 11:39 AM on 1/31/23
Name | Mastery | Learn | Test | Matching | Spaced | Call with Kai |
|---|
No analytics yet
Send a link to your students to track their progress
53 Terms
1
New cards
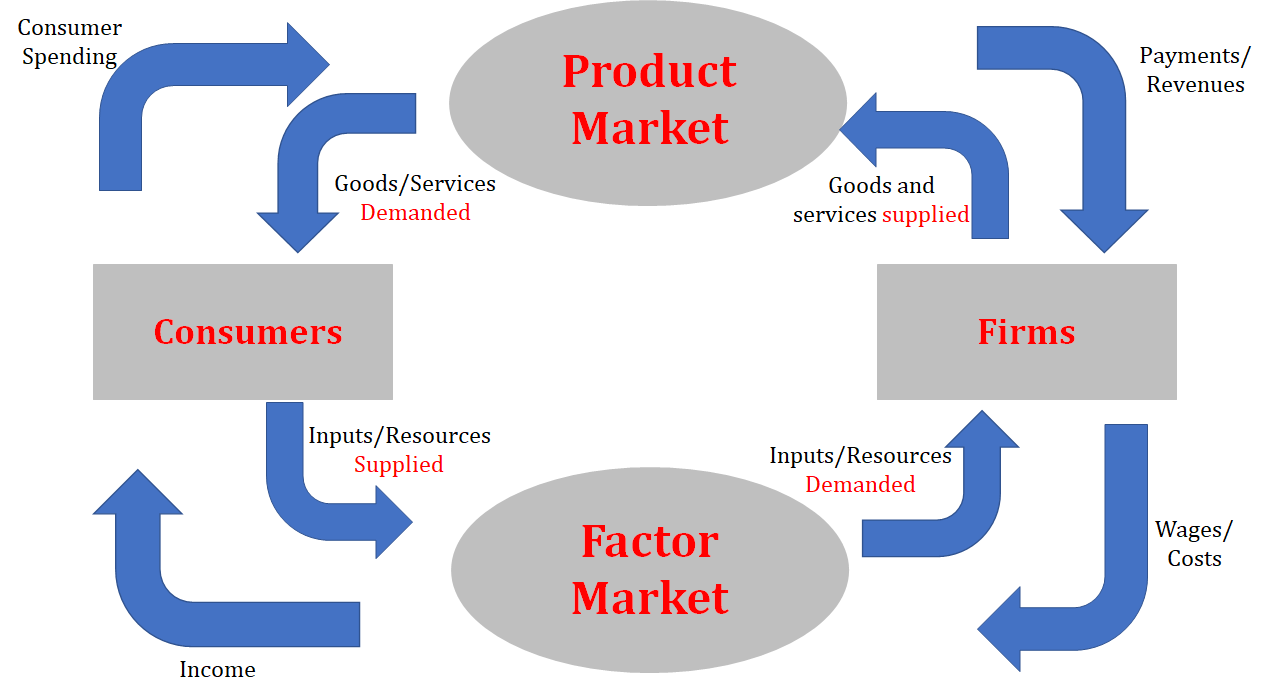
Circular Flow Diagram (definition)
* A graphical representation of how goods, services, and money flow through our economy between consumers and firms
* Based on voluntary exchange
* Based on voluntary exchange
2
New cards
Factor (Resource) Market
* Where factors of production/resources are exchanged
* Firms are demanding, consumers are supplying
* Households/Consumers supply labor, capital, and other resources for income
* Firms purchase labor, capital, land to produce goods/services for the Product Market
* Firms are demanding, consumers are supplying
* Households/Consumers supply labor, capital, and other resources for income
* Firms purchase labor, capital, land to produce goods/services for the Product Market
3
New cards
Product Market
* Where economic goods/products and services are exchanged
* Firms are supplying, consumers are demanding
* Through the sales of goods/services, firms can generate revenue and profit
* Demand is determined by households’ and businesses’ income and willingness and ability to purchase the goods/services
* Supply is determined by firms’ ability and willingness to produce and sell the goods/services at different prices
* Interaction of Supply and Demand determine prices of goods/services and the quantity of goods/services that are exchanged
4
New cards
Voluntary Exchange
* The act of firms and consumers gathering freely in economic markets to achieve beneficial exchange to maximize their economic incentives
5
New cards
Circular Flow Diagram (diagram)
6
New cards
Consumers in the Circular Flow Diagram
* Buy goods in the economy
* Provide labor and receive wages
* Money → Product Market → Goods/Services
* Labor → Factor Market → Wages
* Provide labor and receive wages
* Money → Product Market → Goods/Services
* Labor → Factor Market → Wages
7
New cards
Consumer Spending
* When a consumer sends money to the product market by buying goods
8
New cards
Firms in the Circular Flow Diagram
* Produce in the economy
* Wages/Costs → Factor Market → Resources
* Goods/Services → Product Market → Payment
* Wages/Costs → Factor Market → Resources
* Goods/Services → Product Market → Payment
9
New cards
Gross Domestic Product (GDP)
* The dollar value of all final goods and services produced within a country’s borders in one year
* Helps economists view how productive the economy is over time
* Helps economists view how productive the economy is over time
10
New cards
How is GDP used?
* Compare ourselves with other countries
* See the impact of policy changes
* Compare growth year to year
* See the impact of policy changes
* Compare growth year to year
11
New cards
Expenditures Approach to Calculating GDP
* The sum of all aggregate (total) spending on all final goods and services within a country’s border in one year
* GDP = C + I + G + (X - N)
* C = consumption
* I = investment
* G = government spending
* X = exports
* N = imports
* GDP = C + I + G + (X - N)
* C = consumption
* I = investment
* G = government spending
* X = exports
* N = imports
12
New cards
Main Components of GDP
* Consumer Spending
* Value of any good/service purchased by a consumer
* Investment Spending
* Any spending done by businesses
* Government Spending
* Any spending done by the government
* Net Exports (Exports - Imports)
* The value of all goods/services exported from a country minus the value of all goods/services the country imported
13
New cards
Income Approach to Calculating GDP
* Sum of all the incomes in the economy
* Should equal the Expenditure Approach because all spending is some else’s income
* GDP = W + i + r + p
* W = wages
* i = interest payments
* r = rents
* p = corporate profits
* Should equal the Expenditure Approach because all spending is some else’s income
* GDP = W + i + r + p
* W = wages
* i = interest payments
* r = rents
* p = corporate profits
14
New cards
What is not included in GDP?
* Illegal activities - not part of the legal market and therefore not recorded
* Unpaid work - not considered a market transaction
* Transfer payments - do not represent the production of a good or service
* Intermediate goods - goods that used in the production of other goods and not intended for final consumption, and are considered part of the production process and are not a final good (which is what GDP calculates)
* Depreciation - not a new production of goods/services
15
New cards
Limitations of GDP
* Acronym: PIES
* Population
* When populations are different from country to country, but the countries are producing a similar amount of a product - leads to an inaccurate picture of the standard of living (one country takes the same amount of production and distributes it to a larger population)
* Solution: GDP per capita (GDP/Population)
* Still not perfect, so many orgs use the Human Development Index for standard of living
* Inequality
* If income is not evenly distributed to all families, then it is not an accurate measure of production and economic stability
* Unequal society → less resilient market
* Environment
* GDP may not accurately measure a country’s overall health - externalities (see: AP Micro Unit 6)
* Shadow Economy
* Involves the production of items not reported and therefore not counted in GDP
* Ex. Black Market
16
New cards
Human Development Index
* A summary composite measure of a country’s average achievements in three basic aspects of human development: health, knowledge, and standard of living
17
New cards
Labor Force
* The total number of people who are either employed or actively seeking employment
* Must be 16+ and not in the military, institutionalized, or otherwise unable to work
* Doesn’t include individuals who are retired, in school, or not actively seeking employment
* Important economic indicator
* Insight into available employment opportunities
* Helps economists and policymakers understand the supply of labor in the economy and health of the labor market
* Can help inform policy decisions related to labor market regulation and job creation
18
New cards
Discouraged Workers
* People who are able to work but choose not to look for work
19
New cards
Labor Force Participation Rate
* Percentage of the total population that is in the labor force
* \[(Number of people in the labor force) / (Total Population)\] x 100
* Important indicator of health of the labor market and can be affected by a variety of factors (overall economic activity, availability of jobs, demographic trends)
* \[(Number of people in the labor force) / (Total Population)\] x 100
* Important indicator of health of the labor market and can be affected by a variety of factors (overall economic activity, availability of jobs, demographic trends)
20
New cards
Household Surveys
* Help economists measure the size and composition of the labor force
* Ask individuals about their employment status and job search activities
* Ask individuals about their employment status and job search activities
21
New cards
Employer Surveys
* Help economists measure the size and composition of the labor force
* Ask employers the number of workers on their payrolls and the number of job openings
* Ask employers the number of workers on their payrolls and the number of job openings
22
New cards
Unemployment Rate
* The percentage of the labor force that is not employed
* A key economic indicator to understand labor in the economy
* Not included as unemployed
* Retired individuals, criminals, etc.
* \[(Number of unemployed individuals) / (Labor Force)\] x 100
* A key economic indicator to understand labor in the economy
* Not included as unemployed
* Retired individuals, criminals, etc.
* \[(Number of unemployed individuals) / (Labor Force)\] x 100
23
New cards
Types of Unemployment
* Frictional Unemployment
* Occurs when individuals are in between jobs or are searching for their first job
* “Healthy” unemployment - regular and natural part of the economy
* Example: Student that has just graduated looking for their first job
* Structural Unemployment
* Occurs when there’s a mismatch between the skills and abilities of workers and the requirements of available jobs
* Can happen when there are changes in the economy - technological advances, shift in demand of goods/services, etc.
* Difficult to address, as it may require new training/education and require time and/or government intervention
* Example: Typewriter repairman - no longer needed in the modern day
* Seasonal Unemployment
* Jobs that are no longer needed with changing seasons
* Example: Lifeguard, agriculture, etc.
* Cyclical Unemployment
* Occurs when there is economic recession or downturn, when there is lack of demand for goods/services and firms cut down on production and hiring
* Firms may reduce production levels or go out of business, increasing the unemployed population
* “Unhealthy” unemployment - result of economic decline and difficult to reverse
* Example: Chef is fired during a recession because business is slow
24
New cards
Full Employment
* Refers to a status where there is little or no cyclical unemployment
* Frictional and Structural Unemployment will always exist
* Frictional and Structural Unemployment will always exist
25
New cards
Natural Rate of Unemployment
* Rate at which there is only frictional and structural unemployment
* Argued to be around 4-6% unemployment
* Argued to be around 4-6% unemployment
26
New cards
Inflation
* Occurs when the general level of prices in an economy is rising
* Expressed as a percentage and represents the rate at which the general price level is increasing over time
* Can affect purchasing power of money as prices for goods/services increase faster than wages/incomes
* Moderate inflation is good for the economy
* Incentivises spending because prices will be higher later
27
New cards
Deflation
* Opposite of inflation
* Occurs when the general rate of prices in an economy is falling
* Expressed as a negative percentage and represents the rate at which the general price level is decreasing over time
* Can lead to decrease in demand and decrease in economic activity
* Occurs when the general rate of prices in an economy is falling
* Expressed as a negative percentage and represents the rate at which the general price level is decreasing over time
* Can lead to decrease in demand and decrease in economic activity
28
New cards
Disinflation
* A slower rate of inflation or slowing down of the rate at which general price level is increasing
29
New cards
Stagflation
* Where prices rise and the economy contracts
30
New cards
Price Index
* A statistical measure that reflects the changes in the general level of prices for a basket of goods and services over time
* Commonly used to measure inflation and deflation, as they provide a way to track changes in the general price level of an economy
* Commonly used to measure inflation and deflation, as they provide a way to track changes in the general price level of an economy
31
New cards
Consumer Price Index (CPI)
* A common price index
* Measures the changes in the prices of a basket of goods and services consumed by households
* Calculated by the Bureau of Labor Statistics in the US
* They collect price data for goods/services in the market basket from a sample of retailers, service providers, and other sources
* Prices collected are used to calculate the cost of the market basket at the base period, then compares that cost to the current period
* Base year is valued at 100, and all other numbers represent a percent increase or decrease
* Used to measure the changes in the cost of living over time
* Based on a market basket of goods and services that is representative of the purchases made by households
* Includes food, clothing, housing, transportation, and medical care
* Careful, might not consider substitution bias!
32
New cards
Substitution Bias
* Occurs when consumers switch to cheaper alternatives as the price of certain goods and services increase
33
New cards
CPI Formula
\[(Current Market Basket) / (Base Year Market Basket)\] x 100
34
New cards
Inflation Rate Formula (GDP Deflator)
\[(GDP Deflator 2 - GDP Deflator 1) / GDP Deflator 1\] x 100
35
New cards
Inflation Rate Formula (CPI)
\[(CPI2 - CPI1) / CPI1\] x 100
36
New cards
Unanticipated Inflation
* A surprise rise in general prices
* Consumers and producers were not given chance to adjust in advance
* Consumers and producers were not given chance to adjust in advance
37
New cards
Costs of Inflation
* Menu Costs
* Result from a firm having to change prices
* Example: Walmart hiring additional workers to replace all price tags on their products every week
* Shoe Leather Costs
* The cost of time and effort people end up spending to counteract the costs of inflation
* Example: Businesses may hold less cash or have to make more trips to the bank during inflation
* Loss of Purchasing Power
* Occurs because inflation causes the value of the dollar to decrease over time
* Example: Individuals who have the same wage they do the next year as the previous year cannot purchase as much with rising prices
* Wealth Redistribution
* Involves the real value of wealth being transferred from one group to another
* Inflation affects the amount of interest being repaid or earned
38
New cards
Individuals Helped by Inflation
* Borrowers with fixed interest rates
* Inflation can reduce the real value of the debt they owe
* Owners of assets
* Inflation can increase the nominal value of their assets
* Firms that can cut real wages
* Inflation can allow firms to reduce the nominal wages of their workers without reducing their purchasing power
* Inflation can reduce the real value of the debt they owe
* Owners of assets
* Inflation can increase the nominal value of their assets
* Firms that can cut real wages
* Inflation can allow firms to reduce the nominal wages of their workers without reducing their purchasing power
39
New cards
Individuals Hurt by Inflation
* Savers
* Inflation can erode the purchasing power of savings as the saved money loses value over time to rising prices
* Especially hurtful to those who rely on their savings for long-term financial stability (such as retirees)
* Savers can invest in assets expected to increase in value at a higher rate than inflation (real estate, stocks, certain bonds) or adjust their saving strategies to account for inflation
* Workers on fixed incomes
* Inflation can make it difficult to keep up with rising prices if income does not rise at the same rate as inflation
* Can lead to a decline in their standard of living
* Example: Those on a pension or disability benefits
* Borrowers with variable rates
* Inflation will lead lenders to increase interest rates to pay for the cost of inflation
40
New cards
Nominal GDP
* Total market value of all goods and services produced in an economy in a given year with current market prices
* Used as a measure of economic growth and is often used to compare economic performance over time
* Doesn’t account for inflation’s impact on the economy
* Used as a measure of economic growth and is often used to compare economic performance over time
* Doesn’t account for inflation’s impact on the economy
41
New cards
Real GDP
* Measure of economic growth that adjusts for the impact of inflation
* Calculated by adjusting nominal GDP for the effects of inflation using a base year as a reference point
* Allows for more accurate comparison of economic performance over time as it accounts for changes in purchasing power of money
* Calculated by adjusting nominal GDP for the effects of inflation using a base year as a reference point
* Allows for more accurate comparison of economic performance over time as it accounts for changes in purchasing power of money
42
New cards
Nominal GDP Equation
* Multiply the amount of each good produced by the price of that particular year
43
New cards
Real GDP Equation
* Multiply the amount of each good produced by base year prices
44
New cards
GDP Deflator
* Used to measure the effects of inflation by deflating nominal GDP
* It compares the nominal and real GDP of a country in a year
* When nominal GDP = real GDP, the GDP deflator is 100
* It compares the nominal and real GDP of a country in a year
* When nominal GDP = real GDP, the GDP deflator is 100
45
New cards
GDP Deflator Equation
* (Nominal GDP / Real GDP) x 100
46
New cards
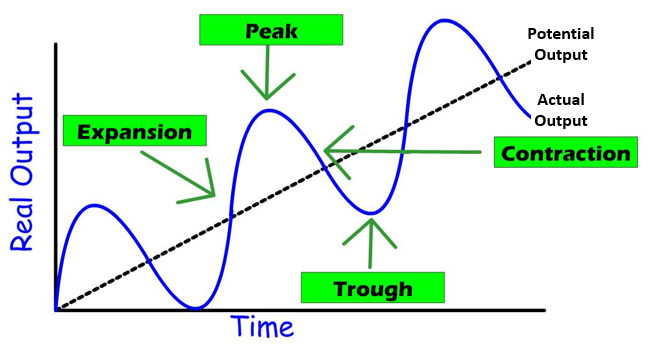
The Business Cycle (definition + chart)
* The cyclical pattern of expansion and recession of the economy over time
* Expansion and Peak = Expansionary Phase
* Contraction and Trough = Contractionary Period
* Expansion and Peak = Expansionary Phase
* Contraction and Trough = Contractionary Period
47
New cards
Actual Output on the Business Cycle
* The squiggle line
* Shows the short run economic growth
* Shows the short run economic growth
48
New cards
Potential Output on the Business Cycle
* The straight line
* Shows the long run economic growth
* Shows the long run economic growth
49
New cards
Actual Output = Potential Output
* Economy is experiencing full employment and is reaching its goals of promoting economic growth, preventing unemployment, and limiting inflation
50
New cards
Expansionary Phase of the Business Cycle
* The economy is growing in the short run
* Unemployment is typically low
* Inflation is rising
* AKA Inflationary Gap because of the positive gap between actual output and potential output
* Unemployment is typically low
* Inflation is rising
* AKA Inflationary Gap because of the positive gap between actual output and potential output
51
New cards
Contractionary Period of the Business Cycle
* The economy is shrinking in the short run
* Unemployment is high
* Inflation is low
* Unemployment is high
* Inflation is low
52
New cards
Economic Recession
* A period of two straight fiscal quarters (6 months) of negative GDP growth
* Can develop into a depression
* Can develop into a depression
53
New cards
Economic Depression
* A particularly severe and long recession that occurs for years