Exam 2 Psych201
1/50
There's no tags or description
Looks like no tags are added yet.
Name | Mastery | Learn | Test | Matching | Spaced |
|---|
No study sessions yet.
51 Terms
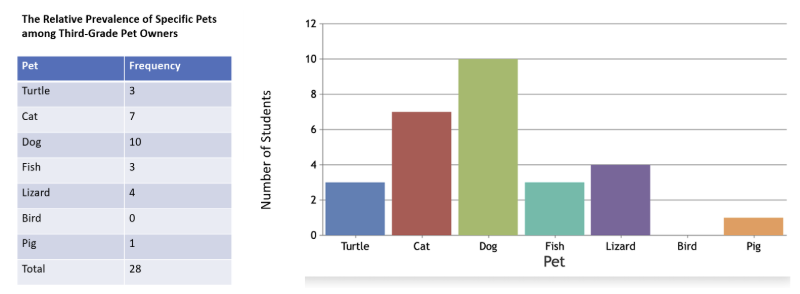
Frequency distribution
a representation, in either tabular or graphical form, that displays the number of observations for each score or within a particular interval
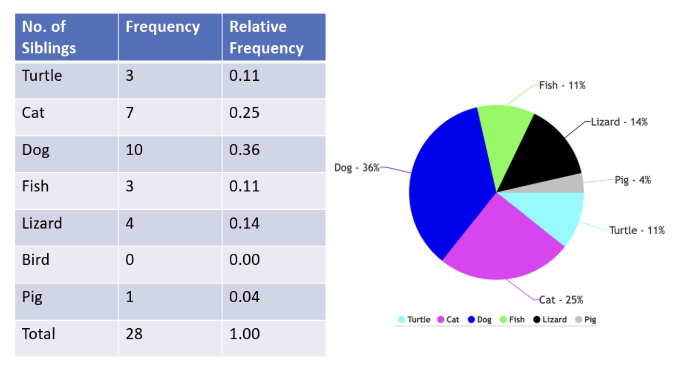
Relative Frequency Distribution
a representation that shows the proportion (or percentage) of the total number of observations associated with each value or class of values
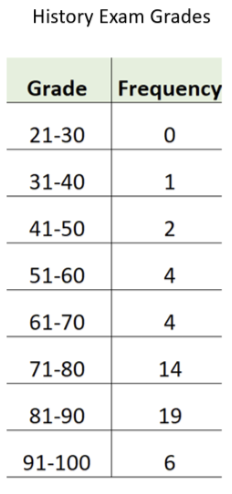
Class interval frequency distribution
a representation where data are grouped by interval (bins) and the frequency for each is listen. Appropriate for data that is on the interval or ratio scale
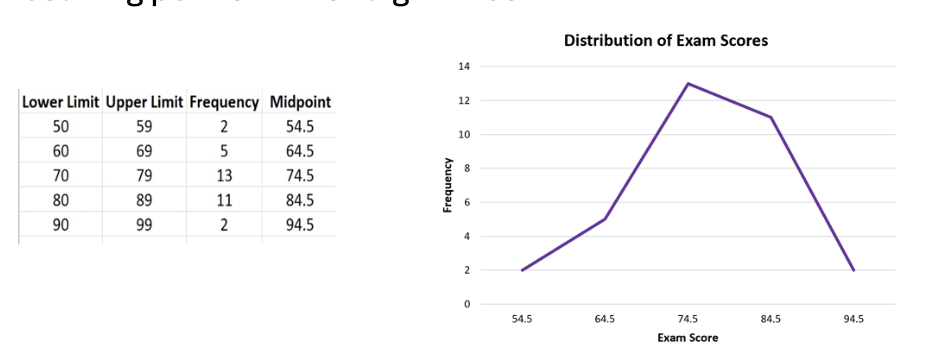
Frequency polygon
a line graph that shows the distribution of continuous data by plotting the frequency of each class at its midpoint and connecting these points with straight lines
Descriptive statistics
numeral measures that describe a distribution by providing information on the central tendency of the distribution, the width of the distribution, and the shape of the distribution (mean, median, mode, etc)
Inferential statistics
Procedures for drawing conclusions about a population based on data collected from a sample
Measures of central tendency
Measures that characterize the middleness of an entire distribution (mean, median, mode)
Parameters
numbers that describe the properties of the ENTIRE POPULATION
Statistics
Numbers that describe the properties of a SAMPLE. Can provide an estimate of the population parameters
Population mean symbol
µ
Population standard deviation symbol
σ
Sample mean symbol
x̅
Sample standard deviation symbol
Sx
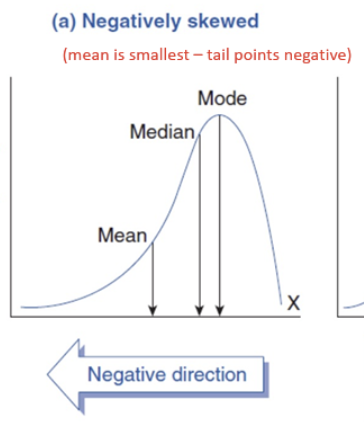
Negatively skewed distribution
Tail points in negative direction. Mean < median < mode
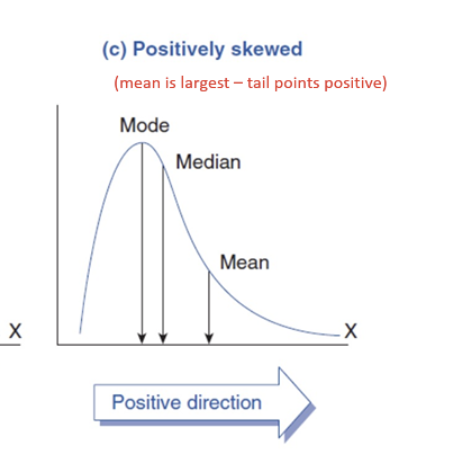
Positively skewed distribution
Tail points in positive direction. Mode < median < mean
Excess kurtosis
a measure of the “tailedness" of the distribution relative to a normal distribution. Includes leptokurtic, mesokurtic, and platykurtic
Leptokurtic
kurtosis > 0 (light tails). Sharper central peak, fatter tails compared to normal distribution

Mesokurtic
kurtosis = 0. Normal distribution
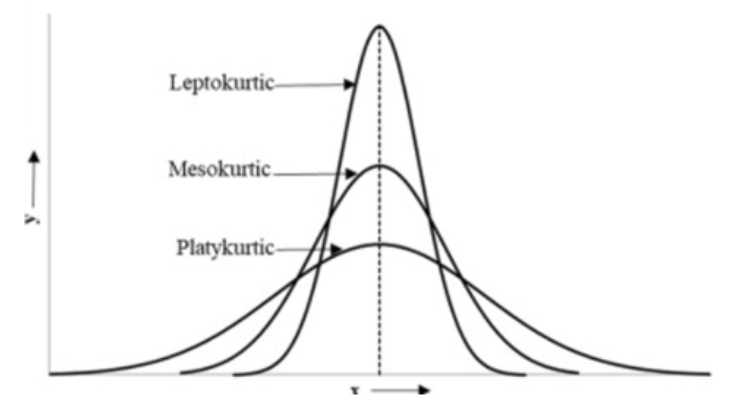
Platykurtic
kurtosis < 0 (heavy tails). Shorter central peak, thinner tails

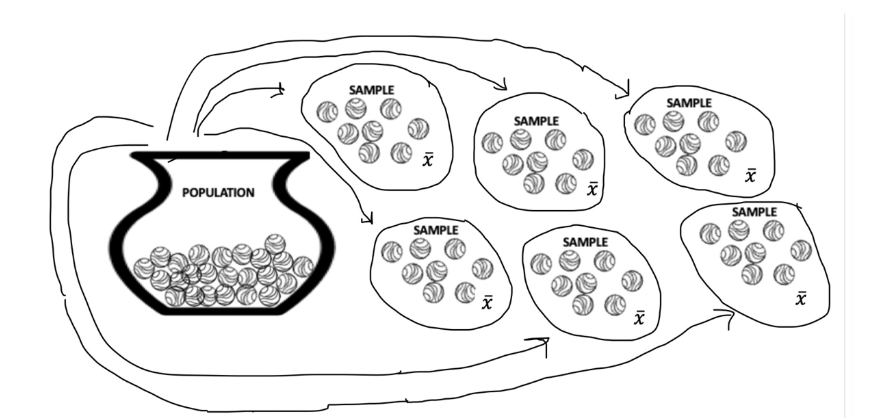
Sampling distribution
the distribution of a statistic (e.g., the mean) made from multiple samples of the same size taken from the population
Central limit theorem rules
If a population has a normal distribution, the sampling distribution of the mean is normally distributed.
If the sample size is at least 30, the sampling distribution of the mean will be normally distributed regardless of shape of population distribution
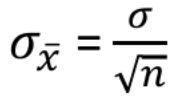
Standard error of the mean
the standard deviation of a sampling distribution of the sample mean. Indicates how much a sample mean is likely to differ from the true population mean. Lower standard error means mean is a more precise measure of population mean. Larger samples tend to provide a more precise estimate of pop mean.
Coefficient of determination (R²)
Measures the proportion of variance in one variable that is accounted by another variable. ex. 88% of variance in weight can be explained by the variance in height
Norm-referenced tests
a test that includes norms designed to compare the performance of examinees taking test to performance of similar individuals who took the same test and whose scores were used to generate the norms.
Norming group
Sample taken from the population of all potential examinees for a norm-referenced test. It is often a stratified random sample defined by gender, age, SES, race, geographic region
National norm
Compare student with the population at large in norm-referenced test
Local norm
Compare student with students that match on some demographic variable (ex. school district) in norm-referenced test
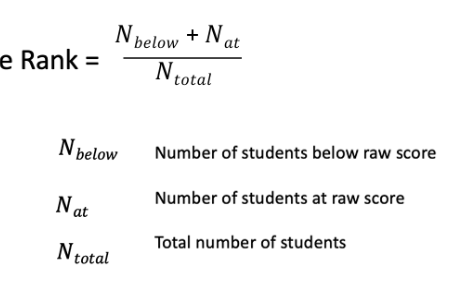
Percentile rank
Way to report test score that outlines the percentage of examinees that score at or below that score. Normal distributions can be used to calculate.
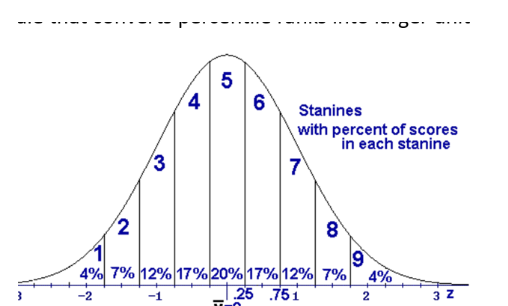
Stanines (standard nine)
Way to report test score where there is a nine-point scale that converts percentile ranks into larger unites. Divides normal distribution into 9 parts and the parts are not equal. Middle stanine is 5 and is 20%
Grade equivalent
A way to report tests score where a scale used to convert raw scores into grade level norm by expressing scores in terms of years then months (ex. 4.2 corresponds to a score of average students in the second month of fourth grade)
Grade equivalent 7.5 in 4th grade example
Means that the average seventh grader in the fifth month of the year would be expected to get the same score as that fourth grader if the seventh grader took the fourth grader’s test. Does not mean fourth grader took seventh grader test or that the fourth grader would score like a seventh grader in all areas
Criterion referenced test
a test used to compare the performance of an individual to certain criteria. Measures learning of skills and mastery of learning objectives based on curriculum. May be expressed as a percent correct (80% = mastery), scores presented in categories (meet, exceed expectations), or in online courses where you must reach mastery to move to next section
Reliability
the level of consistency of an instrument and the degree to which the same results are obtained when the instrument is used repeatedly with the same individuals or groups (ex. in archery target, all arrows hit the same target)
Theory of reliability
observed score = true score + error. Error can be reduced by using good test questions, clear instructions, and creating a proper testing environment
Test-retest reliability
a procedure for assessing the reliability of a test by administering the test twice to the same group of examinees and correlating the two sets of test scores (usually within 6 months of first test)
Test-retest reliability problems
Time consuming, experience that occurs between testing sessions can affect score, and experience of prior testing may affect subsequent score
Alternate-forms reliability
an approach used to assess the degree of consistency between two forms of the same test. Problem: it’s difficult to develop 2 equivalent forms
Internal consistency
Approach that uses scores from a single test session to measure reliability (easiest method). Includes split half method
Split half method
Procedure that divides items into two halves and correlates the score from one half with the other (internal consistency)
Validity
The degree to which an instrument measures what it is supposed to measure AND the appropriateness of specific inferences and interpretations made using test scores.
Content validity
Degree to which an instrument measures a representative sample of behaviors and the content of the domain about which inferences are to be made. Extent of the match between test and content it is intended to measure (does the test match the curriculum?)
Criterion-related validity
The degree to which an instrument is related to another measure, called criterion. Includes concurrent validity and predictive validity
Concurrent validity
type of criterion-related validity where the correlation between scores from an instrument is compared to the scores from another well-established instrument that measures the same thing
Predictive validity
type of criterion-related validity that describes the extent to which an instrument can predict some future performance (ex. driving test and driving ability)
Construct validity
The extent to which a test measures and provide accurate information about a theoretical trait or characteristic
Face validity
The extent to which an instrument appears to measure what is it intended to measure. Sometimes we don’t want face validity to be high because we don’t want subjects knowing what’s really being tested (like in psych experiment).
Alternative hypothesis (H1)
Predicts a significant difference between conditions being tested (ex. Light color affects plant growth)
Null hypothesis (H0)
the hypothesis predicting that no difference exists between groups being compared (ex. Plant growth is not affected by light color)
Type I error
rejects null when null is true. (ex. boy cries wolf (rejecting null), but there is no wolf)
Type II error
Not rejecting null, when null is false. (ex. Boy doesn’t cry wolf (doesn’t reject null), but there is a wolf)
Power
rejecting the null hypothesis when alternative hypothesis is true. (ex. boy cries wolf (rejects null), and there is a wolf)