AP Statistics Exam Review Flashcards
1/82
Earn XP
Description and Tags
Name | Mastery | Learn | Test | Matching | Spaced | Call with Kai | Chat |
|---|
No analytics yet
Send a link to your students to track their progress
83 Terms
Additional Rule
General Rule (Non-Mutually Exclusive): Used when events can happen simultaneously. You subtract the probability of both events occurring to avoid double-counting.
Example: Drawing a Heart (13/52) or a Queen (4/52)
Mutually Exclusive Events: Used when events cannot happen simultaneously
Example: Rolling a 3 or a 5 on a single die
Bias
A systematic, non-random error that causes a misalignment between the true population parameters and the sample statistics, resulting in distorted results that consistently overestimate or underestimate a value
Binomial Setting
A probability model for a scenario involving a fixed number of independent trials (n), where each trial has only two possible outcomes—labeled "success" (p) or "failure" (1 - p)—and the probability of success remains constant across all trials
Binary: Outcomes are strictly "success" or "failure".
Independent: The outcome of one trial does not affect another.
Number: There is a fixed number of trials (n) determined beforehand.
Success: The probability of success (p) is the same for each trial
Binomial Distribution
A graph that models the number of successes (x) in a fixed number (n) of independent trials, each with a constant probability of success (p).
Binomial Random Variable
a discrete random variable that counts the number of successes in a fixed number of independent trials, where each trial has only two possible outcomes ("success" or "failure") and the probability of success (p) is constant.
Blinding
An experimental design technique used to prevent bias by concealing which treatment subjects receive.
Prevent bias by concealing which treatment subjects receive. It ensures that participants and researchers do not know group assignments, reducing the impact of expectations or subjective interpretation on results
Block Design
An experimental technique used to reduce variability by grouping similar experimental units into "blocks" based on a shared characteristic before randomly assigning treatments within each block
Central Limit Theorem
states that for a sufficiently large sample size (n>30)
It allows for normal-based statistical inference (confidence intervals/hypothesis tests) even with skewed data.
Chi-Squared Distribution
The chi-square distribution is a fundamental probability distribution in inferential statistics used primarily for hypothesis testing, goodness-of-fit tests, and confidence intervals
t describes the sum of squared independent standard normal random variables, with its shape determined solely by degrees of freedom
Chi-Squared Statistic
A numerical measure used in statistics to determine the difference between observed and expected frequencies in categorical data.
Chi-Squared GOF Test
a statistical hypothesis test that determines if an observed frequency distribution of categorical data matches an expected, theoretical distribution
Chi-Squared Test for Homogeneity
Determines if different populations (or groups) share the same distribution of a single categorical variable.
Checks if differences in observed frequencies are due to sampling error or actual population differences, using a null hypothesis that all populations have the same distribution
Chi-Squared Test for Association/Independence
a statistical method used to determine whether two categorical variables are related in a population
It evaluates if the observed frequencies in a contingency table significantly differ from the frequencies we would expect if the variables were completely independent
Cluster Sample
a probability sampling method where the population is divided into heterogeneous groups(often based on location), and a simple random sample (SRS) of these clusters is chosen
Coefficient of Determination
measures the proportion of variability in the response variable (y) that is explained by the linear regression model using the explanatory variable (x).
Complement
represents all outcomes in the sample space that are not included in a sample
Conditional Probability
measures the likelihood of an event (A) occurring, given that another event (B) has already happened, denoted as P(A|B)
Conditions for Inference About a Mean
Random: The data must come from a random sample or a randomized experiment to prevent bias and ensure generalization
Normal / Large Sample: states the population is normally distributed, the sample size is large (n>30) (CLT),a graph of the sample data shows no strong skewness or extreme outliers.
Independence (10% Rule): When sampling without replacement, the sample size (n) must be no more than 10% of the total population size (N), written as n >0.10N
Conditions for Inference About a Proportion
Random: The data must come from a randomized experiment or a random sample to avoid bias.
10% Condition: The sample size must be <10% of the overall population to ensure independence of individual observations (when sampling without replacement).
Large Counts / Normal: The sampling distribution must be approximately Normal. Both the number of successes(np) and failures n(1-p) in your sample must be at least 10
Conditional for Regression Inference
L - Linear: The relationship between the explanatory variable (\(x\)) and response variable (\(y\)) must be genuinely linear.
I - Independent: Individual observations must be independent of each other.
N - Normal: For any fixed value of \(x\), the response variable (\(y\)) should vary normally.
E - Equal Variance (Homoscedasticity): The standard deviation of the residuals must be consistent across all values of \(x\).
R - Random: The data must be produced by a well-designed random sample or randomized experiment
Confidence Interval for a Population Mean
A confidence interval estimates the true population mean using sample data, providing a range of plausible values and a margin of error.
Confidence Interval for a Population Proportion
used to estimate an unknown population proportion (\(p\)) based on sample data.
Confidence Intervals and Two-Sided Tests
Confidence Intervals and Two-Sided Significance Tests are mathematically dual; a two-sided test at significance level (a) and a (1-a) confidence interval will always reach the same conclusion. If the null value falls inside the interval, you fail to reject Ho; if it falls outside, you reject Ho
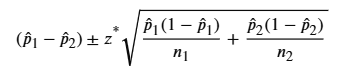
Confidence Intervals for Comparing Two Proportions
A two-proportion \(z\)-interval estimates the difference between two population proportions, p1 - p2, using sample data.
Comparing Two Means
Involves analyzing the difference between two independent population means ) using a two-sample t-test
Confidence Level
estimate unknown population parameters mean or proportion using a range of plausible values derived from sample data.
Confounding Variable
an outside factor related to both the explanatory (independent) and response (dependent) variables, making it impossible to tell which variable caused the observed outcome
Continuous Random Variable
takes on any numerical value within an interval (e.g., time, weight, height) and is modeled by a Probability Density Function (PDF) curve
Control Group
a baseline group in an experiment that does not receive the new treatment or receives a placebo/standard treatment, allowing comparison to the experimental group
Convenience Sampling
a non-probability sampling method that selects individuals who are easiest to reach, often leading to biased results because it fails to represent the entire population
Correlation
measures the strength and direction of a linear relationship between two quantitative variables, ranging from -1 to +1.
Critical Value
determines the boundaries of the rejection region in hypothesis testing or defines the margin of error in confidence intervals
Discrete Random Variable
numerical outcomes of chance processes with a countable, finite set of distinct values and associated probabilities.
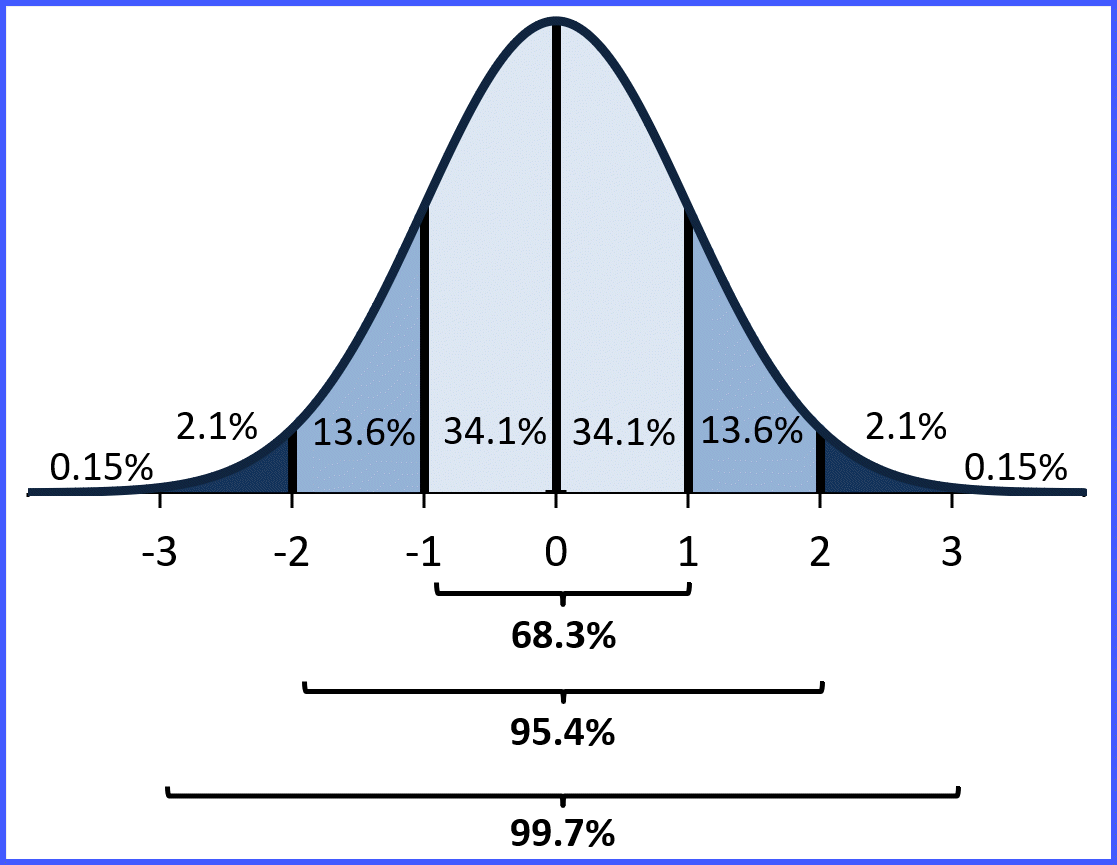
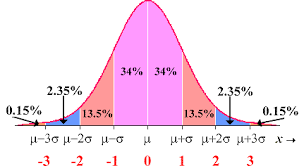
Empirical Rule
he Empirical Rule (68-95-99.7 rule) in AP Statistics states that for normal distributions, approximately 68% of data falls within 1 standard deviation of the mean, 95% within 2 standard deviation, and 99.7% within 3 standard deviations
Experiment
a study that deliberately imposes a treatment on individuals to measure their responses, aimed at establishing causation
Explanatory Variable
the variable used to explain, predict, or cause changes in another variable—the response variable—in a statistical study
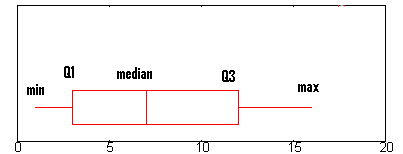
Five-Number Summary
provides a concise snapshot of a dataset's distribution, consisting of the Minimum, First Quartile (Q1), Median (Q2), Third Quartile (Q3), and Maximum.
Geometric Setting
occurs when independent trials are repeated until the first success, characterized by the BINS acronym: Binary (success/failure), Independent trials, same Number (constant probability (p), and Success
Geometric Distribution
models the number of independent Bernoulli trials needed to achieve the first success.
Geometric Random Variable
models the number of independent trials needed to achieve the first success in a Bernoulli process, where each trial has a constant probability of success p
Inference about a Population Proportion
involves estimating or testing claims about a population parameter using a sample proportion
Inference about a population mean
involves using sample data to estimate or test claims about a true population mean using t-procedures, as the population standard deviation is rarely known
Inference for Comparing Two Proportions
involves using a two-sample \(z\)-test or a two-sample \(z\)-interval to compare independent population proportions (p1-p2) based on sample data
Inference for Comparing Two Means
involves using a two-sample t-procedure to test if the difference between two independent group means (\(\mu_1 - \mu_2\)) is statistically significant.
Interquartile Range (IQR)
represents the spread of the middle 50% of data, calculated as IQR = Q3 - Q1
Law of Large Numbers
states that as the number of independent, random trials (\(n\)) increases, the experimental (sample) mean or proportion converges to the theoretical (population) mean or probability
Least Squares Regression Line (LSRL)
e unique "line of best fit" for a scatterplot, formulated as y^ = a + bx to minimize the sum of squared vertical residuals,
Lurking Variable
an unmeasured, hidden variable not included as an explanatory or response variable in a study, yet it influences both, creating a false impression of causation or masking the true relationship
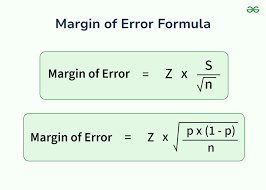
Margin of Error
maximum likely distance between a sample statistic and the true population parameter, acting as the "radius" of a confidence interval
Matched Pairs Design
a special type of randomized block design in AP Statistics, used for comparing two treatments. It involves creating pairs of subjects that are as similar as possible (or using the same subject for both treatments) to reduce variability, then randomly assigning the treatments within each pair
Mean of a Binomial Random Variable
s calculated by multiplying the number of trials (n) by the probability of success (p) in each trial
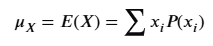
Mean of a Discrete Random Variable
the long-run average outcome over many repetitions, calculated as the weighted average of all possible values
Mean of a Geometric Random Variable
the expected number of trials needed to achieve the first success
Multiplication Rule for Independent Events
If two events, A and B, are independent, the probability of both occurring is (P(A and B) = P(A) x P(B)
Multiplication Rule for Dependent Events
calculates the probability that both events occur when the outcome of the first event affects the second
Nonresistant Measure
summary statistics—specifically the mean, standard deviation, and range—that are highly sensitive to outliers and skewness.
Nonresponse
occurs when individuals selected for a sample fail to respond or cannot be reached, and these individuals differ systematically from those who do respond
Normal Distribution
symmetric, bell-shaped density curves defined by a mean and standard deviation. They are used to model continuous data, with total area under the curve equaling 1
Observational Study
collecting data by observing subjects or measuring variables without manipulating the environment or imposing treatments
Outlier
a data point that differs significantly from the overall pattern of a dataset
Percentile
represents the percentage of data values that are less than or equal to a specific value
Placebo Effect
occurs when experimental units show a real response to an inactive treatment (placebo) simply because they believe they are receiving active treatment
Power
It is the probability of a Type II error). It represents the ability of a test to detect an effect or difference when one actually exists, typically aiming for 0.80 or higher
Principles of Experimental Design
Control, Randomization, Replication, and Comparison
Probability Distribution
describes all possible values a random variable can take and their associated probabilities. It defines the likelihood of outcomes in a sample space, covering discrete (countable) and continuous (interval) variables.
P-Value
measures the probability, assuming the null hypothesis (Ho) is true, of obtaining a test statistic as extreme or more extreme than the observed result
Random Variable
is a numerical variable whose value is determined by the outcome of a chance process. It assigns a numerical value to each outcome in a sample space, falling into two main types: discrete or continuous
Randomized Block Design
An experimental design used to reduce variability by grouping similar experimental units (blocks) based on a variable suspected to influence the response, then randomly assigning treatments within each block
Replication
a foundational principle of experimental design, requiring the application of treatments to multiple experimental units (subjects) to reduce chance variation and identify true patterns
Residual
The vertical distance between an observed data point and the least-squares regression line
Residual Plot
a scatterplot of the residuals (actual y - predicted y) on the vertical axis and the explanatory variable (x) on the horizontal axis
Response Bias
occurs when survey design, question wording, or interviewer behavior causes respondents to give inaccurate, untruthful, or misleading answers, leading to systematic errors
Response Variable
the outcome, dependent, or "Y" variable (y) that is measured or predicted in a study or experiment
Significance Level
The threshold set before a study to determine if a result is statistically significant
Simple Random Sample (SRS)
a sampling method where every possible group of n individuals in a population has an equal chance of being selected.
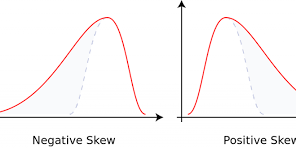
Skewed Distribution
an asymmetrical data distribution where one tail is longer or fatter than the other, indicating data points are not evenly spread around the mean
standard deviation
measures the average distance of data points from the mean, quantifying spread in a dataset
Stratified Random Sampling
a sampling method where the population is divided into distinct, non-overlapping subgroups called strata (based on similar characteristics), and then a separate simple random sample (SRS) is taken from each stratum
Type I Error
when you reject a true null hypothesis (Ho), often called a "false positive".
Type II Error
hen you fail to reject a null hypothesis (Ho) that is actually false
Undercoverage
occurs when certain segments of a population are systematically left out or underrepresented in the sampling frame
Variability of a Statistic
defined by the spread of its sampling distribution, describes how much a statistic varies from sample to sample
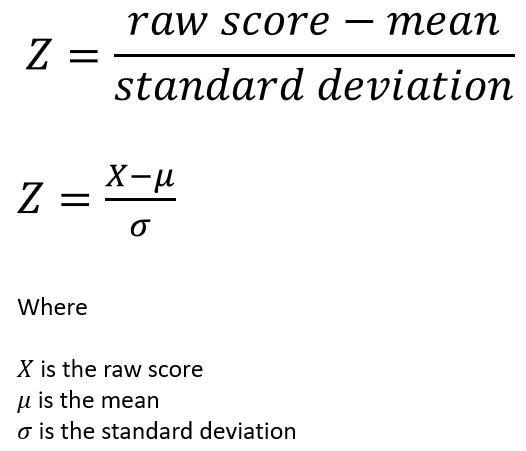
z-score
measures how many standard deviations a data point (\(x\)) is above or below the mean