recruitment chapter 3
1/93
There's no tags or description
Looks like no tags are added yet.
Name | Mastery | Learn | Test | Matching | Spaced |
|---|
No study sessions yet.
94 Terms
Internal Staffing policies Advantages
Positive employee reactions to promotion from within
Quick method to identify job applicants
Internal
Less expensive
Less time required to reach full productivity
Internal staffing disadvantage
No new KSAOs into the organization
May perpetuate current underrepresentation of minorities and women
Small labor market to recruit from
Inexperienced employees may require more training time
External staffing advantages
Brings in employees with new KSAOs
Larger number of minorities and women to draw from
Large labor market to draw from
Experienced employees may require less training time
External staffing disadvantage
Negative reaction by internal applicants
Time-consuming to identify applicants
Expensive to search external labor market
More time required to reach full productivity
Labor Demand
National employment statistics provide data about employment patterns and projections for industries, occupations, and organization size.
Most organizations will need to examine not just aggregated statistics, like the overall unemployment rate, but also occupational and regional employment data. As an example, the US Bureau of Labor Statistics (BLS) in 2013 estimated that the unemployment rate for structural iron and steel workers was 21.9%, and the rate for telemarketers was 23.1%. At the other extreme, the unemployment rate for physician assistants was 1.2%, and the rate for petroleum engineers was 0.6%.®
Employment projections through 2024 indicate that demand is expected to be especially strong for health care practitioners and health care support occupations. Computer and mathematical occupations, and business and financial occupations, will see continued growth.
Employment in occupations related to agriculture and production is expected to continue to decline.?
KSAO requirements or preferences of employers are not widely measured, except for education requirements. Data collected by the BLS suggest a continued increase in demand for individuals with college degrees or higher. The number of jobs requiring a bachelor's, master's, and doctoral degree are all expected to rise twice as fast as the number of jobs requiring only short-term on-the-job training. The increasing demand for education most likely reflects advances in technology that have made many jobs more complex and technically demanding.®
Employers are also interested in a broader set of skills that are not provided through specific educational degree programs. Surveys of HR professionals and employers consistently reveal that communication skills, critical thinking skills, creativity, diversity management, ethics, and a lifelong learning orientation are especially relevant for today's employees.'
Labor Supply
Several labor force trends have particular relevance for staffing organizations. Labor force growth is slowing. The annual growth rate in the early 1990s was around 2%, but had decreased 1% by the year 2018. There are fewer new entrants to the labor force. This trend, coupled with the severe mismatch between organizational demand for KSAOs and workforce qualifications, creates major adaptation problems for organizations.
Demographically, the labor force has become more diverse, and this trend will continue. A trend toward nearly equal labor force participation for men and women and large proportional growth in the representation of Hispanics and Asians has been found beginning in the 1990s and continuing through the present day, and is projected to continue. There will also be a dramatic shift toward fewer younger workers and more workers over the age of 55. These age-related changes are partially a reflection of labor force participation. Today, individuals in their late teens are much less likely to be working, whereas workers over 55 are much more likely to be working.
Surveys conducted by the Society for Human Resource Management consistently find that employers see key shortages in technical skills, written communication, and basic computer skills. The job categories that have been the hardest to fill include engineers, highly skilled medical jobs, computer specialists, scientists, managers, and technicians. Applied skills in problem solving, critical thinking, creativity, and communication are all in high demand not just in the United States but also around the world. Iº There are also shortages of employees with the high skill levels required in contemporary manufacturing environments. "
Analysis of labor market data suggests that the problem of skill mismatch is partially the result of poor communication and
Page 104
coordination between employers and workers, and partially a reflection of the failure of specific educational programs to meet the needs of specific occupations. 2 In sum, it appears the problem is that demand for advanced skills is increasing and employer-employee matches are challenging, not that the supply of skilled workers is decreasing. These results also suggest that organizations can address the skills gap through active strategies to advertise their needs and embed themselves more in high schools, technical colleges, and universities.
Shortages and Surpluses
When demand exceeds supply, organizations experience employment shortages. Shortages tend to be job or occupation specific. Low unemployment rates, surges in labor demand in certain occupations, and skill deficiencies fuel labor quantity and labor quality shortages for many organizations. The shortages cause numerous responses:
Increased pay and benefit packages
Hiring bonuses and stock options
Alternative work arrangements to attract and retain older workers
Use of temporary employees
Recruitment of immigrants
Lower hiring standards
Partnerships with high schools, technical schools, and colleges
Increased mandatory overtime work
Increased hours of operation
These responses are lessened or reversed when there are labor surpluses relative to labor demand.
Technology
Changes in technology can influence the staffing planning process significantly. In some cases, technology can serve as a substitute for labor by either eliminating or dramatically reducing the need for certain types of workers. The economy as a whole has shown decreased demand for positions like clerical workers and manufacturing operators as technology has replaced labor as an input to production.
Ironically, changes in software that have made computers easier for non-specialists to use have eliminated many jobs in computer programming.
At the same time, technology can create new jobs as new business opportunities emerge. In place of the jobs that are eliminated, demand for technical occupations like robotics engineers, systems and database analysts, and software engineers has increased. The expansion of e-commerce and other Internet-based services has increased demand for those who design and manage websites. Increasing productivity as a result of technological change can also spur increased firm performance, which in turn will create more jobs. Often these new jobs will require a completely different set of KSAOs than previous jobs, meaning that increased staffing resources will have to be devoted to either retraining or replacing the current workforce. Research conducted in the United States, Britain, and Germany shows that computerization has led to an increase in the demand for highly educated specialists, leading to an overall increased market demand for skills in science and mathematics, which has led to dramatic increases in wages for individuals with these skills.l Employers that adopt new technology for any aspect of their operations will also have to consider how to tap into labor markets that have these skills.
HUMAN RESOURCE PLANNING
After acquiring a solid understanding of the internal and external environments, a more detailed set of plans to strategically address organizational needs can be considered. Human resource planning (HRP) is an ongoing process and set of activities undertaken to forecast an organization's labor demand (requirements) and labor supply availabilities), to compare these projections to determine employment gaps, and to develop action plans for addressing these gaps. Action plans include planning to arrive at desired staffing levels and staffing quality.
A general model depicting the process of HRP is presented first, followed by an operational example of HRP. The major
Page 107
components of HRP are then discussed in detail. Best practices in contemporary organizations suggest that to be effective, HRP must be an ongoing activity, supplemented with data from human resources information systems. This presentation reviews only a single cycle of HRP, but it is better to think of HRP as a continuous process that is updated and reviewed at least once a quarter, if not more frequently.
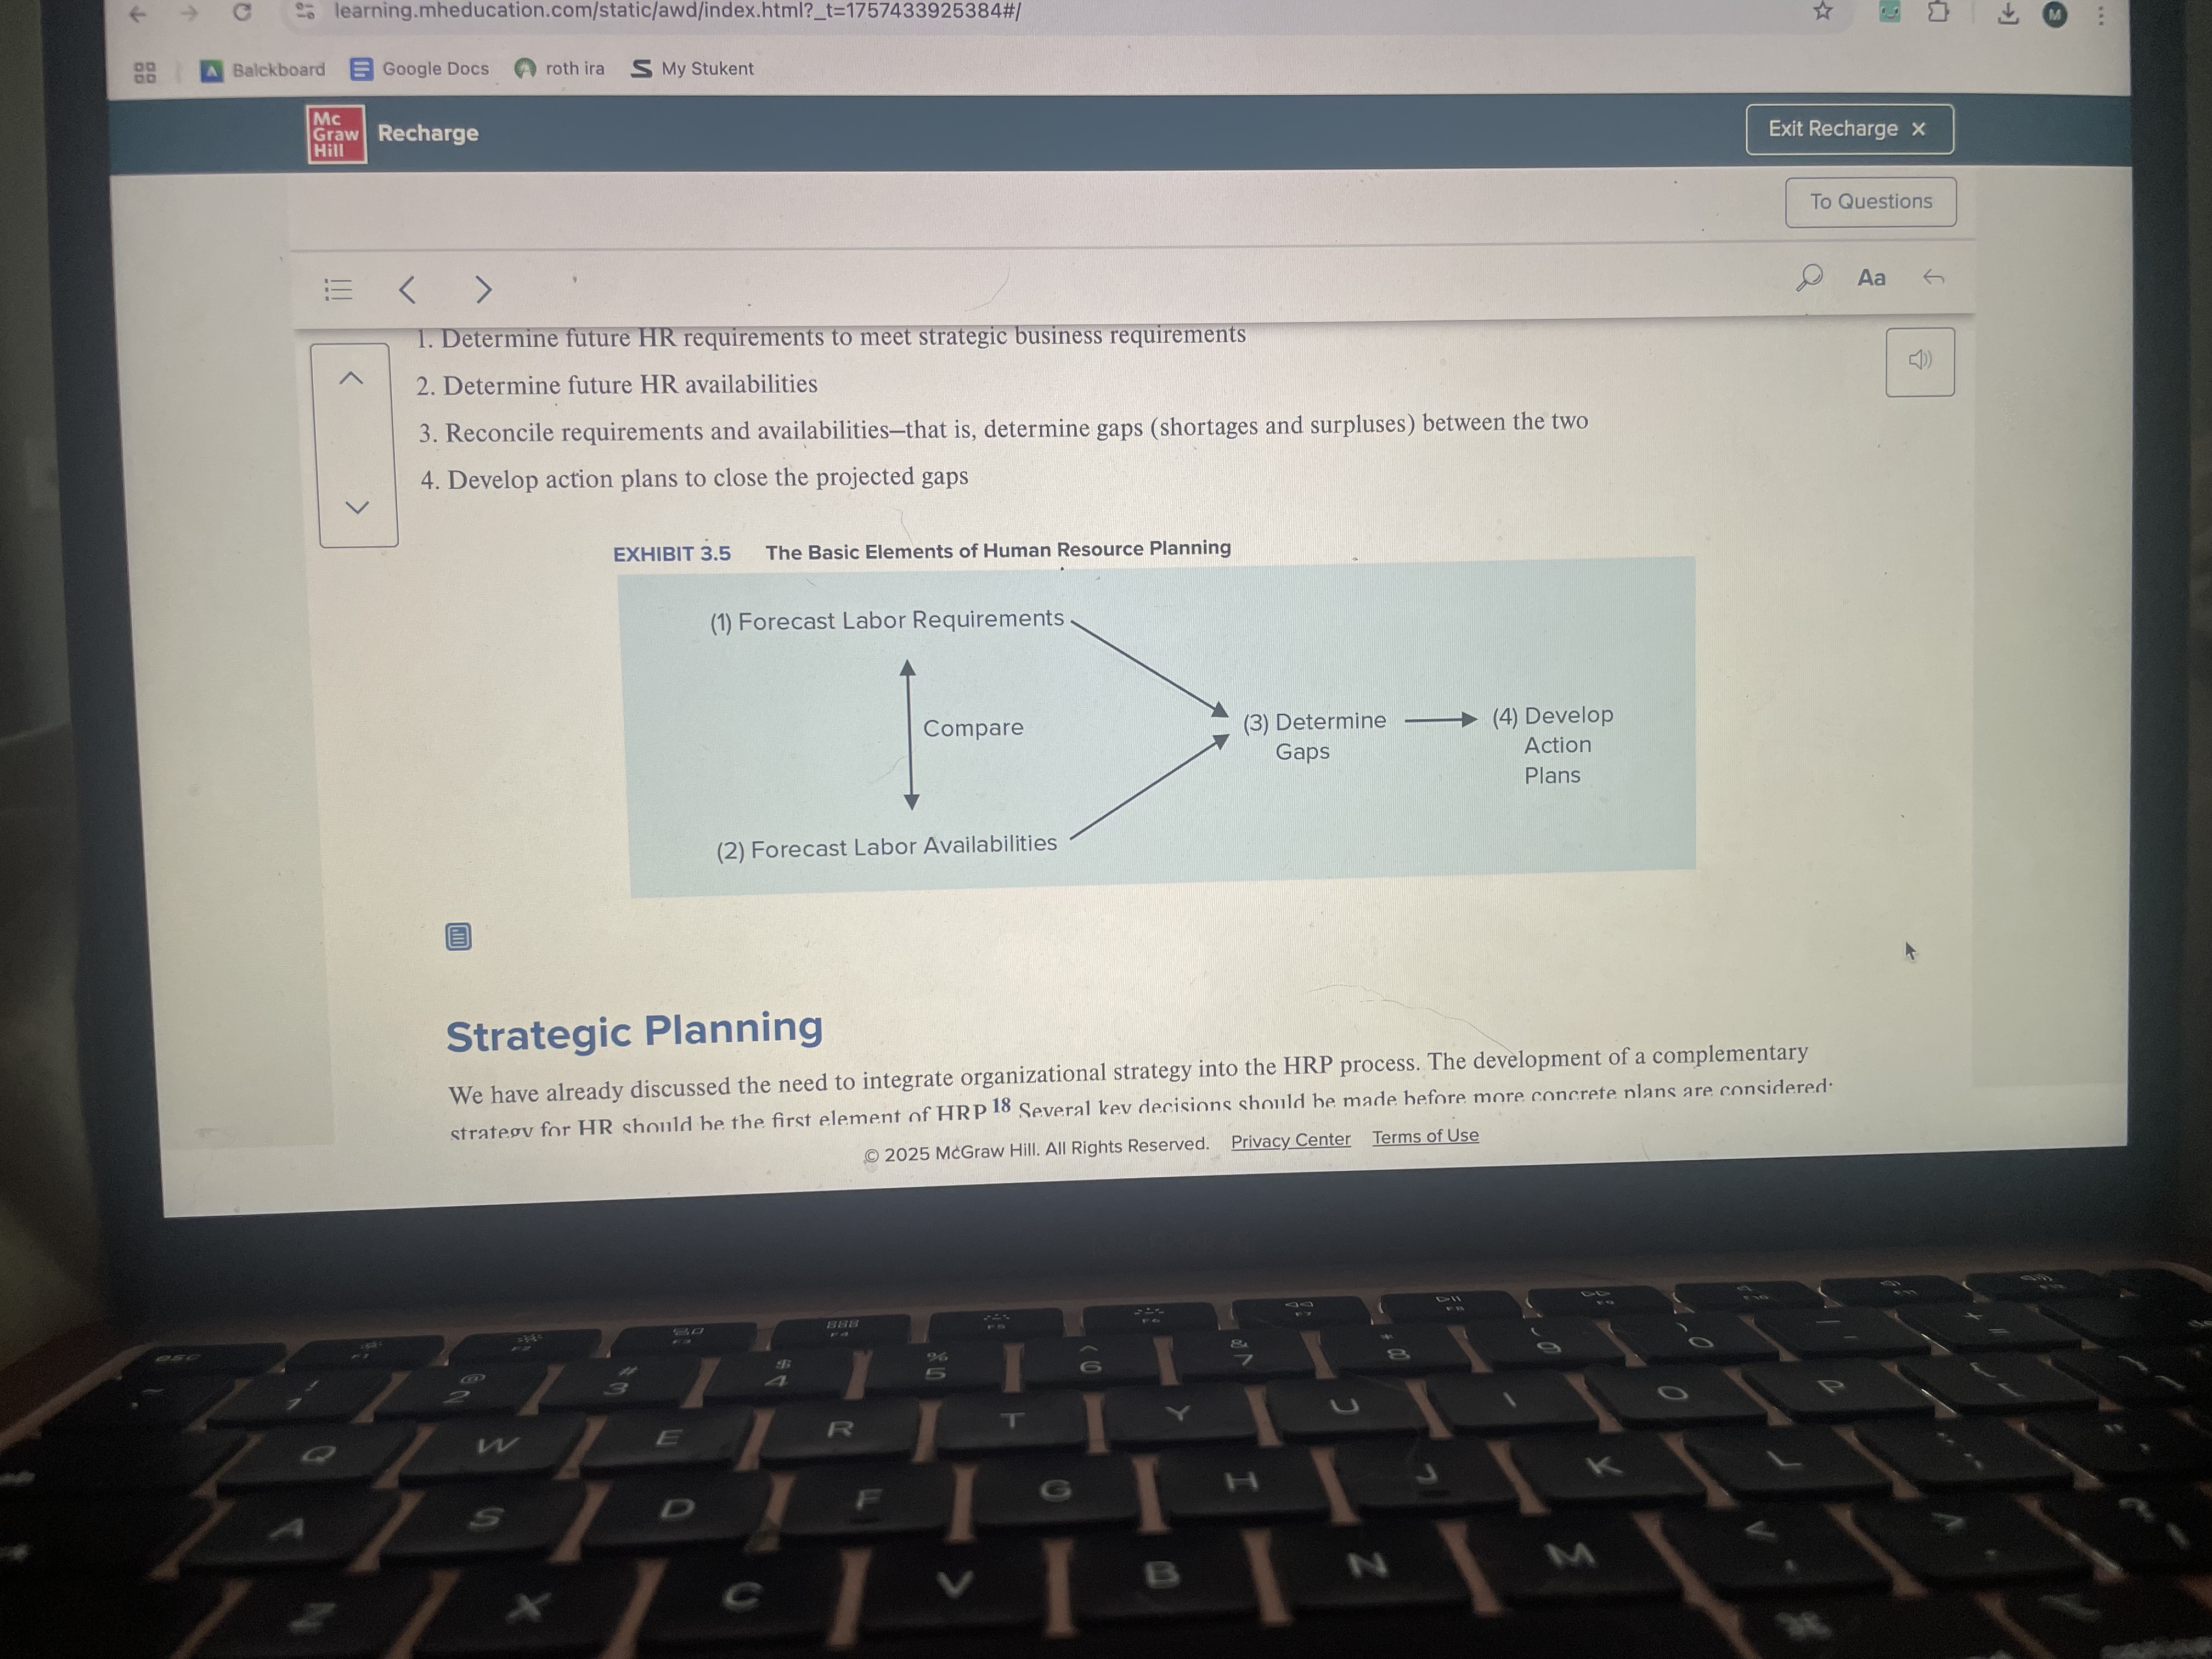
The basic elements of virtually any organization's HRP are shown in L Exhibit 3.5. As can be seen, the HRP process involves four sequential steps:
Determine future HR requirements to meet strategic business requirements
Determine future HR availabilities
Reconcile requirements and availabilities-that is, determine gaps (shortages and surpluses) between the two
Develop action plans to close the projected gaps
Strategic Planning
We have already discussed the need to integrate organizational strategy into the HRP process. The development of a complementary strategy for HR should be the first element of HRP.18 Several key decisions should be made before more concrete plans are considered:
• A vision based on the overall organizational strategy should be developed. This often means deciding what values and core competencies all members of the organization should possess, and considering principles that will support these values and competencies.
Potential strategies for achieving planning process goals should be discussed. It is best at this point to think of whole systems of goals (e.g., integrate all KSAO information for the workforce and future planning needs) rather than specific concrete goals (e.g., conduct recruiting at a local college campus). Too much focus on implementation details early in the strategic planning process can lead to a patchwork of practices that do not fit together well.
Contingency plans should be developed and considered. For example, what happens if certain key employees leave the organization?
What happens if there is a change in the economy that reduces the supply of needed KSAOs in the labor market? Use of simulation software that shows potential future outcomes for a variety of actions and responses is one way to evaluate the likelihood of potential worst-case scenarios and plan for how to respond should they arise.
Page 108
• Methods for obtaining feedback relative to goals and objectives should be in place. This involves specifying the data that will be used to determine how well the planning process is working and how it can be improved.
HIRP can be performed
on a plan basis, project basis, or population basis. When HRP takes place as an integral part of an organization's strategic planning process, it is referred to as plan-based HRP. This helps integrate the entire organization's strategic planning process with HR implications. Organizational responses to changes to specific projects or activities are referred to as project-based HRP. In addition, many organizations do HRP for critical groups of employees on a regular basis. This often occurs for jobs in which there are perennial shortages of employees. Planning focused on a specific employee group is referred to as population-based HRP. As we noted earlier, best practices suggest that these activities must be done on an ongoing basis.
Examples of Statistical Techniques to Forecast HR Requirements
(A) Trend Analysis
Gather data on staffing levels over time and arrange in a spreadsheet with one column for employment levels and another column for time.
Predict trend in employee demand by fitting a line to trends in historical staffing levels over time (this can be done by using regression or graphical methods in most spreadsheet programs).
Calculate period demand index by dividing each period's demand by the average annual demand.
Example: January demand index = Avg. January FTE/Avg. annual FTEMultiply the previous year's FTEs by the trend figure, then multiply this figure by the period's demand index.
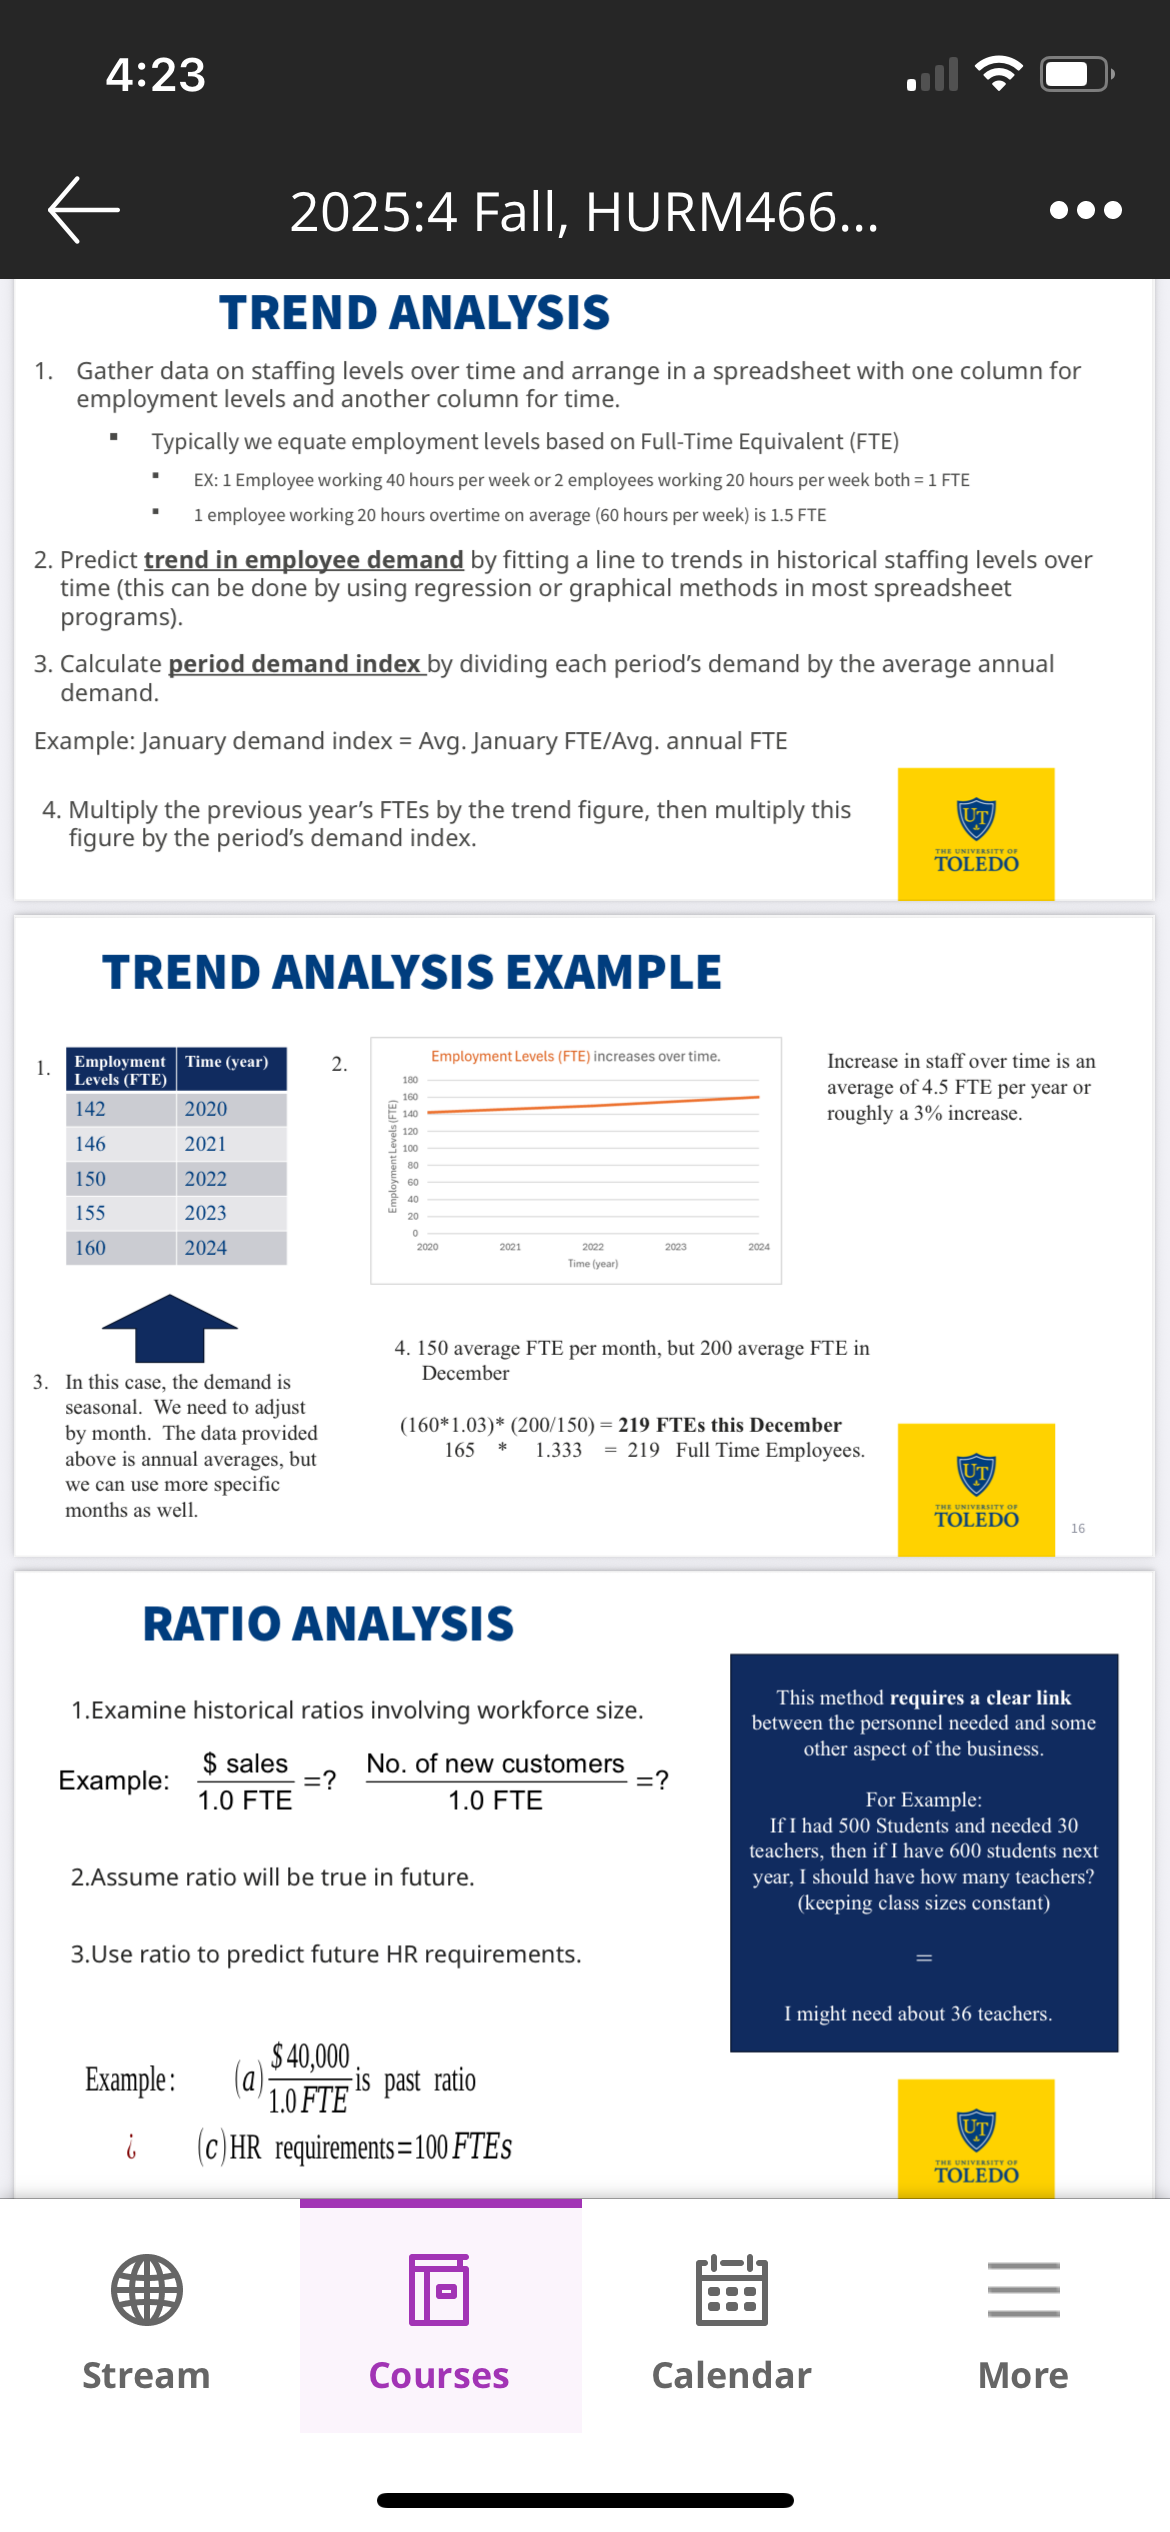
Example: A retail store finds that the average number of employees over the past five years has been 142, 146, 150, 155, and
160. This represents a consistent 3% increase per year; to predict the next year's average demand, multiply 160 by 1.03 to show a 3% expected increase. Over this same time period, the store averaged 150 FTEs per month, with an average of 200
FTEs in December. This means the December demand index is 200/150 = 1.33, so its estimate for next year's December FTE
demand will be (160 × 1.03) × 1.3 = 219 FTEs.
(B) Ratio Analysis
1. Examine historical ratios involving workforce size.
$ sales/1.0 FTE =
No. of new customers/1.0 FTE
- = ?
Assume ratio will be true in future.
Use ratio to predict future HR requirements.
$40,000 sales/ 1.0 FTE
Example: (a)
is past ratio
(b)
(c)
1.0 FTE
Sales forecast is $4,000,000
HR requirements = 100 FTEs
Regression analysis
Statistically identify historical predictors of workforce size.
Example: FTEs = a + b1 sales + b2 new customersOnly use equations with predictors found to be statistically significant.
Predict future HR requirements, using equation.
Example: (a) FTEs = 7 + .0004 sales + .02 new customers
(b) Projected sales = $1,000,000
The use of integrated workforce planning software, which can
be combined with data from other organizational databases, has
made it easier to use these statistical techniques. As we noted earlier, AR practitioners are increasingly expected to support their proposals and plans with hard data. The three techniques shown in L Exhibit 3.6 have different strengths and weaknesses, as we will see.
We present these approaches in order from those requiring the least amount of data collection to those requiring the most.
Trend analysis
is the simplest approach, because it uses data only on previous staffing levels over time to predict future needs. Trend analysis is useful when organizations have data mostly on historical staffing levels with less detailed information on specific predictors. The decomposition of data into specific time periods of demand is often used in health care and retail settings, where staffing levels vary greatly over the course of a year and even at different times of the day.
The trend analysis approach implicitly assumes that the pattern of staffing needs in the past will be predictive of the future but does not take any external factors, like the overall state of the economy or product market demand, into account.
Ratio analysis
is a more sophisticated approach that uses data from prior sales figures or other operational data to predict expected head count. In the example in L Exhibit 3.6, estimates of sales growth are used to predict how many employees will be needed. This technique is useful for incorporating data from other functional areas to predict the future. However, this model cannot directly account for any changes in technology or skill sets that might change these ratios.
The regression analysis technique
can be used with historical predictors and can make more statistically precise estimates of
Page 112
future expectations by taking several factors into account simultaneously. In the example, sales data and new customer data from organizational records are used to predict staffing needs in the past. Then the estimates from these predictions are combined with projections for the future to generate future FTE requirements. This procedure is more thorough than the ratio analysis approach, which incorporates only a single.predictor of workforce size. However, collecting enough data to make good estimates can be time-consuming and requires judgment calls.
Judgmental Techniques
Judgmental techniques represent human decision-making models that are used for forecasting HR requirements. Unlike statistical techniques, judgmental techniques use a decision maker who collects and weighs the information subjectively and then turns it into forecasts of HR requirements. The decision maker's forecasts may or may not agree very closely with those derived from statistical techniques. This is not necessarily a weakness of either approach. Ideally, the precision of statistical techniques should be coupled with on-the-ground knowledge represented by judgmental techniques to provide estimates that have both rigor and relevance.
Implementation of judgmental forecasting can proceed from either a top-down or bottom-up approach. In the former, top managers of the organization, organizational units, or functions rely on their knowledge of business and organizational plans to predict what future head counts should be. At times, these projections may, in fact, be dictates rather than estimates, necessitated by strict adherence to the business plan. Such dictates are common in organizations undergoing significant change, such as restructuring, mergers, and cost-cutting actions.
Markov Analysis
Markov Analysis is a quantitative technique that is uniquely related to the forecasting process for internal availabilities and the movement among jobs. This approach models historical patterns of job stability and movement among employees. Consider Figure 3.7. Note that between any two time periods, the following possibilities exist for each employee in the internal labor market:
Job stability (remain in A1, A2, B1, or B2)
Promotion (move to a higher level: Al to A2, Al to B2, B1 to B2, or B1 to A2)
Transfer (move at the same level: A1 to B1, B1 to Al, A2 to B2, or B2 to A2)
Demotion (move to a lower level: A2 to Al, A2 to B1, B2 to B1, or B2 to Al)
Exit (move to another organizational unit or leave the organization)
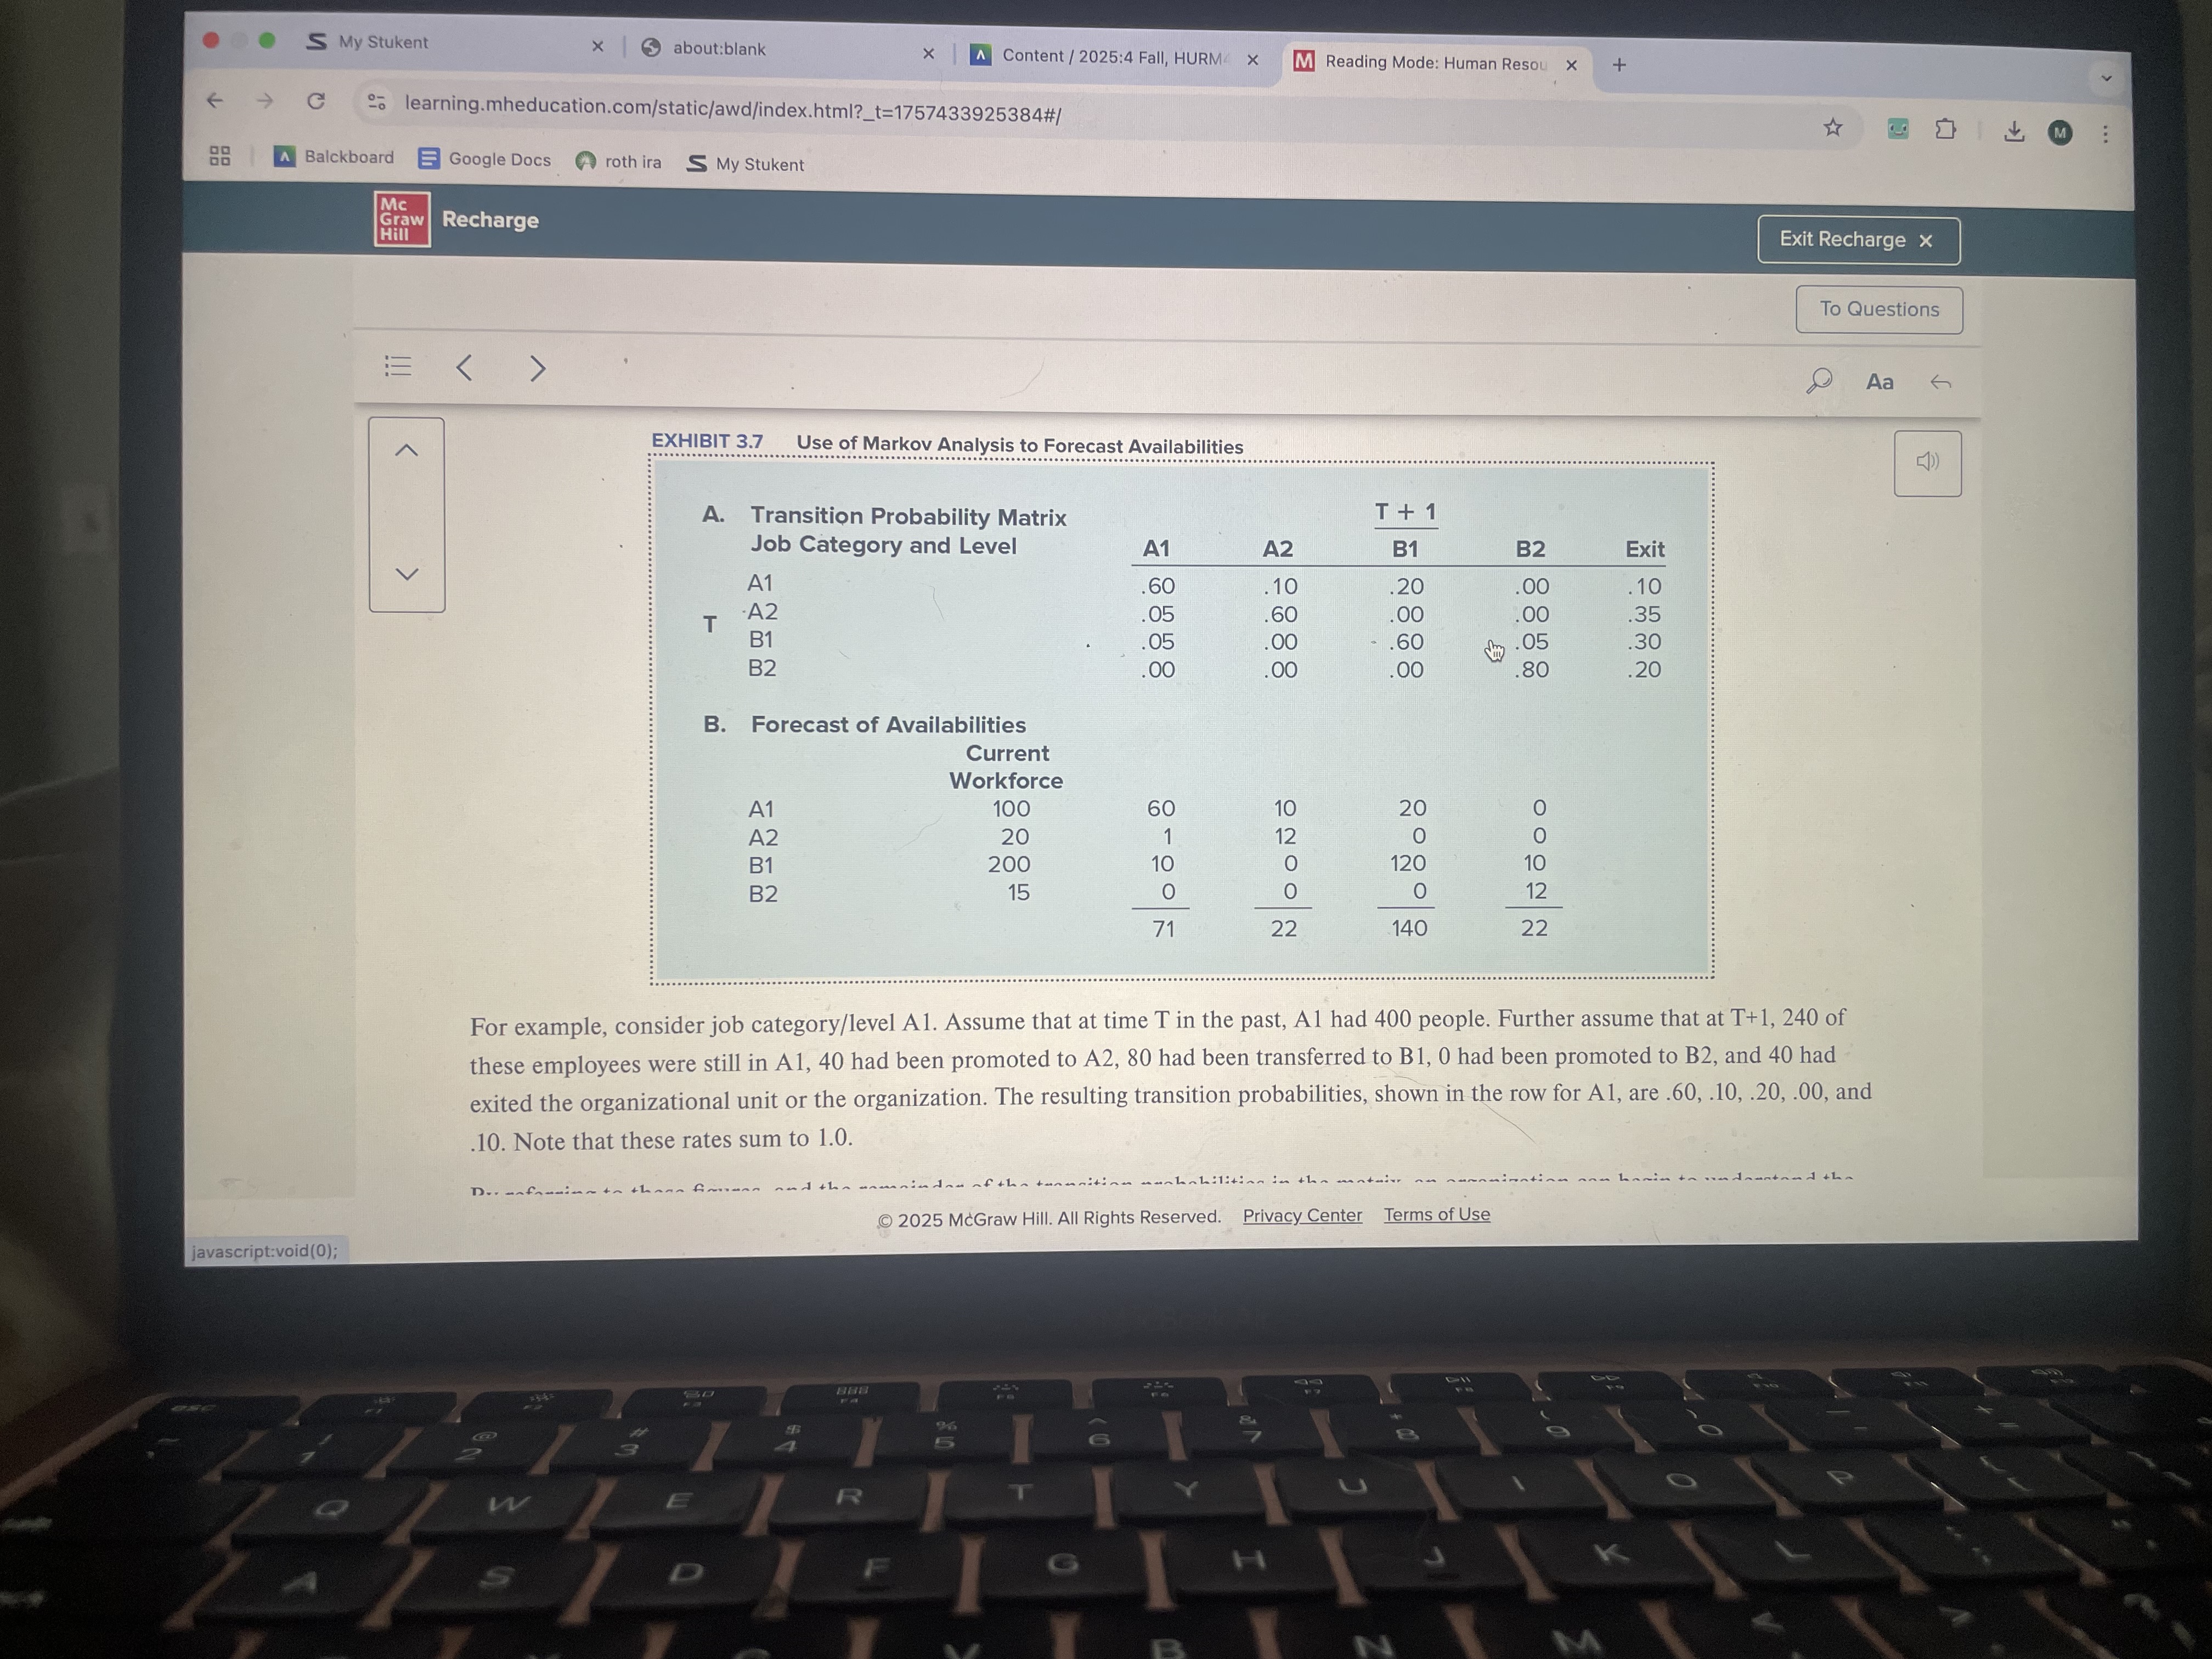
These possibilities may be thought of in terms of flows and rates of flow or movement rates. Past flows and rates may be measured and then used to forecast the future availability of current employees. For example, if it is known that the historical promotion rate from Al to A2 is .10 (10% of Al employees are promoted to A2), we might predict that Al will experience a 10% loss of employees due to promotion to A2 over the relevant time period.
An example of the elements of Markov Analysis is shown in
Exhibit 3.7. Refer first to part A of L
Exhibit 3.7, where movement rates
between two time periods (T and T+1) are calculated for four job category level combinations. For each job category/level, take the number of employees at time period T and use this number as the denominator for calculating job stability and movement rates. Next, for each of these employees, determine which job category/level they were employed in at T+1. Then, sum up the number of employees in each job category/level at T+1 and use these as the numerators for calculating stability and movement rates. Finally, divide each numerator separately by the denominator. The result is the stability and movement rates expressed as proportions, also known as transition probabilities. The rates for any row (job category/level) must add up to 1.0.
STAFFING PLANNING
After the HRP process is complete, it is time to move toward the development of specific plans for staffing. This is a vital phase of the planning process, in which staffing objectives are developed and alternative staffing activities are generated. The objectives are the targets the organization establishes to determine how many employees will be needed and in which job categories. The activities are the specific methods, including recruiting and selection strategies, that will be used to meet these objectives. We devote special attention in this section to one of the most critical decisions made during staffing planning: Should the organization use a core workforce or a flexible workforce, or should parts of the workforce be outsourced?
Identifying Staffing Objectives
Staffing objectives are derived from identified gaps between requirements and availabilities. Thus, these objectives respond to both shortages and surpluses. They may require the establishment of quantitative and qualitative targets.
Quantitative targets should be expressed in head count or FTE form for each job category/level and will be very close in magnitude to the identified gaps. Indeed, to the extent that the organization believes in the gaps as forecast, the objectives will be identical to the gap figures.
A forecast shortage of 39 employees in Al, for example, should be transformed into a staffing objective of 39 accessions (or something close to it) to be achieved by the end of the forecasting time interval. L Exhibit 3.9 illustrates these points. For each cell, enter a positive number for head-count additions and a negative number for head-count subtractions.
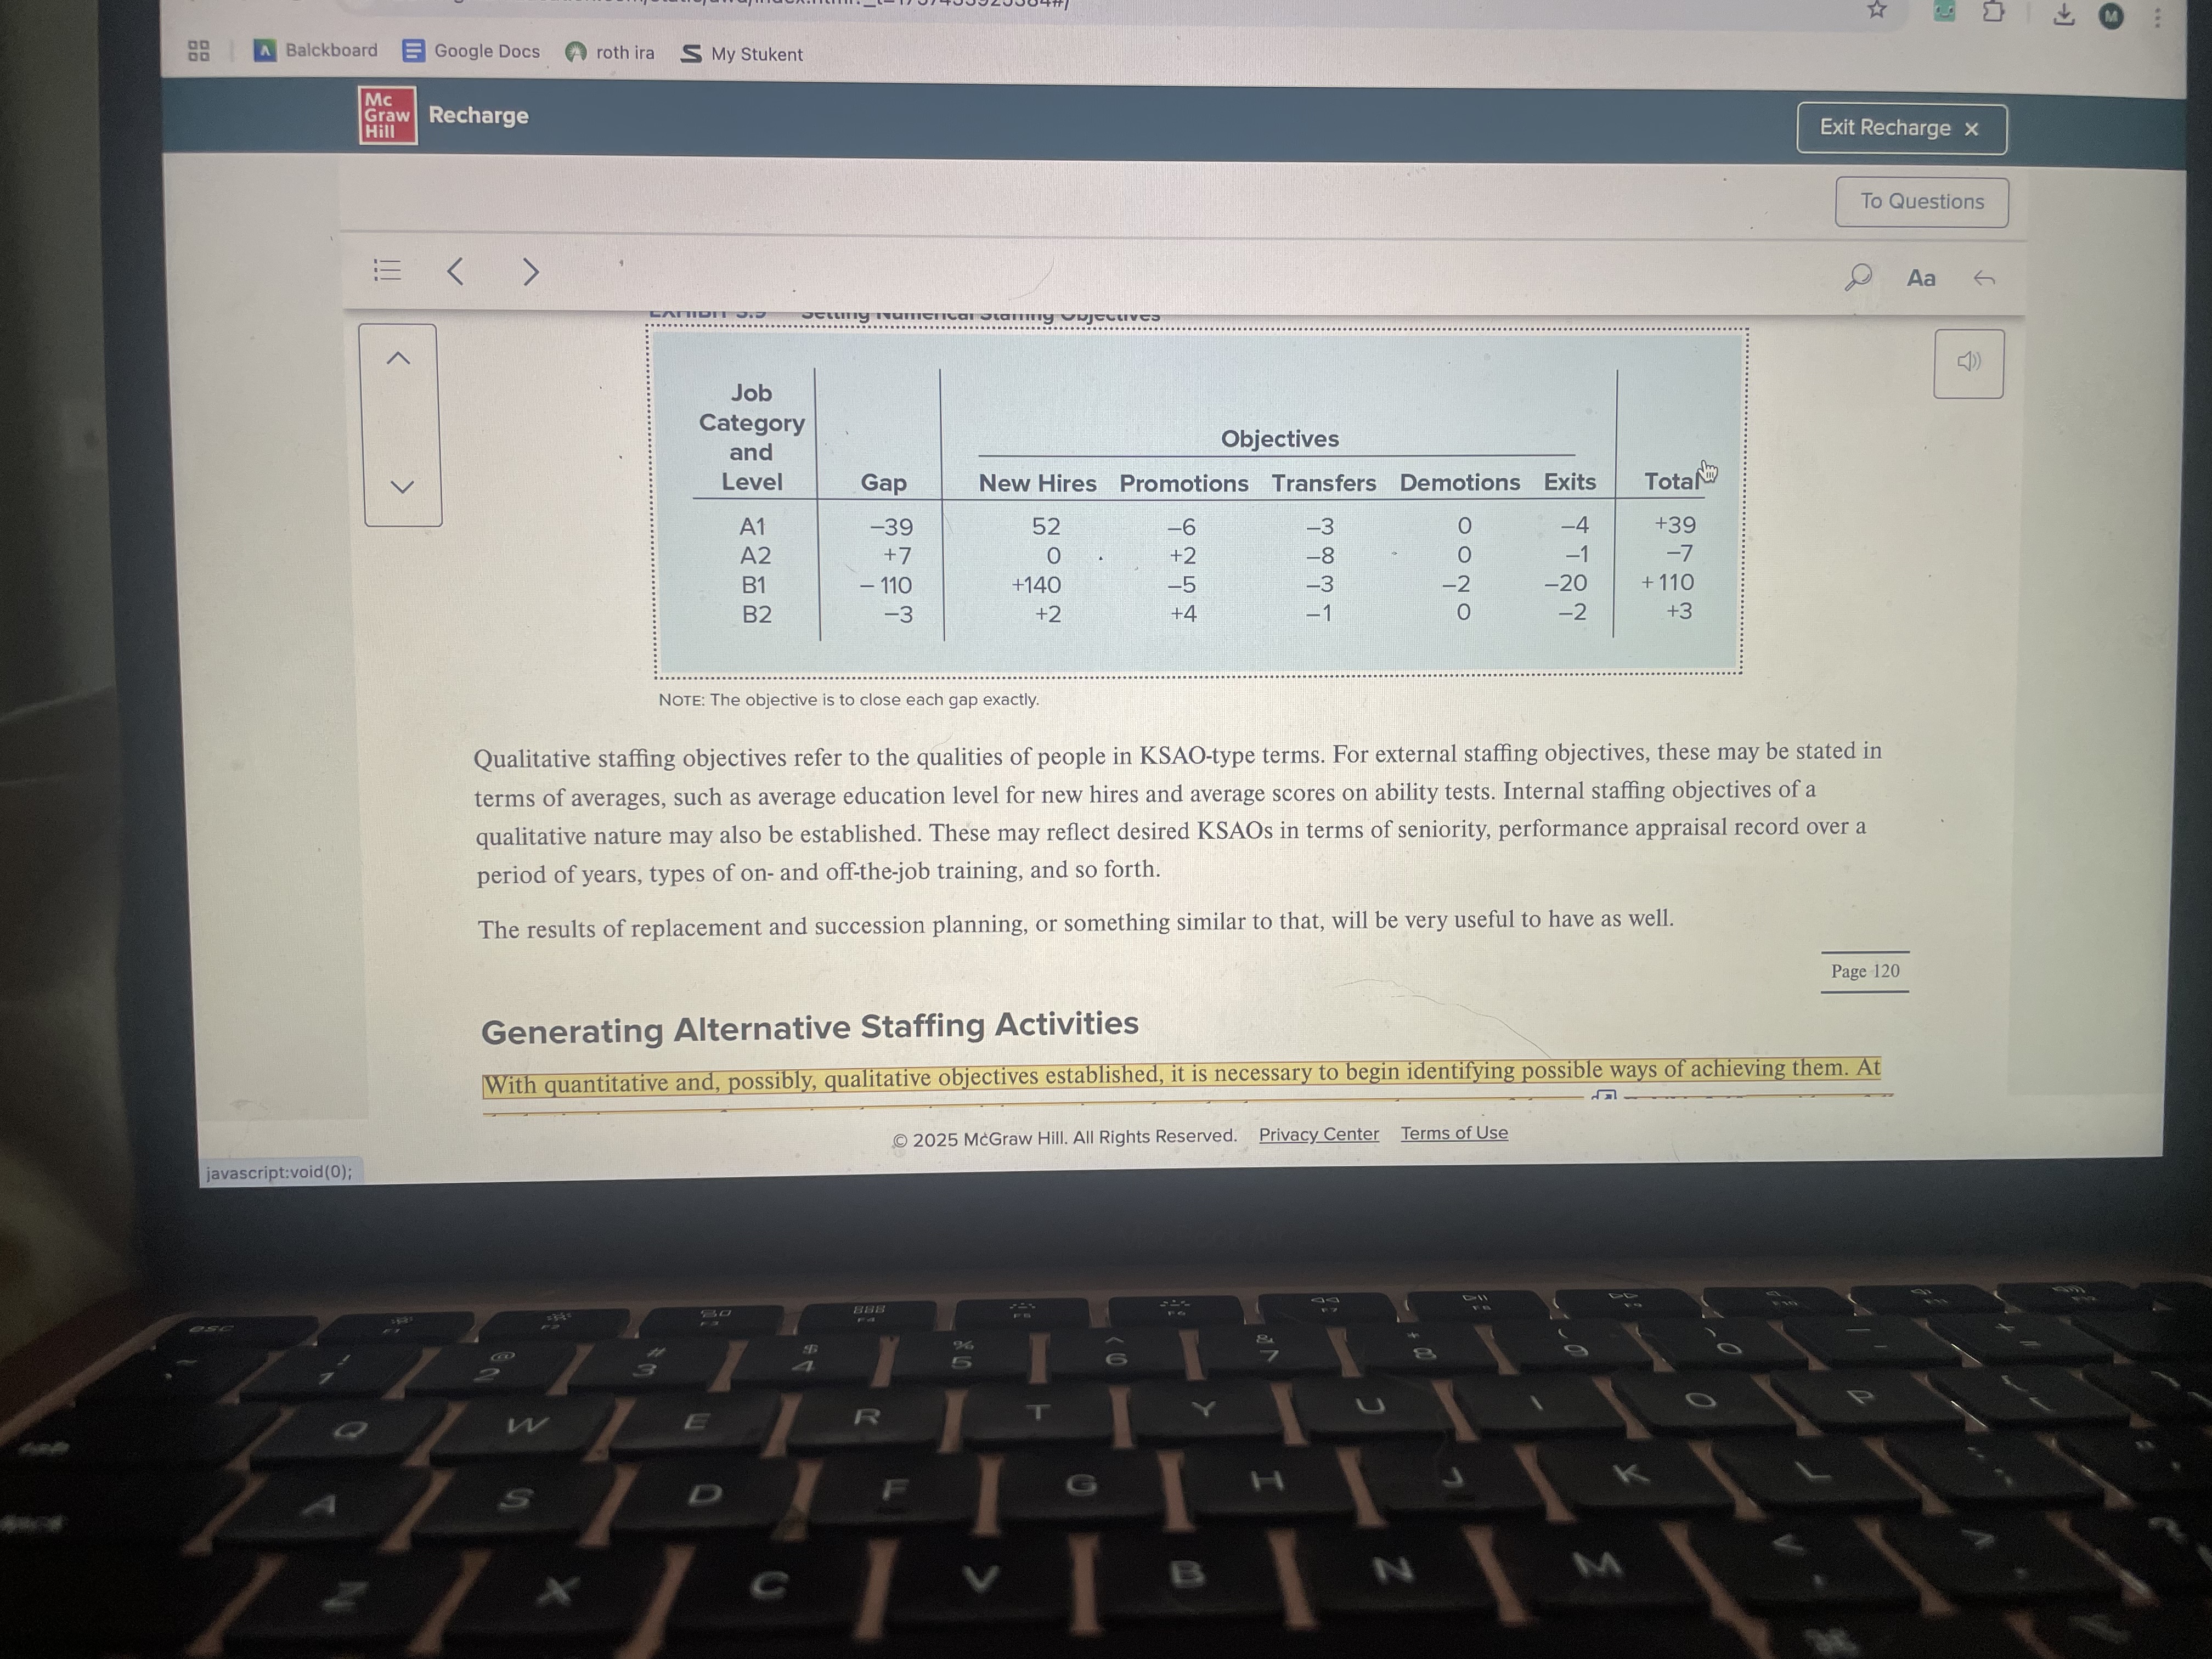
Qualitative staffing objectives refer to
to the qualities of people in KSAO-type terms. For external staffing objectives, these may be stated in terms of averages, such as average education level for new hires and average scores on ability tests. Internal staffing objectives of a qualitative nature may also be established. These may reflect desired KSAOs in terms of seniority, performance appraisal record over a period of years, types of on- and off-the-job training, and so forth.
Generating Alternative Staffing Activities
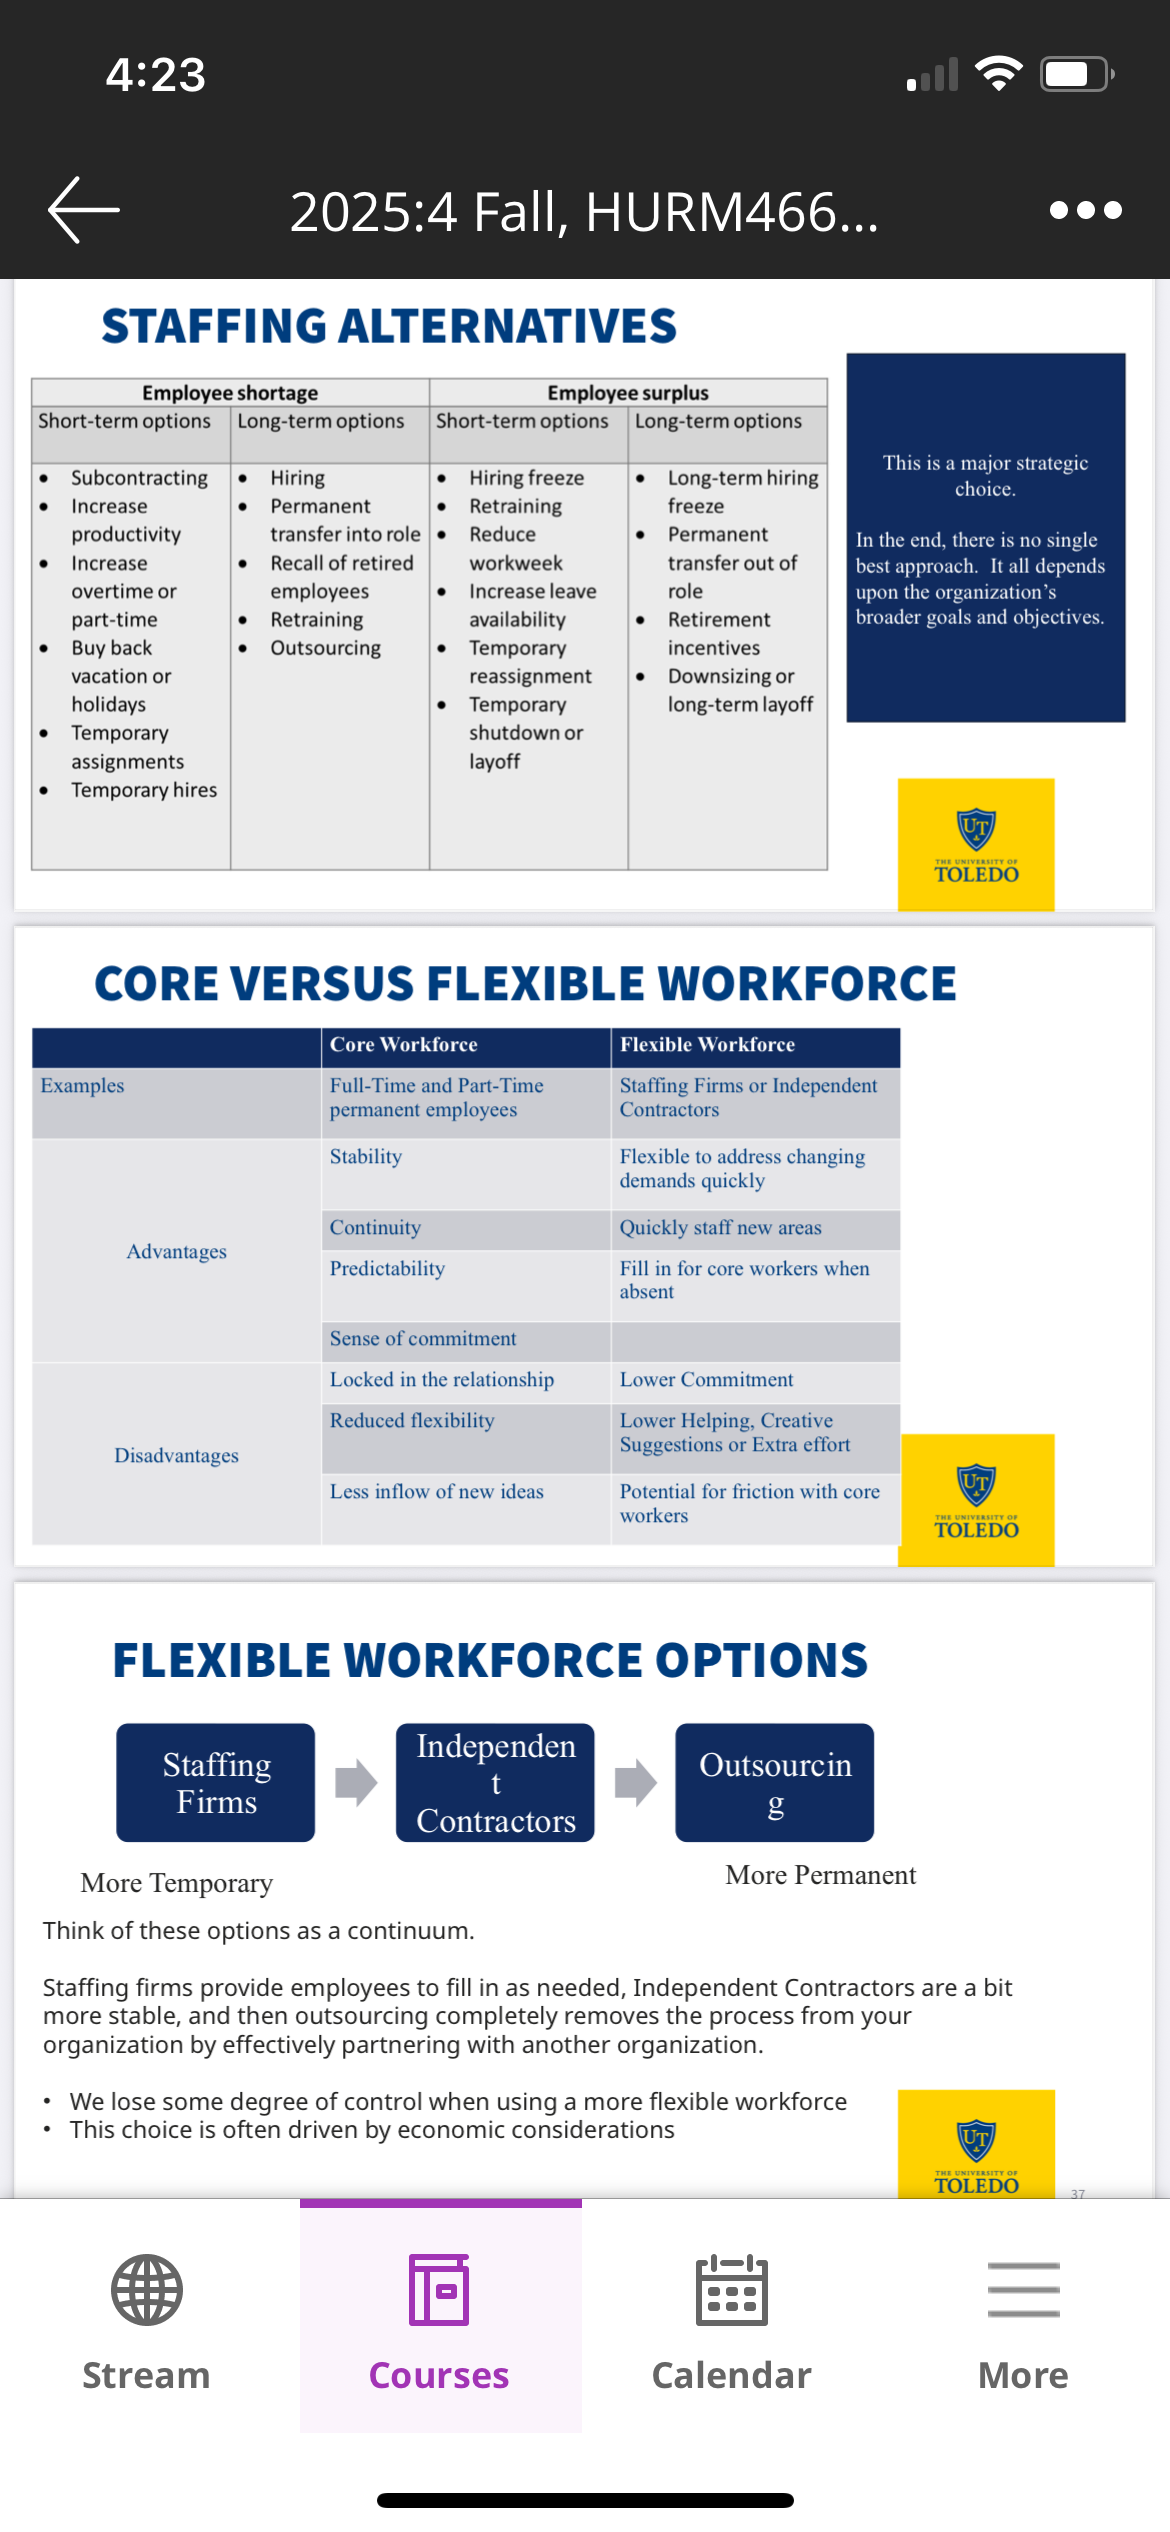
With quantitative and, possibly, qualitative objectives established, it is necessary to begin identifying possible ways of achieving them. At the beginning stages of generating alternatives, it is not wise to close the door prematurely on any of them. L Exhibit 3.10 provides a full range of options for dealing with employee shortages and surpluses. As with previous planning processes, the focus is not on specific programs at this stage but rather on broad classes of potential activities.
Employee Shortage Short term options
Subcontracting
Increase productivity
Increase overtime or part time
Buy back vacation or holidays
Temporary assignments
Temporary hires
Employees shortage long term options
Hiring
Permanent transfer into role
• Recall of retired employeeS • Retraining
• Outsourcing
Employee surplus long term option
Long-term hiring freeze
Permanent transfer out of role
ave
Retirement incentives
Downsizing or
ent
long-term layoff
Employee surplus short term options
Hiring freeze
Retraining
Reduce workweek
Increase leave availability
Temporary reassignment
Temporary shutdown or layoff
shown in the exhibit, both short- and long-term options for shortages,
involving a combination of staffing and workload management, are possible. Short-term options include utilizing current employees better (through more overtime, productivity increases, and buybacks of vacation and holidays), outsourcing work to other organizations (subcontracts, transferring work out), and acquiring additional employees on a short-term basis (temporary hires and assignments). Long-term options include staffing additional employees (recalling former employees, transferring in employees from other work units, adding new permanent hires), enhancing skills (retraining), and pushing work to other organizations (transferring work out). There are also short- and long-term options for surpluses. Short-term options include hiring freezes, retraining current workers for new roles, cutting back the number of days worked per week, providing more voluntary leave, temporarily reassigning surplus employees to do work in areas with shortages, or temporarily suspending operations and laying off employees until need for their work increases. Long-term options are generally permanent versions of the short-term responses.
Core Workforce
core workforce is defined as regular full-time and part-time employees of the organization. The key advantages of a core workforce are stability, continuity, and predictability. The organization can depend on its core workforce and build strategic plans based on it. Several other advantages accrue to the organization from using a core workforce. The regularity of the employment relationship fosters a sense of commitment and shared purpose toward the organization's mission. In addition, the organization maintains the legal right to control employees working on its behalf, in terms of both work process and expected results, rather than having to divide or share that right with organizations providing a flexible workforce, such as temporary employment agencies. Finally, the organization can directly control how it acquires its workforce and the qualifications of those it employs through the management of its own staffing systems. By doing so, the organization may build not only a highly qualified workforce but also one more likely to be retained, thus lessening pressure to continually restaff.
A core workforce also has several disadvantages. The implied permanence of the employment relationship "locks in" the organization's workforce, with a potential loss of staffing flexibility to rapidly increase, reduce, or redeploy its workforce in response to changing market conditions and project life cycles. Reducing the core workforce can be very costly in terms of severance pay packages, low morale, and damage to the organization's reputation as a good employer. Additionally, the labor costs of the core workforce may be greater than those of the flexible workforce due to (1) higher wages, salaries, and benefits for the core workforce, and (2) the fixed nature of these labor costs, relative to the more variable costs associated with a flexible workforce.
Flexible Workforce
The two major components of the flexible workforce are temporary employees provided by a staffing firm and independent contractors.
Planning for usage of the flexible workforce must occur in tandem with core workforce planning; hence, it should begin with a review of the advantages and disadvantages of a flexible workforce. 22
The key advantage is staffing flexibility. The flexible workforce may be used for adjusting staffing levels quickly in response to changing technological or consumer demand conditions and to ebbs and flows of orders for products and services. Other flexibility advantages are the ability to quickly staff new areas or projects and the ability to fill in for core workers absent due to illness, vacations, and holidays.
Relative to the core workforce, the flexible workforce may also present labor cost advantages in the form of lower pay and benefits, more variable labor costs, and reduced training costs. Another advantage for the organization is possibly being relieved of many tax and employment law obligations, since flexible workers are often not considered employees of the organization.
The flexible workforce, especially in the professional and technical ranks, may also be an important source of new knowledge about organizational best practices and new skills not present in the core workforce. In a related vein, organizations use temporary or interim top executives to fill in until a permanent hire is found, to spur change, and to launch special projects requiring their expertise.
Independent contractor
provides specific task and project assistance to the organization, such as maintenance, bookkeeping, advertising, programming, and consulting. The IC can be a single individual (self-employed, freelancer) or an employer with its own employees. Neither the IC nor its employees are intended to be employees of the organization utilizing the IC's services, and care should be taken to ensure that the IC is not treated like an employee.24
As with staffing firms, the organization must take the initiative to identify and check out ICs for possible use in advance of when they are actually needed. It is desirable to solicit and examine references from past or current clients of the IC. In addition, as much as possible the organization should seek to determine how the IC staffs, trains, and compensates any employees. This could occur during a preliminary meeting with the IC. If a single individual will be working as an IC, it is advisable to use some of the same tools we describe later in the book for assessing job candidates, including an assessment of KSAOs through a standardized interview process and collection of references related to these characteristics.
Staffing Firms
Recall that staffing firms (also called temporary help agencies) are the legal employers of the workers being supplied, though matters of co-employment may arise. Hence, the staffing firm conducts recruitment, selection, training, compensation, performance appraisal, and retention activities for the flexible workers. The firm is also responsible for on-site supervision and management, as well as all payrolling and the payment of legally required insurance premiums. For such services, the firm charges the organization a general fee for its labor costs (wages and benefits) plus a markup percentage of labor costs (usually 40%- 50%) to cover these services' costs plus provide a profit.
There may be additional charges for specially provided services, such as extra testing or background checks or skill training. Temp-to-perm workers may be hired away from the firm (with its permission and for a special fee) by the organization to become regular employees in the core workforce. For larger clients the firm may provide an on-site manager to help the organization plan its specific staffing needs, supervise and appraise the performance of the temporary workers, handle discipline and complaints, and facilitate firm-organization relations. With such additional staffing services, the firm functions increasingly like a staffing partner rather than just a staffing supplier.
Use of a staffing firm requires advanced planning, rather than a panicky phone call to a firm at the moment of staffing need. In
Page 124
addition to becoming aware of firms that might be accessed, it is wise to become familiar with their characteristics and services. Shown in L Exhibit 3.11 are the various factors and issues to become knowledgeable about for any firm.
Outsourcing
Outsourcing of work functions can be defined as the transfer of a business process to an external organization. This is a more drastic step than simply using ICs or temporary employees. The primary difference is that when processes are outsourced, the organization expects to receive a completely finished product from the external source. This means the organization does not direct or control the way in which work is performed; rather, it only receives the end result of the work.
Within the HR department, it has become the norm for organizations to completely outsource routine or highly specialized tasks, including payroll, benefits, legal compliance, or development of online recruiting strategies. Other core functions like employee training, performance tracking, compensation system administration, and recruiting system management can also be outsourced. Smaller organizations without the resources for multiple HR staff are especially likely to use outsourcing.
Replacement Planning
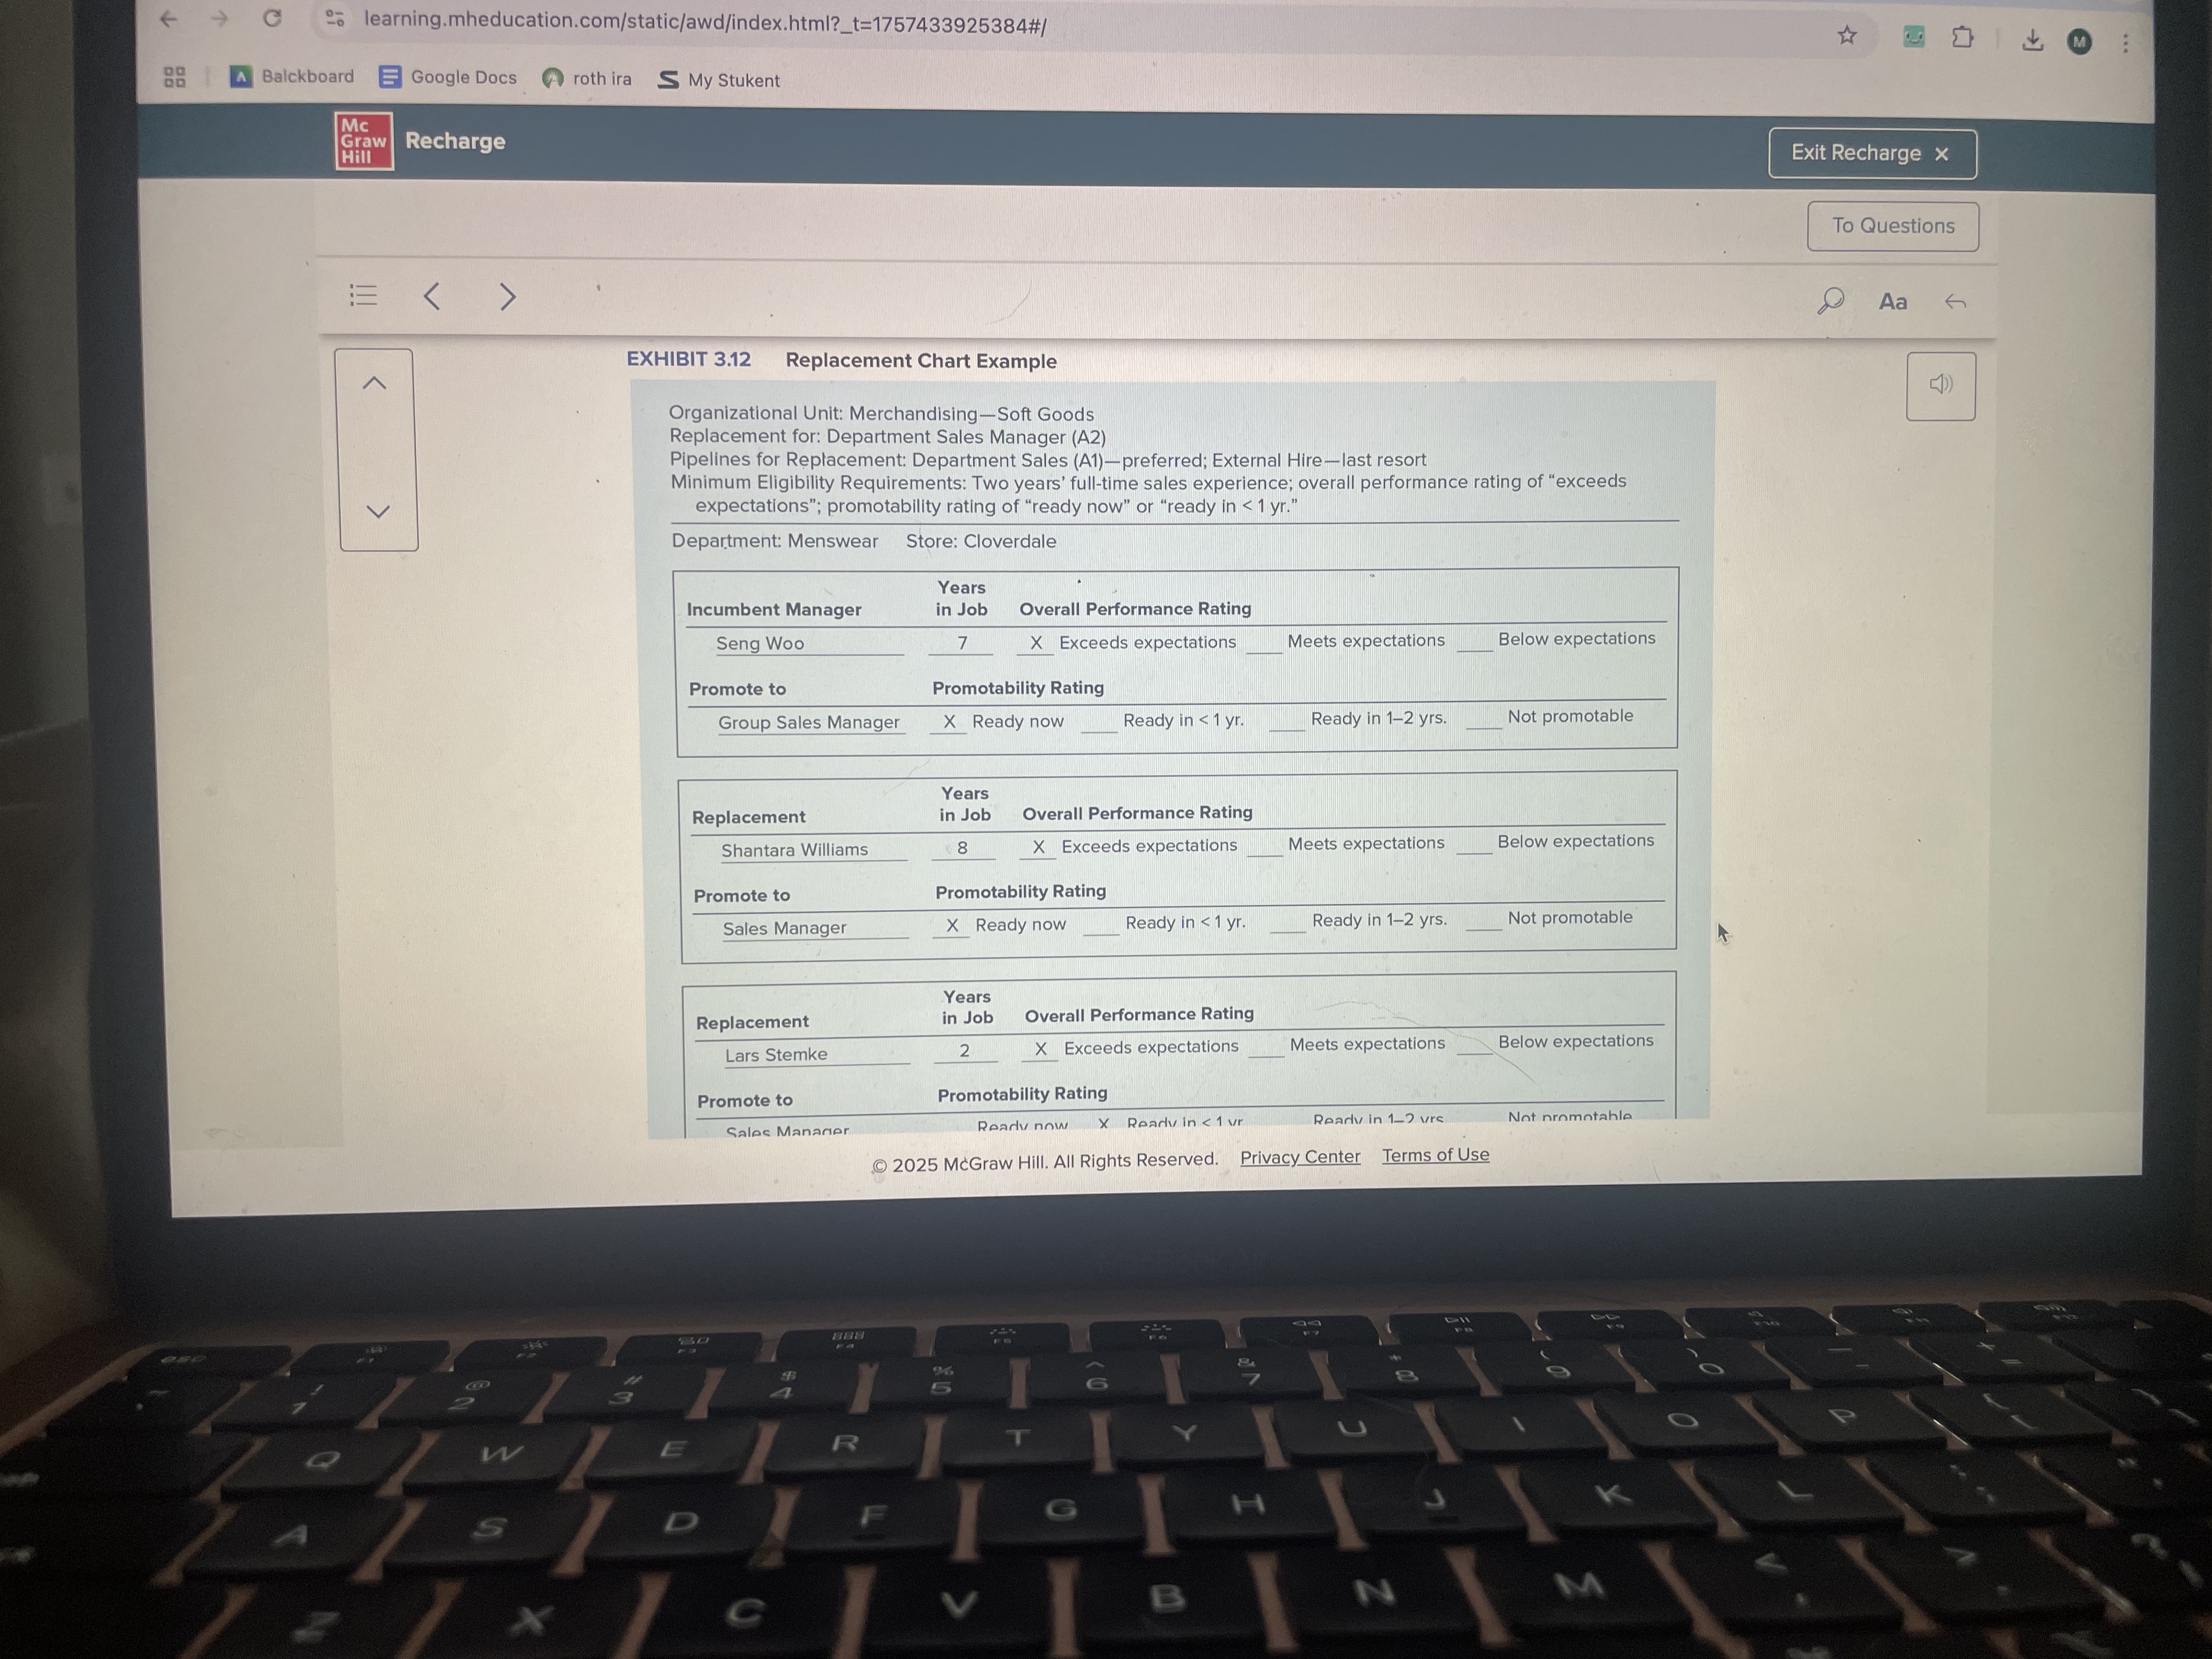
focuses on identifying individual employees who will be considered for promotion and thoroughly
Page 128
assessing their current capabilities and deficiencies. Training and development plans to improve the fit between capabilities and requirements are also developed. The focus is thus on both the quantity and the quality of availability. The results of replacement planning are shown on a replacement chart, an example of which is shown in
I L Exhibit 3.12. The chart is based on the previous sales-customer
service unit in L$ Exhibit 3.8. The focus is on replacement planning for the sales manager (A2) from the ranks of sales associates (Al) as part of the organization's "grow your own," promotion-from-within HR strategy. The top part of the chart indicates the organizational unit and jobs covered by replacement planning, as well as the minimum criteria for promotion eligibility.
Succession Planning
Succession plans build on replacement plans and directly tie into leadership development. The intent is to ensure that candidates for promotion will have the specific KSAOs and general competencies required for success across their careers. The key to succession planning is building a process that considers both people and positions. Considering people entails assessing each promotable employee for KSAO or competency gaps and then creating employee training and development plans that will close those gaps. Considering positions entails assessing which functions in the organization require extensive internal development and where long-term commitment to the organization's internal culture and strategic goals is important.
Affirmative Action Plans
AAPs are organization-specific plans that have a legal origin and basis. They precede diversity programs, which organizations typically undertake for strategic business reasons rather than legal ones. Often, however, the structure and content of AAPs and diversity programs are very similar. While AAPs are organization specific, they all share a common architecture composed of three major components: availability analysis of women and minorities, placement (hiring and promotion) goals derived from comparing availability with incumbency (percentages of women and minority employees), and action-oriented programs for meeting the placement goals. These components, and accompanying details, are spelled out in the federal regulations put forth and enforced by the Office of Federal Contract Compliance Programs (OFCCP). The Federal Contractor Compliance Manual may also be consulted
Affirmative Action Programs Regulations
All but very small federal contractors must develop and implement AAPs according to the OFCCP's affirmative action
Page 134
regulations. Below are a summary of those regulations and a sample of an AAP for small employers from the OFCCP website. The contractor must develop a separate AAP for each of its establishments with more than 50 employees. With advance approval from the OFCCP, the contractor may sidestep separate establishment plans by developing a functional plan that covers employees in discrete functional or business units, even though they are in different locations. All employees must be included in either AAP. The description that follows is for an establishment plan. It uses race, ethnicity, and job category designations on the EEO-1 form (see the staffing system management chapter). OFCCP race, ethnicity, and job category designations are somewhat different. Usage of either EEOC or OFCCP designations is acceptable.
Job Group Analysis.
Jobs with similar content, wage rates, and opportunities (e.g., promotion, training) must be combined into job groups, and each group must include a list of job titles. Small establishments (fewer than 150 employees) may use the categories on the EEO-1 form: executives/senior level officials and managers, first/mid-level officials and managers, professionals, technicians, sales workers, administrative support workers, craft workers, operatives, laborers and helpers, and service workers. The percentage of minorities and the percentage of women (determined in the previous step) employed in each job group must be indicated.
Organization Display.
An organization display depicts the staffing pattern within an establishment. It provides a profile of the workforce at the establishment, and it assists in identifying units in which women or minorities are underrepresented. Key elements are a showing of organizational structure of lines of progression (promotion) among jobs or organization units, the total number of job incumbents, the total number of male and female incumbents, and the total number of male and female incumbents in each of the following groups: Hispanic, Whites, Blacks, Native Hawaiian or other Pacific Islander, Asian, American Indian or Alaskan Native, and two or more races.
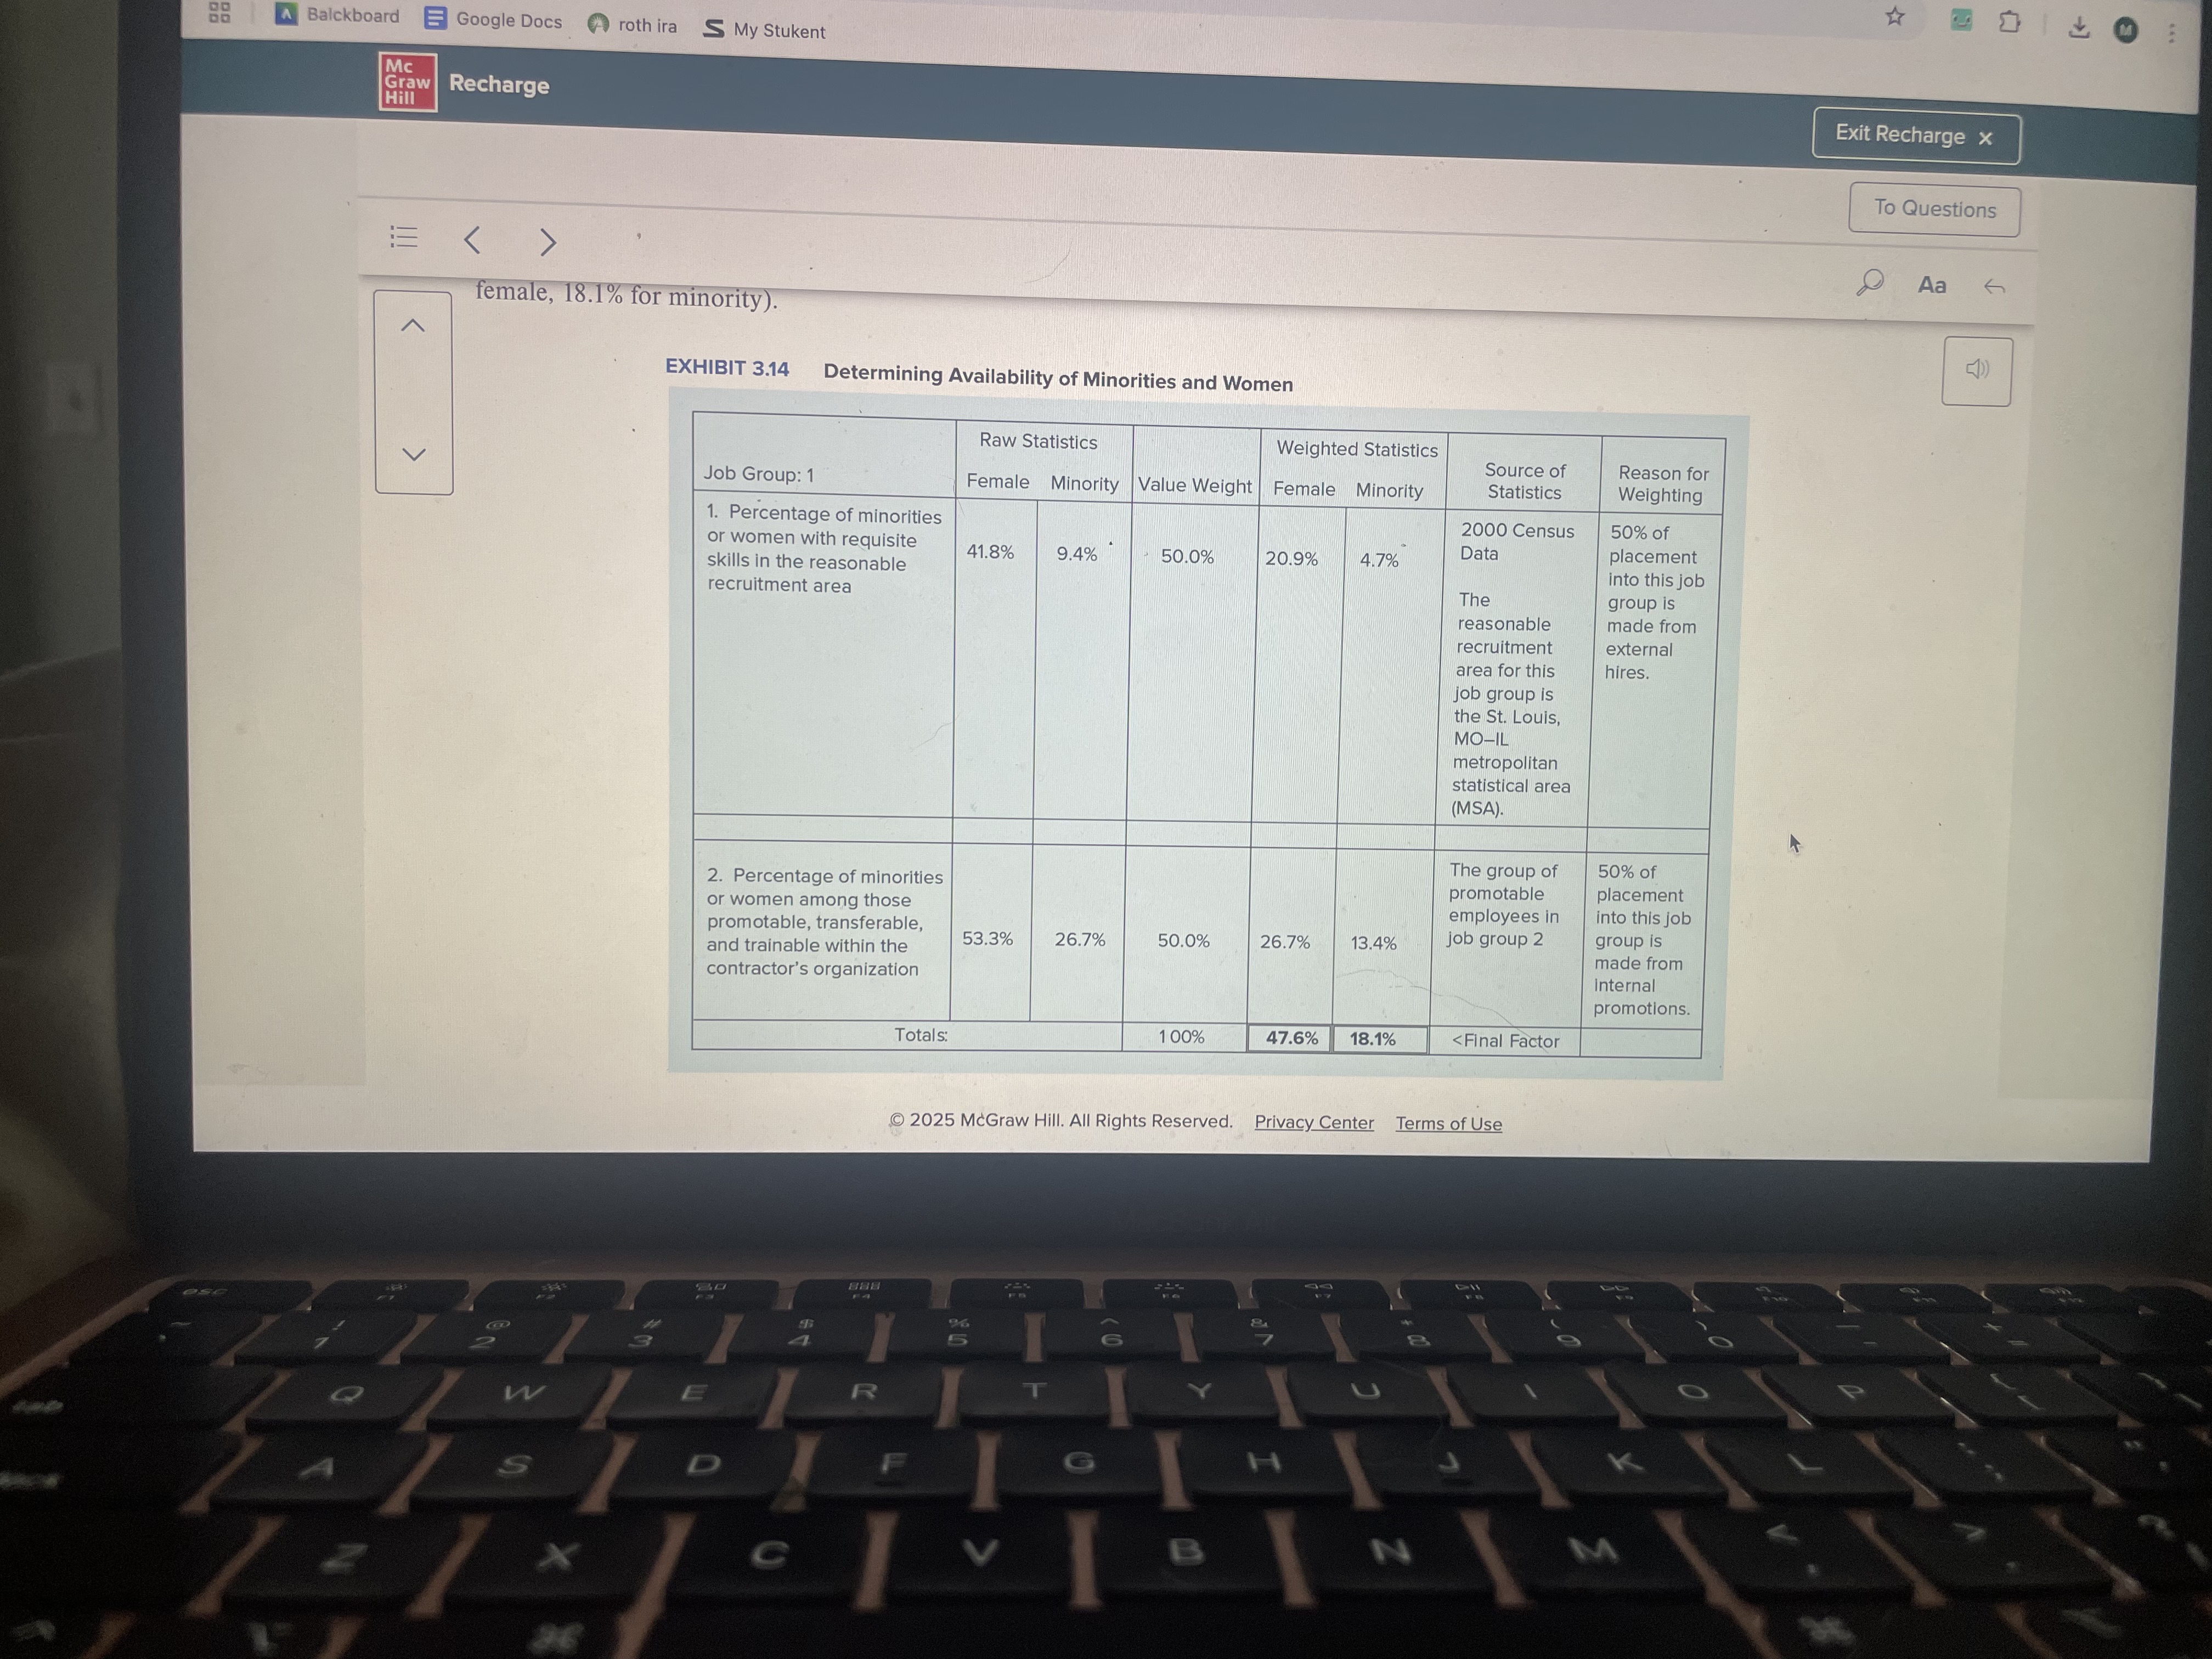
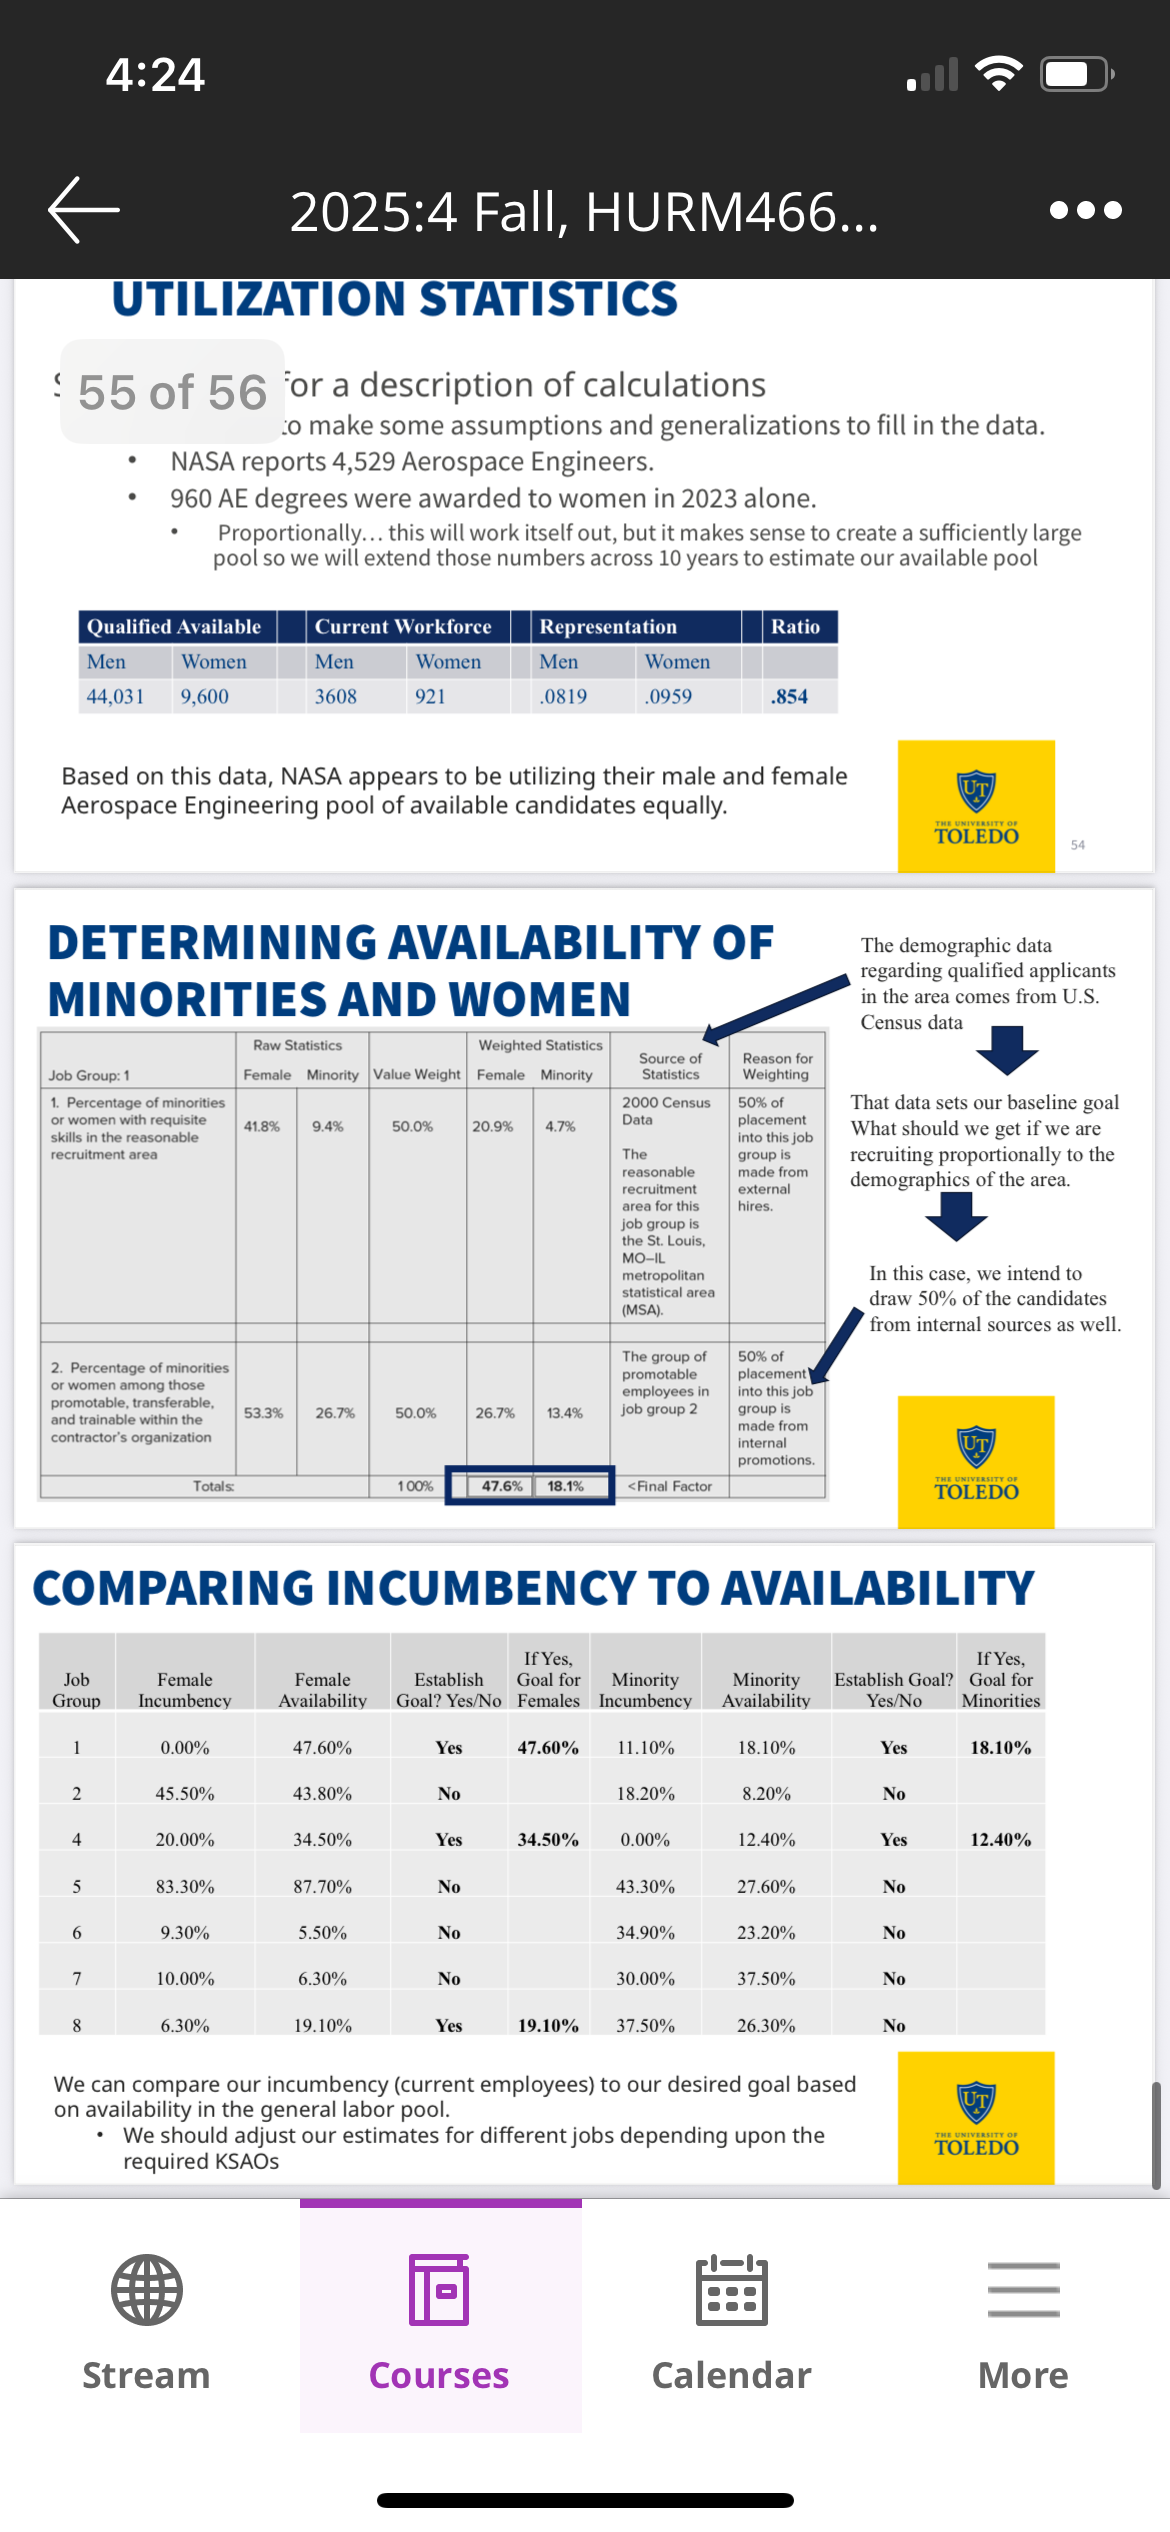
Availability Determination.
The availability of women and minorities must be determined separately for each job group. At a minimum, the following two factors should be considered when determining availability:
The percentage of minorities or women with requisite skills in the reasonable recruitment area
The percentage of minorities or women among those promotable, transferable, and trainable within the organization
Current census data, job service data, or other data should be consulted to determine availability. When there are multiple job titles in a job group, with different availability rates, a composite availability figure for the group must be calculated. This requires summing weighted availability estimates for the job titles.
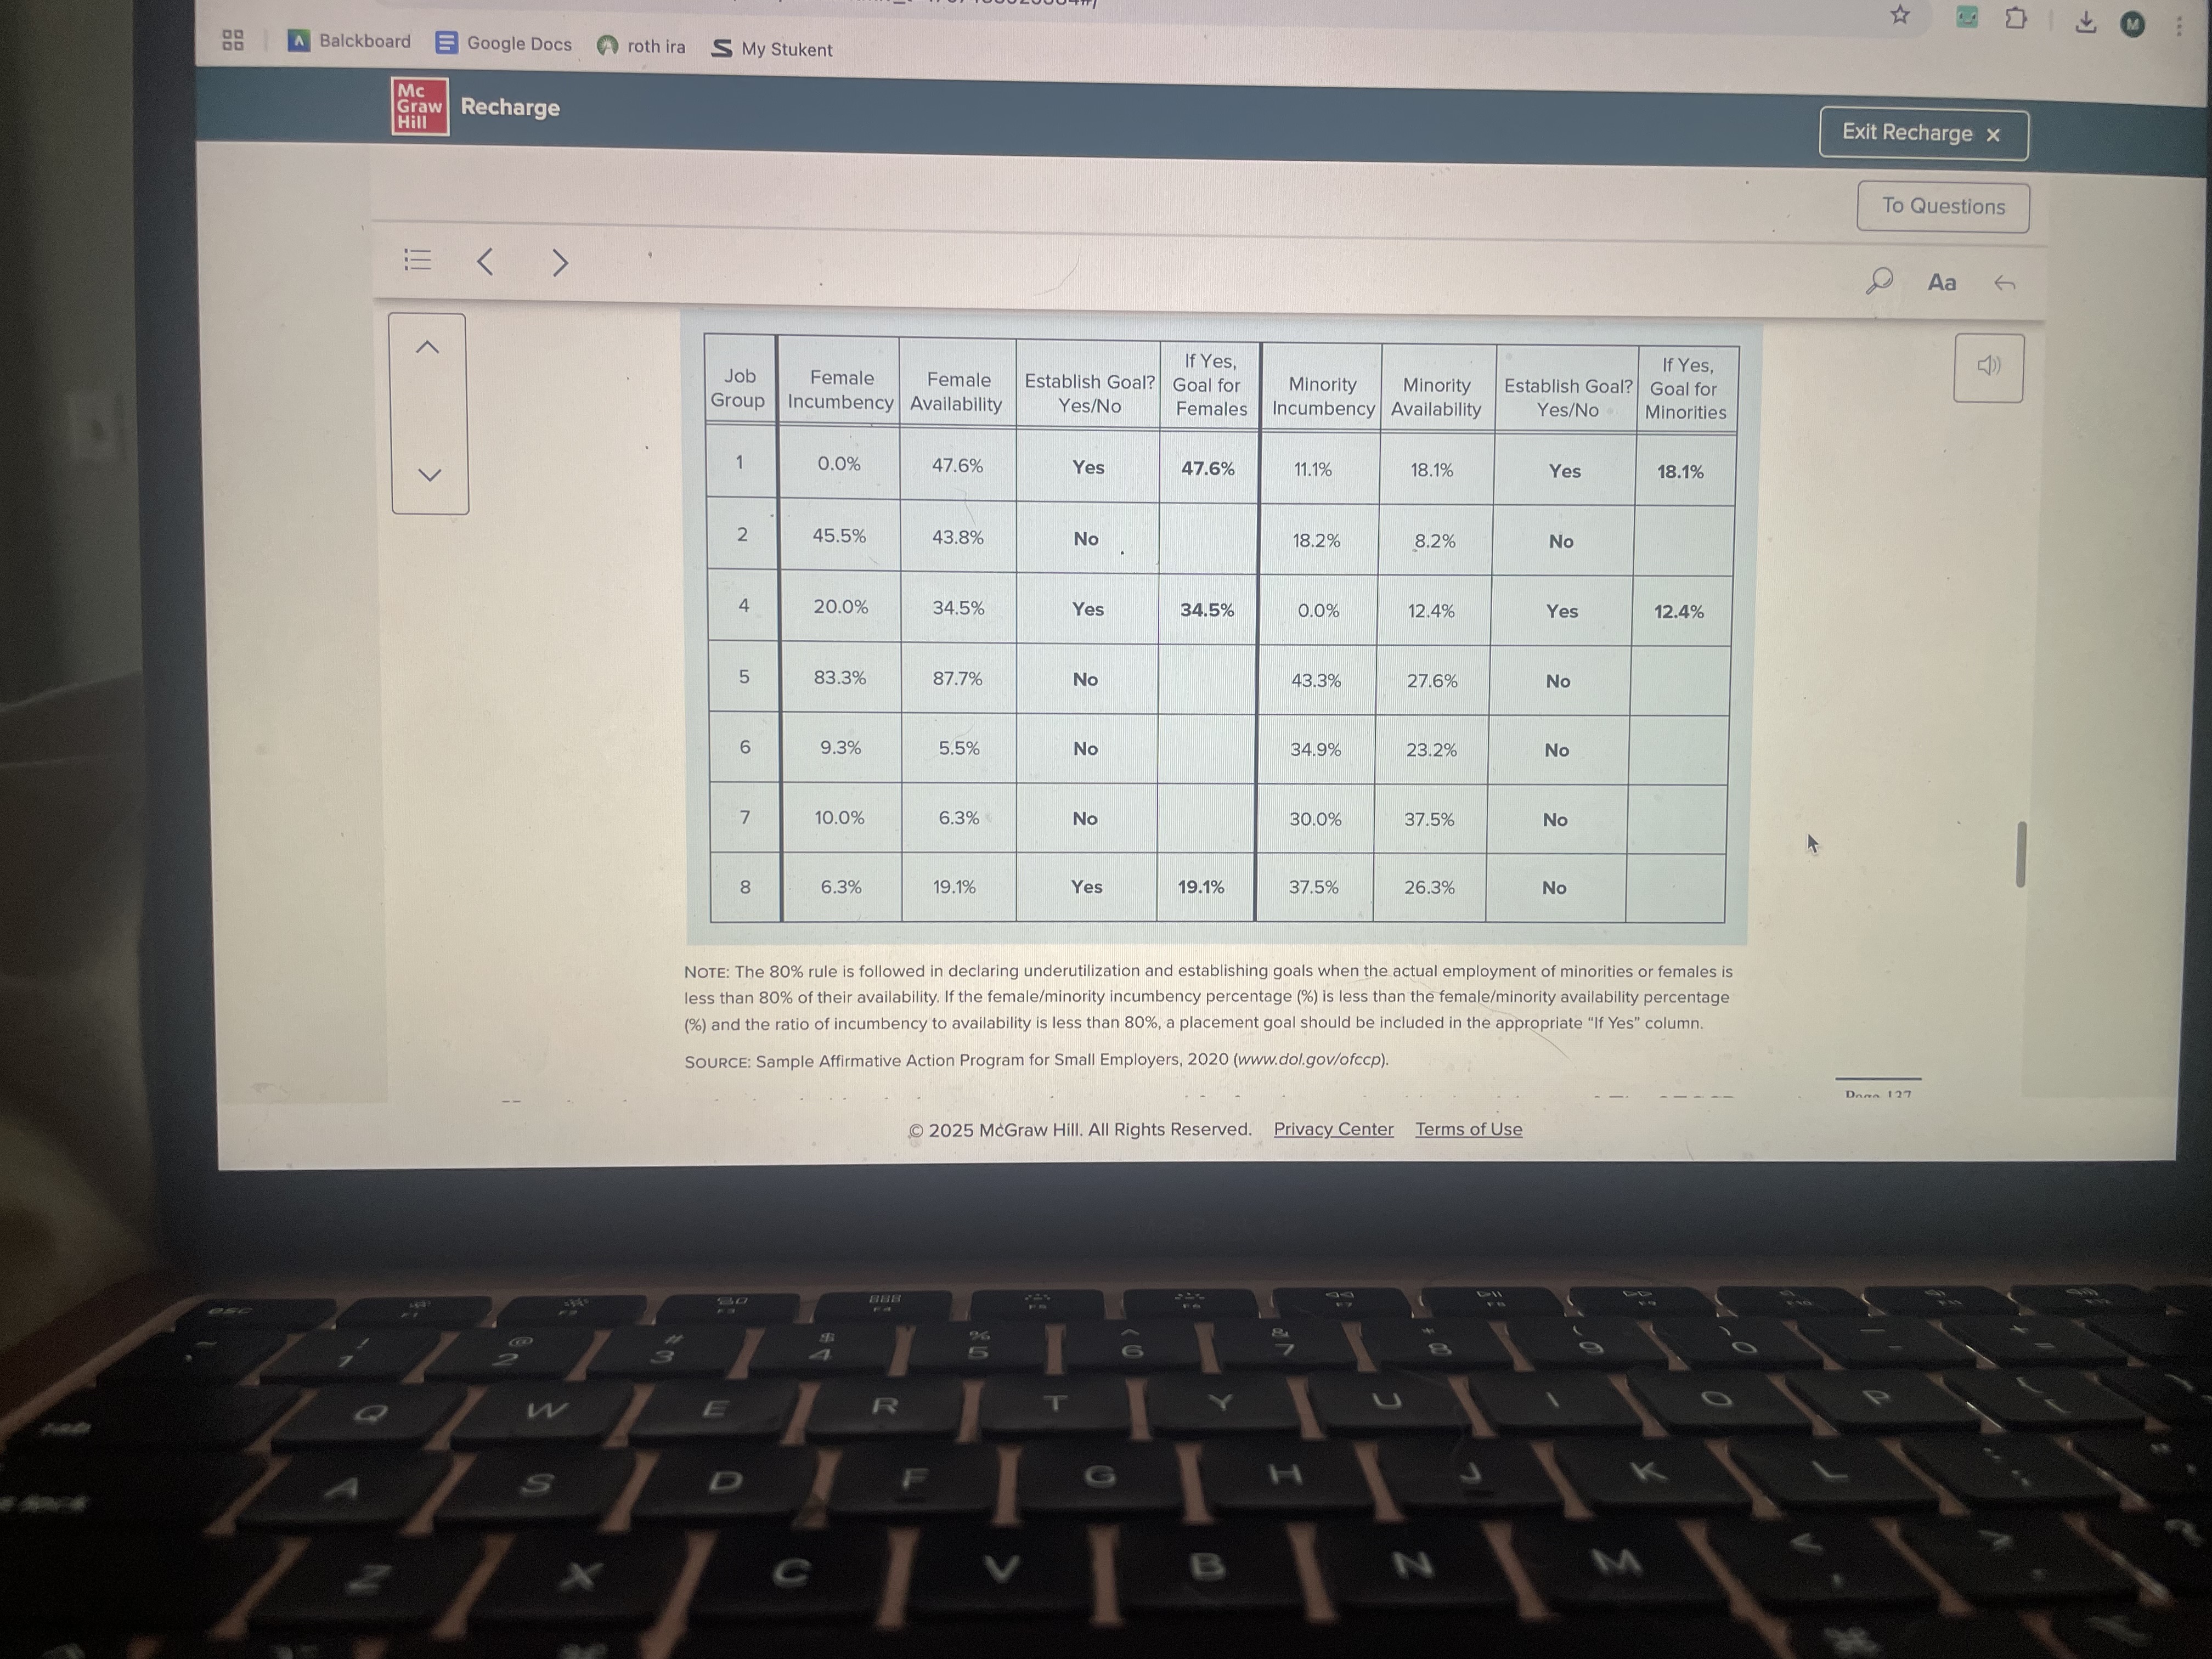
Comparison of Incumbency With Availability.
For each job group, the percentages of women and minority
Page 136
incumbents must be compared with their availability. When the percentage employed is less than would reasonably be expected by the availability percentage, a placement goal must be established.
Exhibit 3.15 compares incumbency with availability for eight job groups, including job group 1. The comparisons are shown separately for females and minorities. Where incumbency is less than availability, the organization may decide to establish a placement goal. In job group 1, it was concluded that the differences between availability and incumbency percentages for both females and minorities were sufficient to warrant placement goals (47.6% for females and 18.1% for minorities). Note that an incumbency percentage less than an availability percentage does not automatically trigger a placement goal (e.g., females in job group 5).
Legality of AAPs and Diversity Programs
AAPs have been controversial since their inception, and there have been many challenges to their legality. Questions of legality involve complex issues of constitutionality, statutory interpretations, differences in the structure of the AAPs being challenged in the courts, claims that affirmative action goals represent hiring quotas, and, very importantly, differences in the amount of weight placed on race or gender in the ultimate selection decisions made about job applicants.
Despite these problems,
it is possible to provide several conclusions and recommendations regarding affirmative action. AAPs in general are legal in the eyes of the Supreme Court. However, to be acceptable, an AAP should be based on the following guidelines:"
• The plan should have as its purpose the remedying of specific and identifiable effects of past discrimination.
Page 139
The plan should address the current underutilization of women and/or minorities in the organization.
The plan should be temporary and should be eliminated once affirmative action goals have been achieved.
All candidates for positions should be qualified for those positions.
The plan should include organizational enforcement mechanisms as well as a grievance procedure.
AAPs for Veterans and Individuals With Disabilities
There are specific AAP regulations for federal contractors under the Vietnam Era Veterans' Readjustment Assistance Act and the Rehabilitation Act. Though each law has its own regulations, the regulations include many common requirements, most importantly for staffing:
Establishing an annual hiring goal (8% for veterans and 7% for qualified individuals with disabilities)
Conducting a review of personnel processes to ensure they provide for careful, thorough, and systematic consideration of the job qualifications of applicants and employees for job vacancies filled by hiring or promotion and for training opportunities
Reviewing all physical or mental job qualifications to ensure that they do not tend to screen out individuals with disabilities or veterans, and that the qualifications are job related and consistent with business necessity
Providing reasonable accommodation for physical and mental limitations, unless it would impose an undue hardship on the operation of the business
Undertaking appropriate outreach and positive recruitment activities (many suggested activities are listed) and evaluating their effectiveness annually
Inviting voluntary self-identification by applicants pre-offer, and employees post-offer, of disabilities and veteran status
INTERNAL INFLUENCES ON STAFFING
Organizational strategy
Current financial and human resources
Demand for products and/or services
Competitors and partners
Financial and marketing goals
INTERNAL INFLUENCES ON STAFFING
Organizational culture
Expressed vision of executives
Degree of hierarchy and bureaucracy
Style of communication
EXTERNAL INFLUENCES ON STAFFING
Labor markets
Labor demand (# of vacant jobs)
Labor supply (# of unemployed people)
Labor shortages and surpluses
Employment arrangements
The Bureau of Labor Statistics provides a ton of information on this. It is freely available. It is better to track trends over time than to focus too much on any one data point.
This data is frequently interpreted in light of current events both global and domestic.
• Numbers are regularly revised.
MAJOR WORKFORCE TRENDS
Creating better relationships between workers and technology
Continuing high cost of health care in the United States
Increased use of flexible work schedules
Increased attention to mental health issues
Addressing workforce skills gaps
Preparing the newest generations of workers for the workforce Preventing burnout due to constant contact outside of regular work hours
Greater need for cross-cultural understanding in business settings
WILL AI REPLACE JOBS?... SURE
As elevator operators were replaced by automatic elevators, there was an increase in the need for elevator technicians to perform maintenance and conduct safety inspections regularly
Similarly, before the increased accessibility offered by the copy machines (1950s) and internet connected PCs (1990s), organizations used to have
"typing pools" of clerical workers and more couriers to deliver memos and notices. Now we have IT departments.
Technology "changes" the nature of work and jobs.
Internal staffing
Advantages
Positive employee reactions to promotion from within
Quick method to identify job applicants
• Less expensive
Less time required to reach full productivity
Disadvantages
No new KSAOs into the organization
May perpetuate current underrepresentation of minorities and women
Small labor market to recruit from
Inexperienced employees may require more training time
External staffing
Advantages:
Brings in employees with new KSAOs Larger number of minorities and women to draw from
Large labor market to draw from Experienced employees may require less training time
disadvantage:
Negative reaction by internal applicants
Time-consuming to identify applicants Expensive to search external labor market
More time required to reach full productivity
STRATEGIC PLANNING
Key considerations in strategic planning
A vision based on organizational values and core competencies
Strategies for achieving planning process goals
Contingency plans
Methods for measuring performance relative to goals and objectives
Implications of planning process
Current and future competencies demanded
Planning time frame
Roles and responsibilities
HR Planning
in general is an active process which requires input from multiple stakeholders and consideration of the overall organizational goals and objectives.
FORECASTING REQUIREMENTS
Statistical techniques
Trend analysis
Ratio analysis
Regression analysis
Judgmental techniques
"Top-down" approach
"Bottom-up" approach
Scenario planning
• Incorporating manager judgment of potential future outcomes into statistical models
TREND ANALYSIS
Gather data on staffing levels over time and arrange in a spreadsheet with one column for employment levels and another column for time.
• Typically we equate employment levels based on Full-Time Equivalent (FTE)
EX: 1 Employee working 40 hours per week or 2 employees working 20 hours per week both = 1 FTE
1 employee working 20 hours overtime on average (60 hours per week) is 1.5 FTE
Predict trend in employee demand by fitting a line to trends in historical staffing levels over time (this can be done by using regression or graphical methods in most spreadsheet programs).
Calculate period demand index by dividing each period's demand by the average annual demand.
Example: January demand index = Avg. January FTE/Avg. annual FTE
4. Multiply the previous year's FTEs by the trend figure, then multiply this figure by the period's demand index.
Predict trend in employee demand by
fitting a line to trends in historical staffing levels over time (this can be done by using regression or graphical methods in most spreadsheet programs).
Calculate period demand index by
dividing each period's demand by the average annual demand.
RATIO ANALYSIS
1. Examine historical ratios involving workforce size.
Example:
$ sales/1.0FTE=
No. of new customers/1.0 FTE
Assume ratio will be true in future.
Use ratio to predict future HR requirements.
Example:
$ 40,000/ 1.0 FTE is past ratio
(c)HR requirements= 100 FTEs
This method requires a clear link between the personnel needed and some other aspect of the business.
For Example:
If I had 500 Students and needed 30 teachers, then if I have 600 students next year, I should have how many teachers?
(keeping class sizes constant)
I might need about 36 teachers.

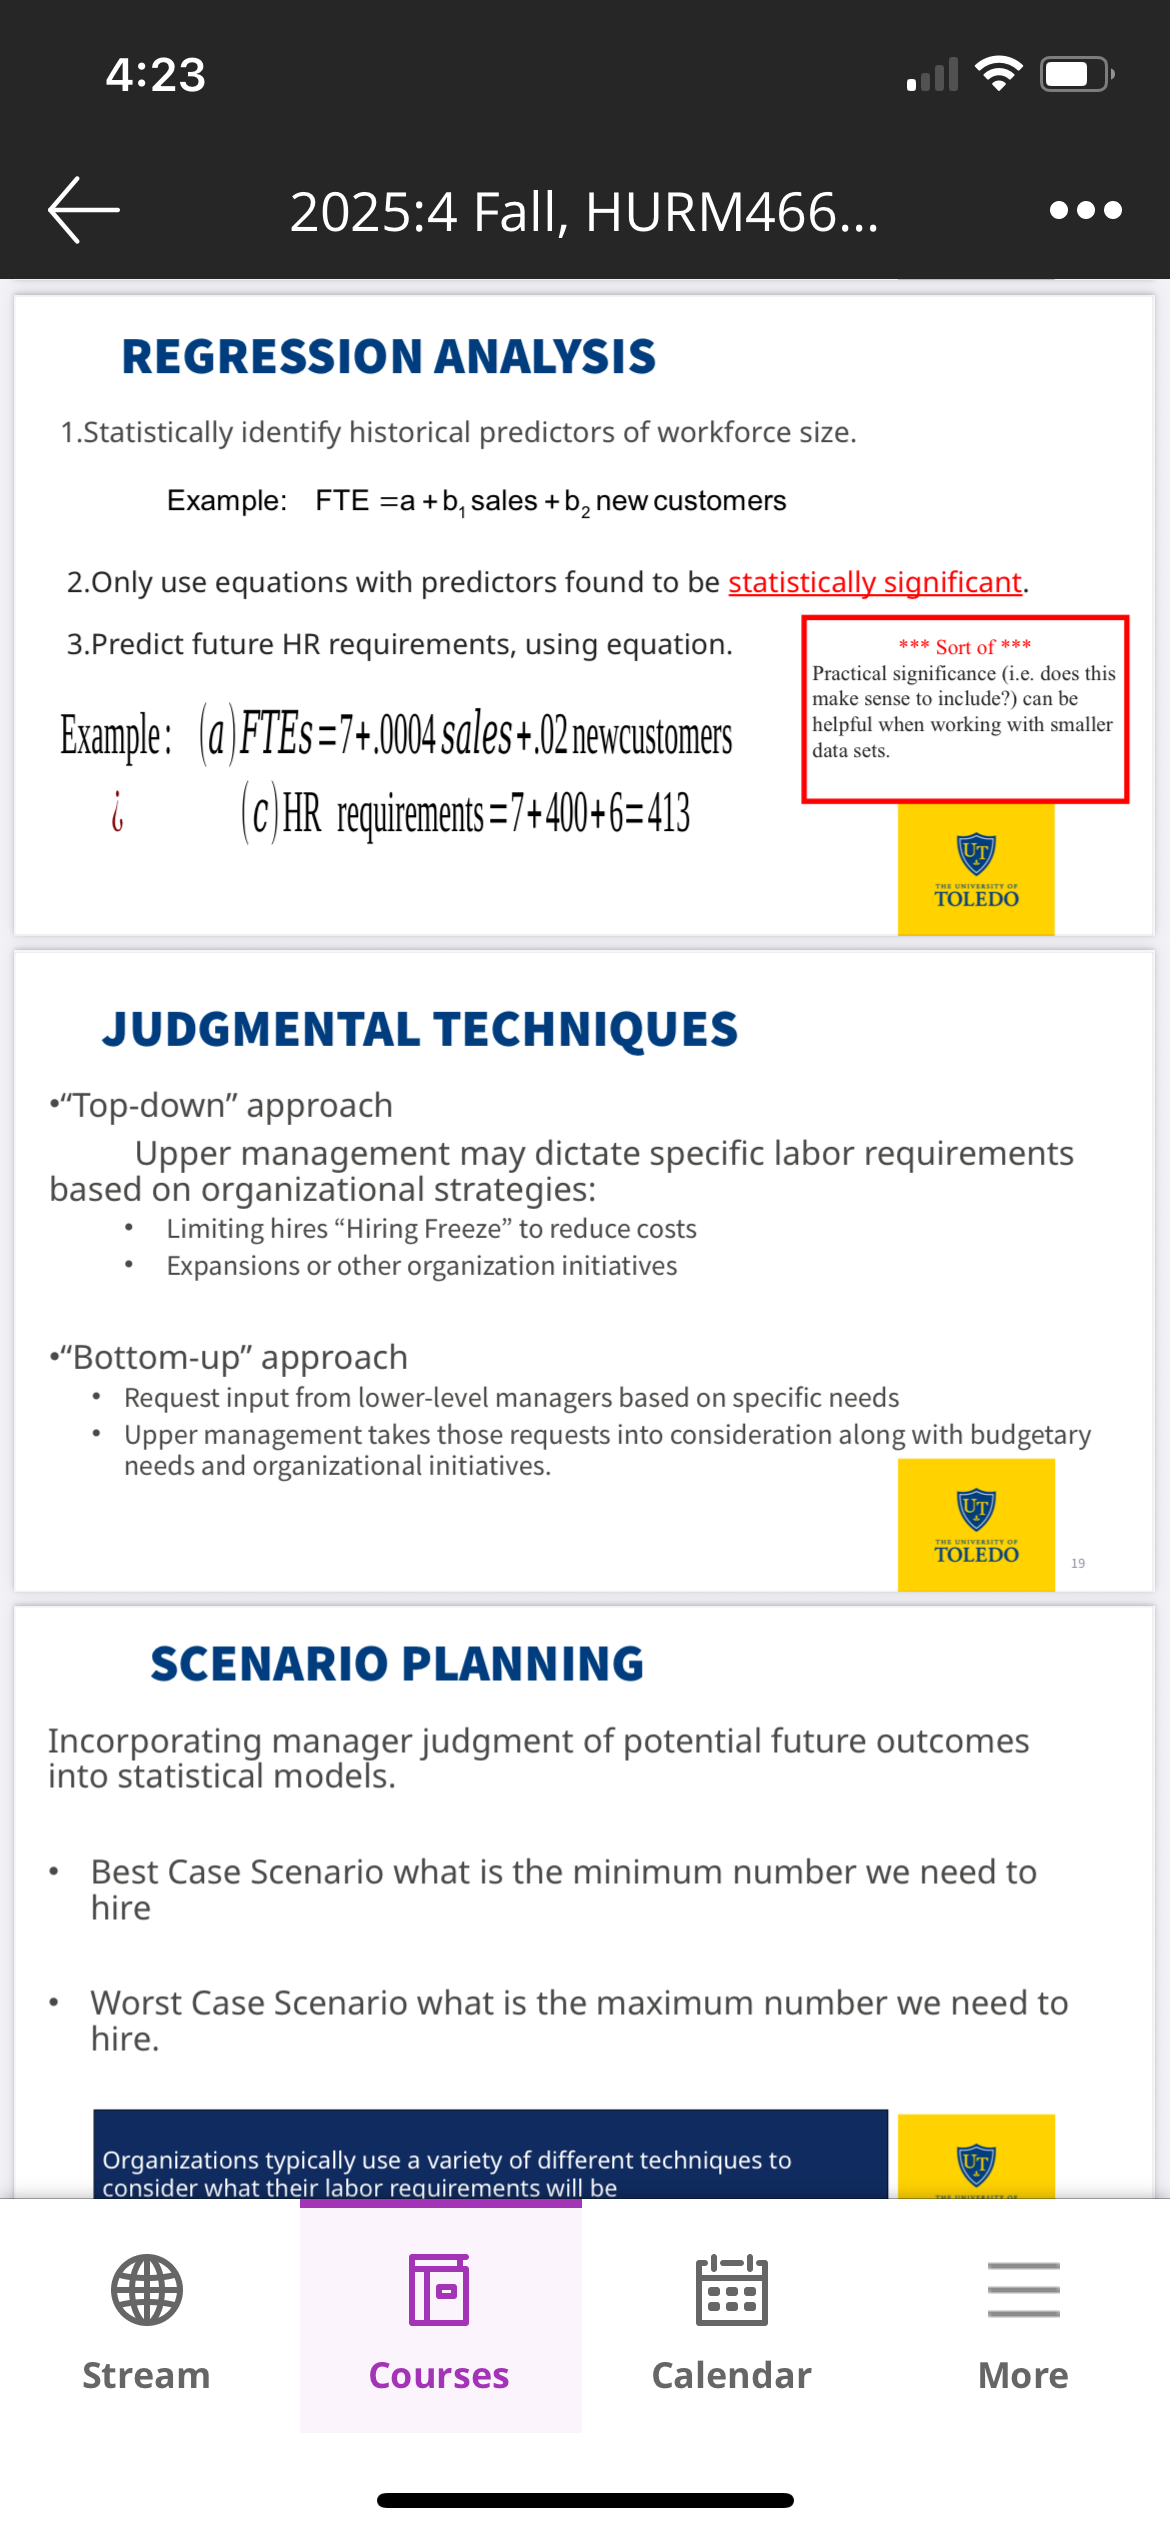
REGRESSION ANALYSIS
Statistically identify historical predictors of workforce size.
Example: FTE =a +b, sales + b2 new customersOnly use equations with predictors found to be statistically significant.
Predict future HR requirements, using equation.
•"Top-down" approach
Upper management may dictate specific labor requirements
based on organizational strategies:
Limiting hires "Hiring Freeze" to reduce costs
Expansions or other organization initiatives
"Bottom-up" approach
Request input from lower-level managers based on specific needs
Upper management takes those requests into consideration along with budgetary needs and organizational initiatives.
SCENARIO PLANNING
Incorporating manager judgment of potential future outcomes into statistical models.
Best Case Scenario what is the minimum number we need to hire
Worst Case Scenario what is the maximum number we need to hire.
FORECASTING AVAILABILITIES
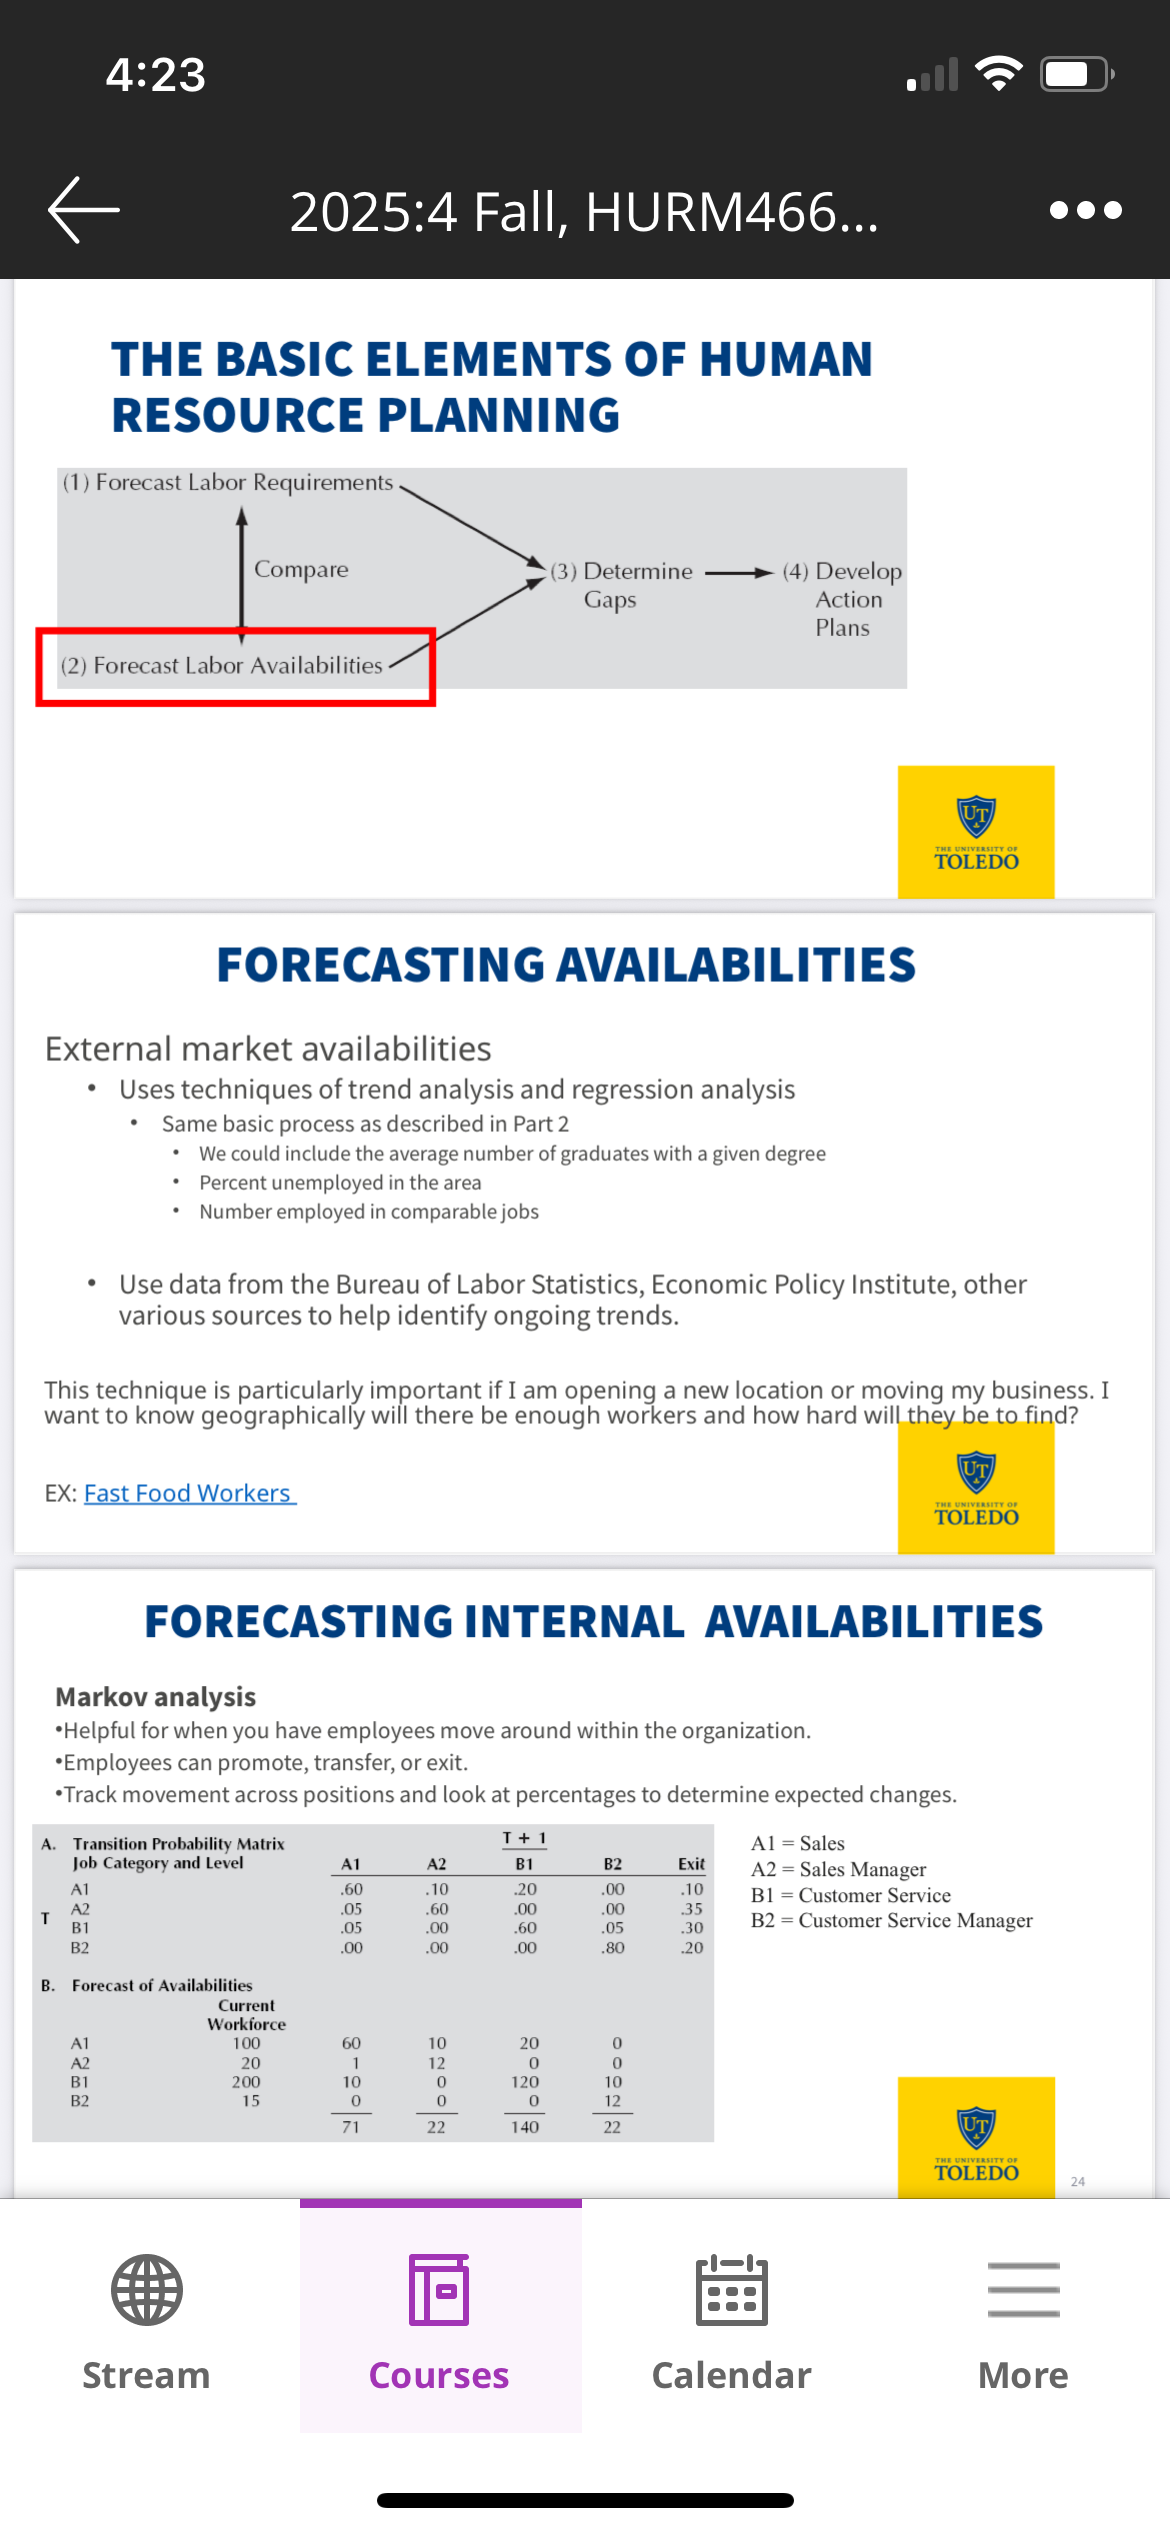
External market availabilities
Uses techniques of trend analysis and regression analysis
Same basic process as described in Part 2
We could include the average number of graduates with a given degree
Percent unemployed in the area
Number employed in comparable jobs
Use data from the Bureau of Labor Statistics, Economic Policy Institute, other various sources to help identify ongoing trends.
his technique is particularly important if 1 am opening a new location or moving my business.. vant to know geographically will there be enough workers and how hard will they be to find?
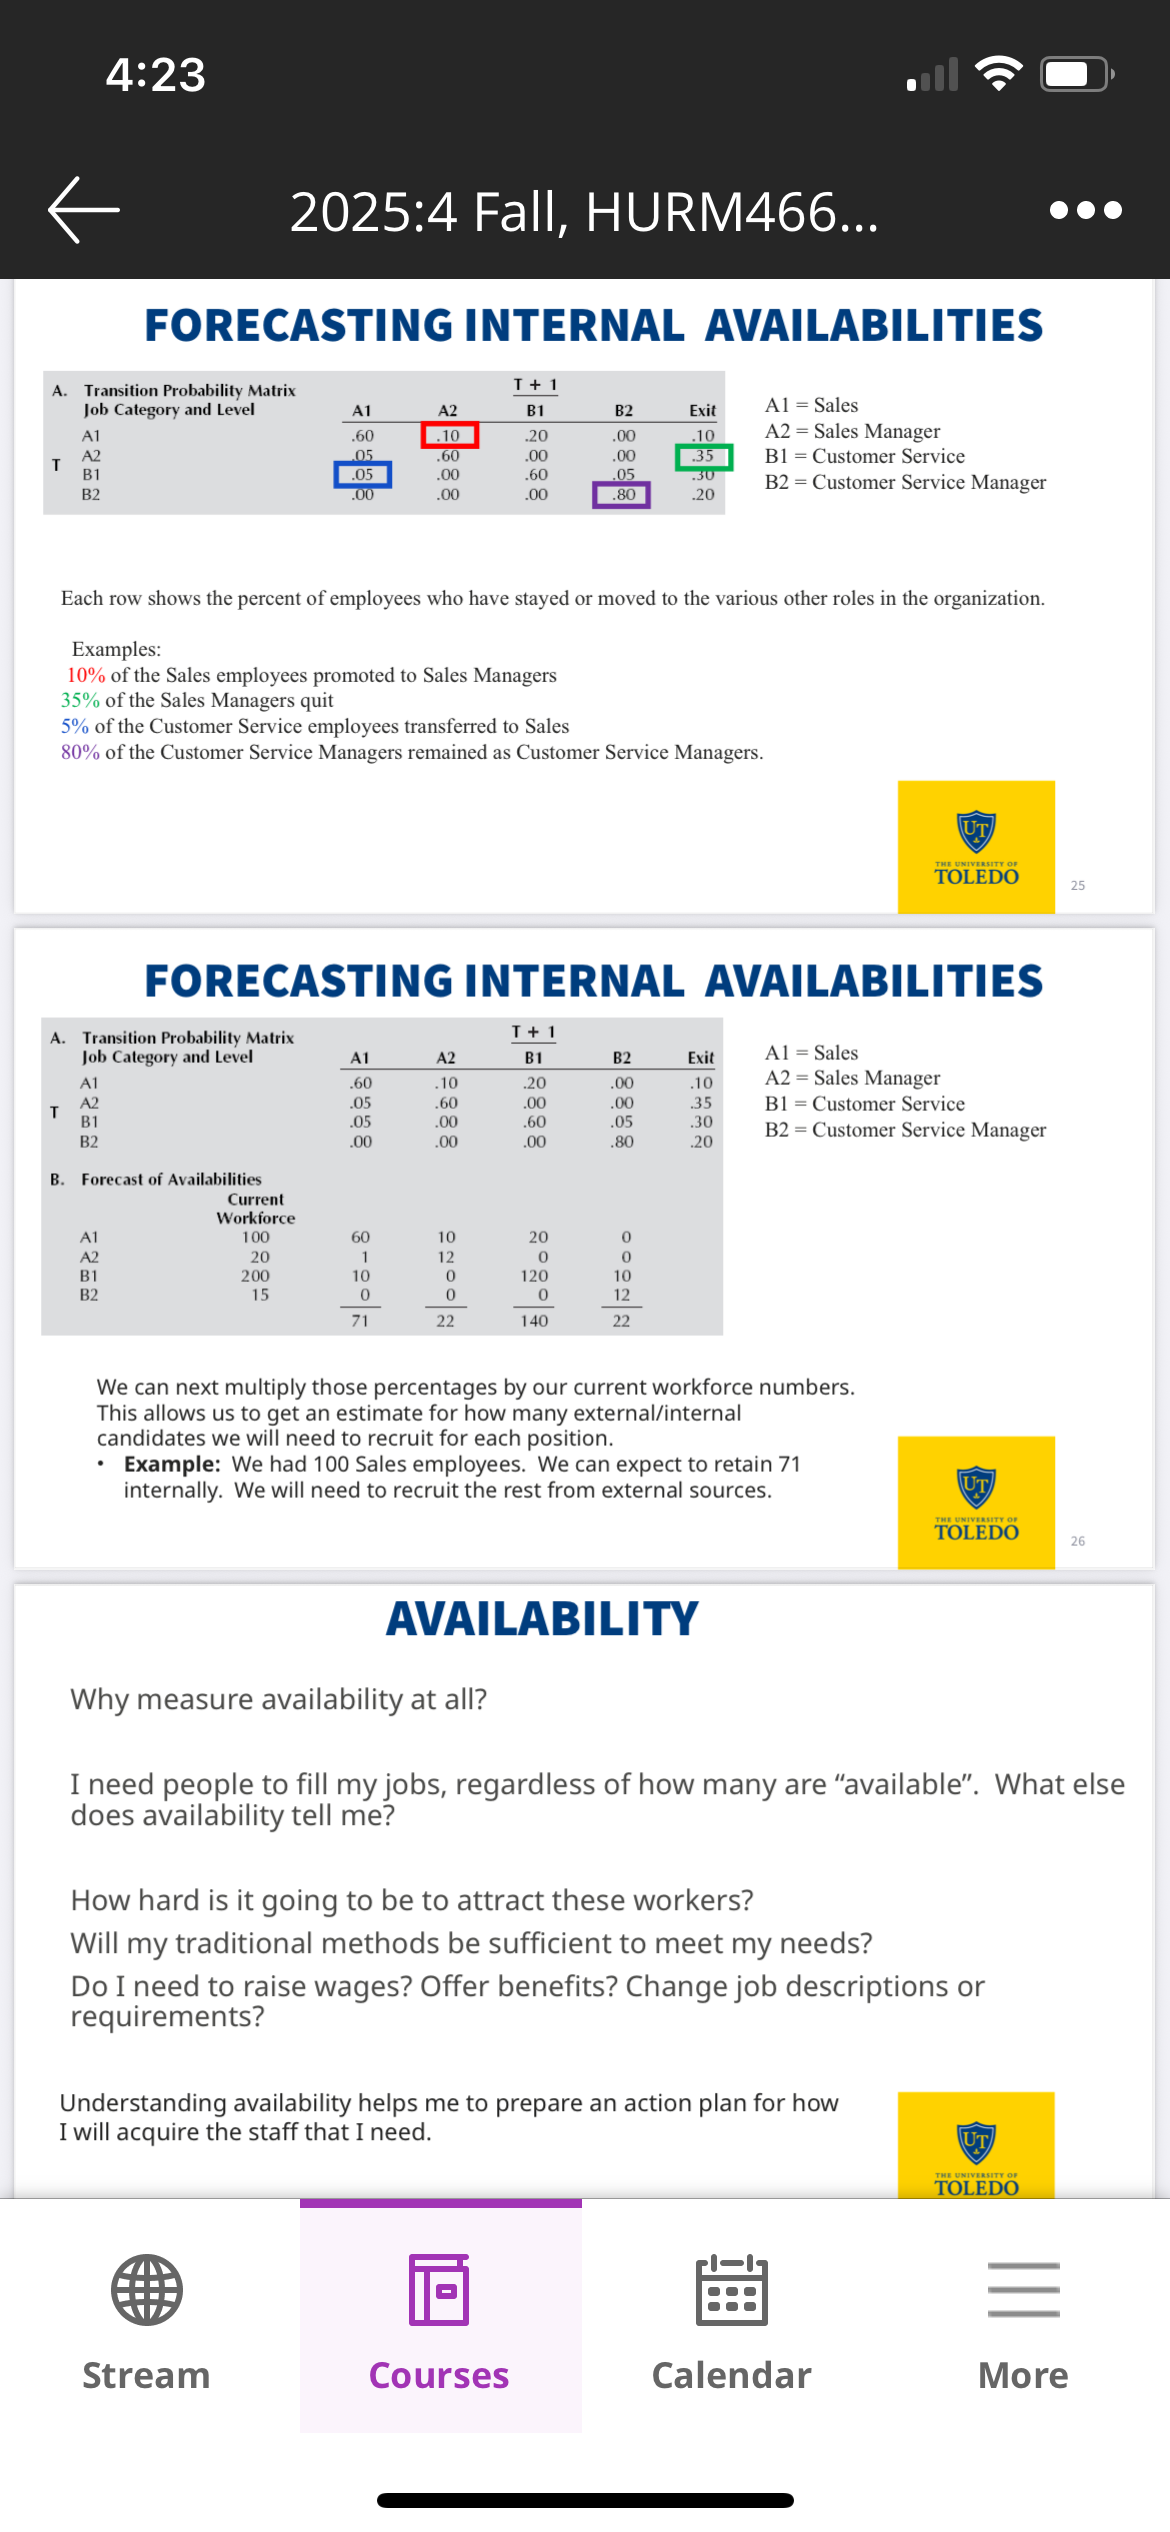
Markov analysis
Helpful for when you have employees move around within the organization.
Employees can promote, transfer, or exit.
Track movement across positions and look at percentages to determine expected changes.
We can next multiply those percentages by our current workforce numbers.
This allows us to get an estimate for how many external/internal candidates we will need to recruit for each position.
• Example: We had 100 Sales employees. We can expect to retain 71 internally. We will need to recruit the rest from external sources.
AVAILABILITY
Why measure availability at all?
I need people to fill my jobs, regardless of how many are "available". What else does availability tell me?
How hard is it going to be to attract these workers?
Will my traditional methods be sufficient to meet my needs?
Do I need to raise wages? Offer benefits? Change job descriptions or requirements?
Understanding availability helps me to prepare an action plan for how I will acquire the staff that I need.
RECONCILIATION AND GAPS
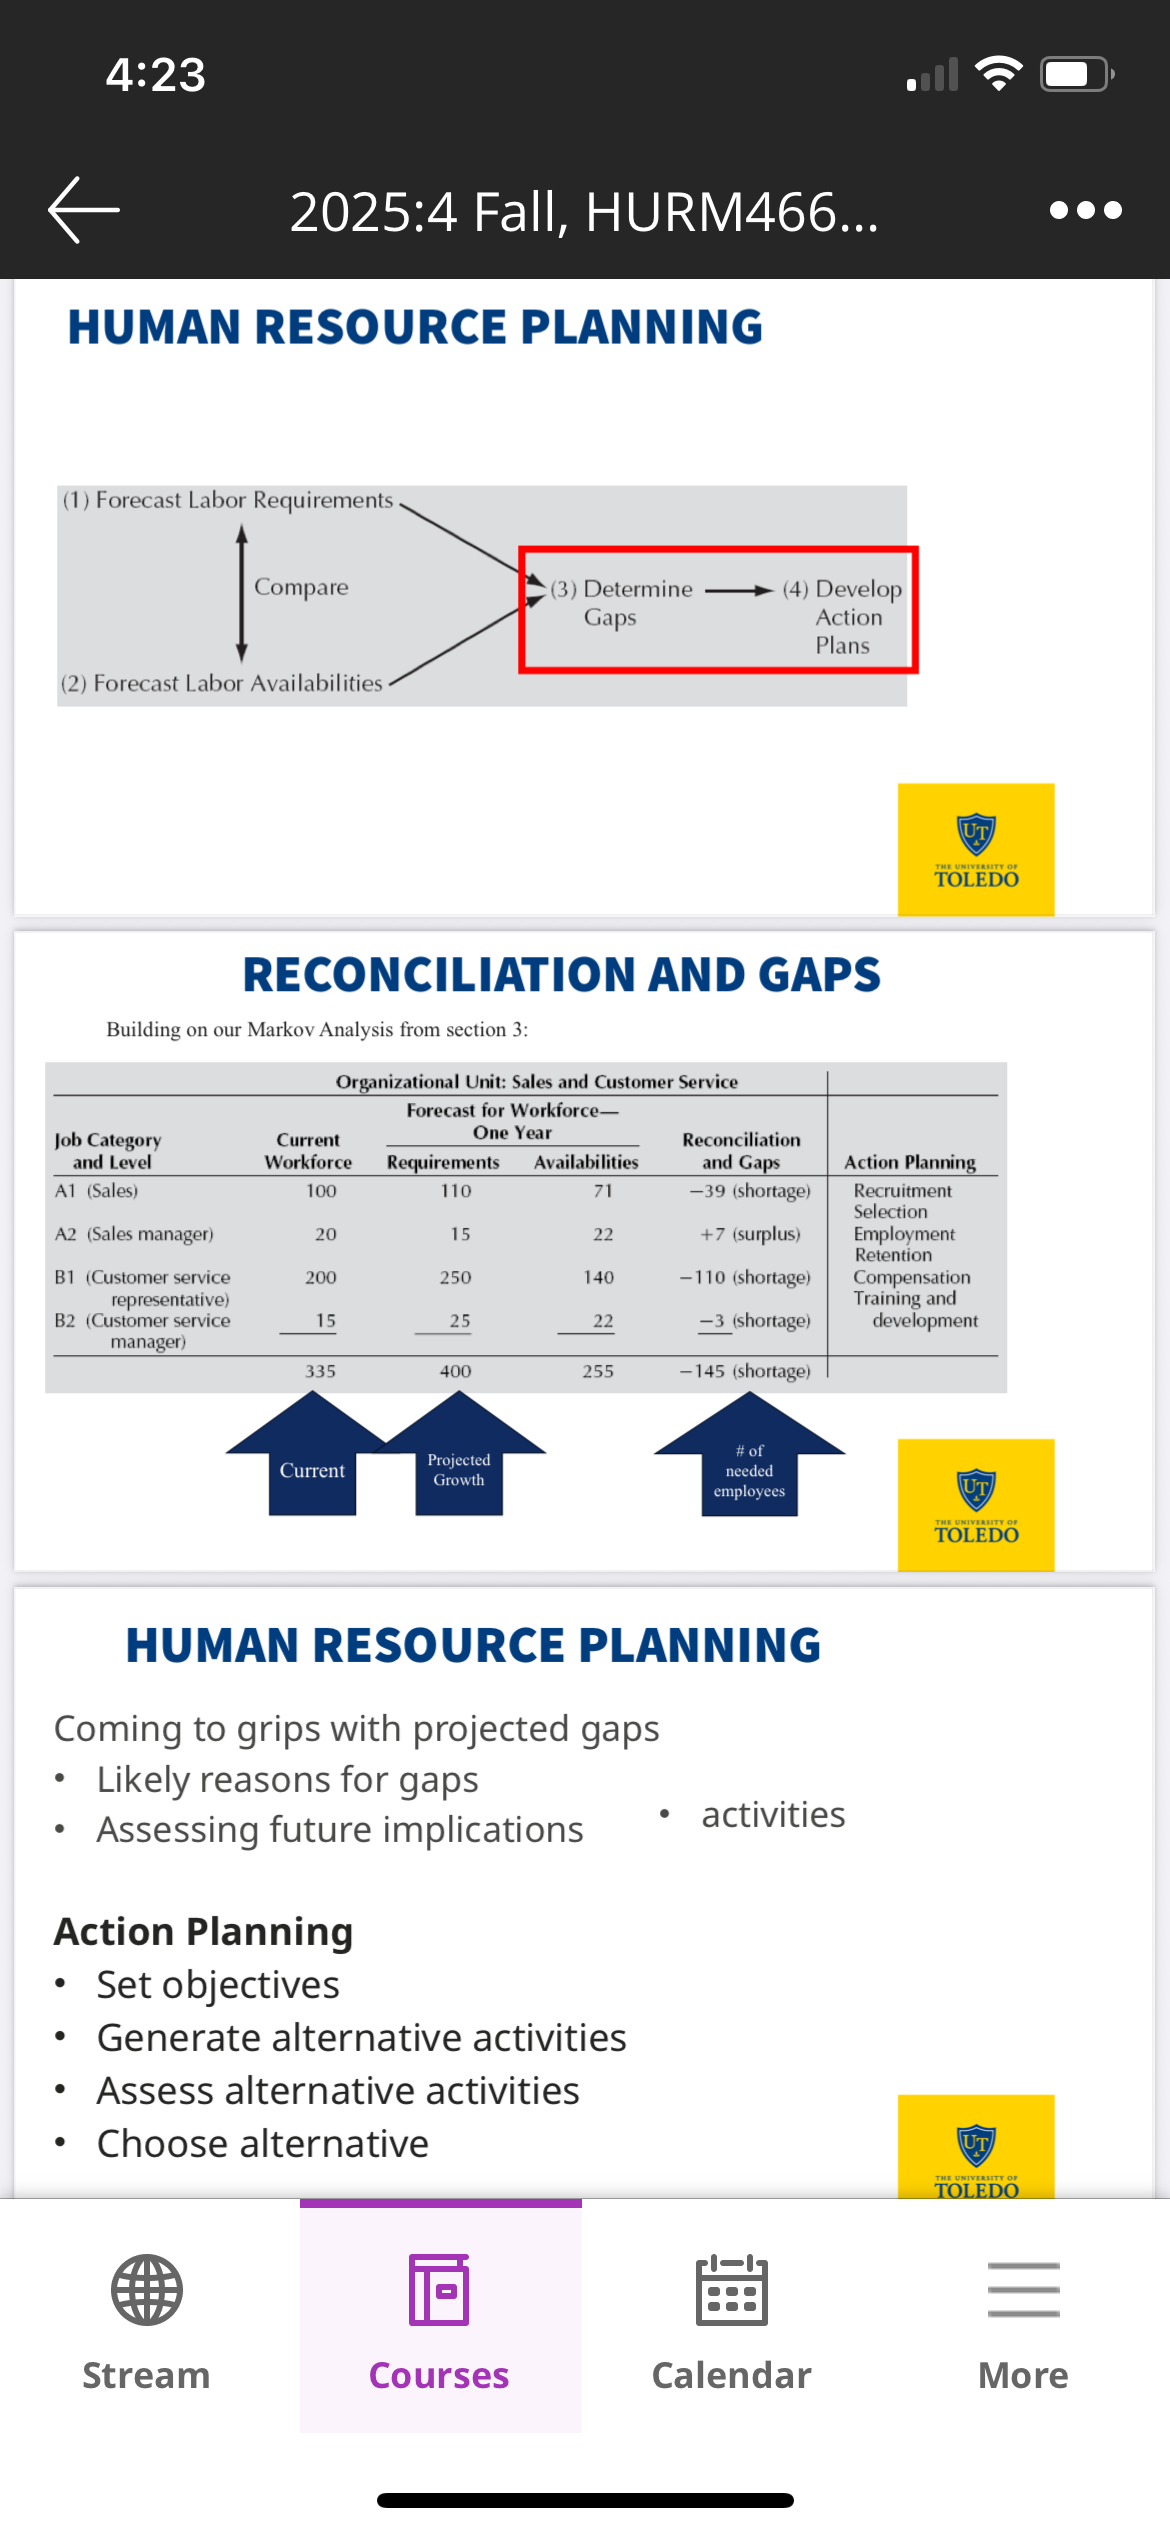
HUMAN RESOURCE PLANNING
Coming to grips with projected gaps
Likely reasons for gaps
Assessing future implications
• activities
Action Planning
Set objectives
Generate alternative activities
Assess alternative activities
Choose alternative
RECONCILING
Largest shortfall is in Customer Service Representatives.
30% Exit the organization / Biggest area of growth (+50)
Examine performance data
Examine exit interviews
: Conduct a compensation analysis
Expand budget for recruitment and selection
Could my excess Sales Managers become Customer Service Managers? Or go back to Sales?
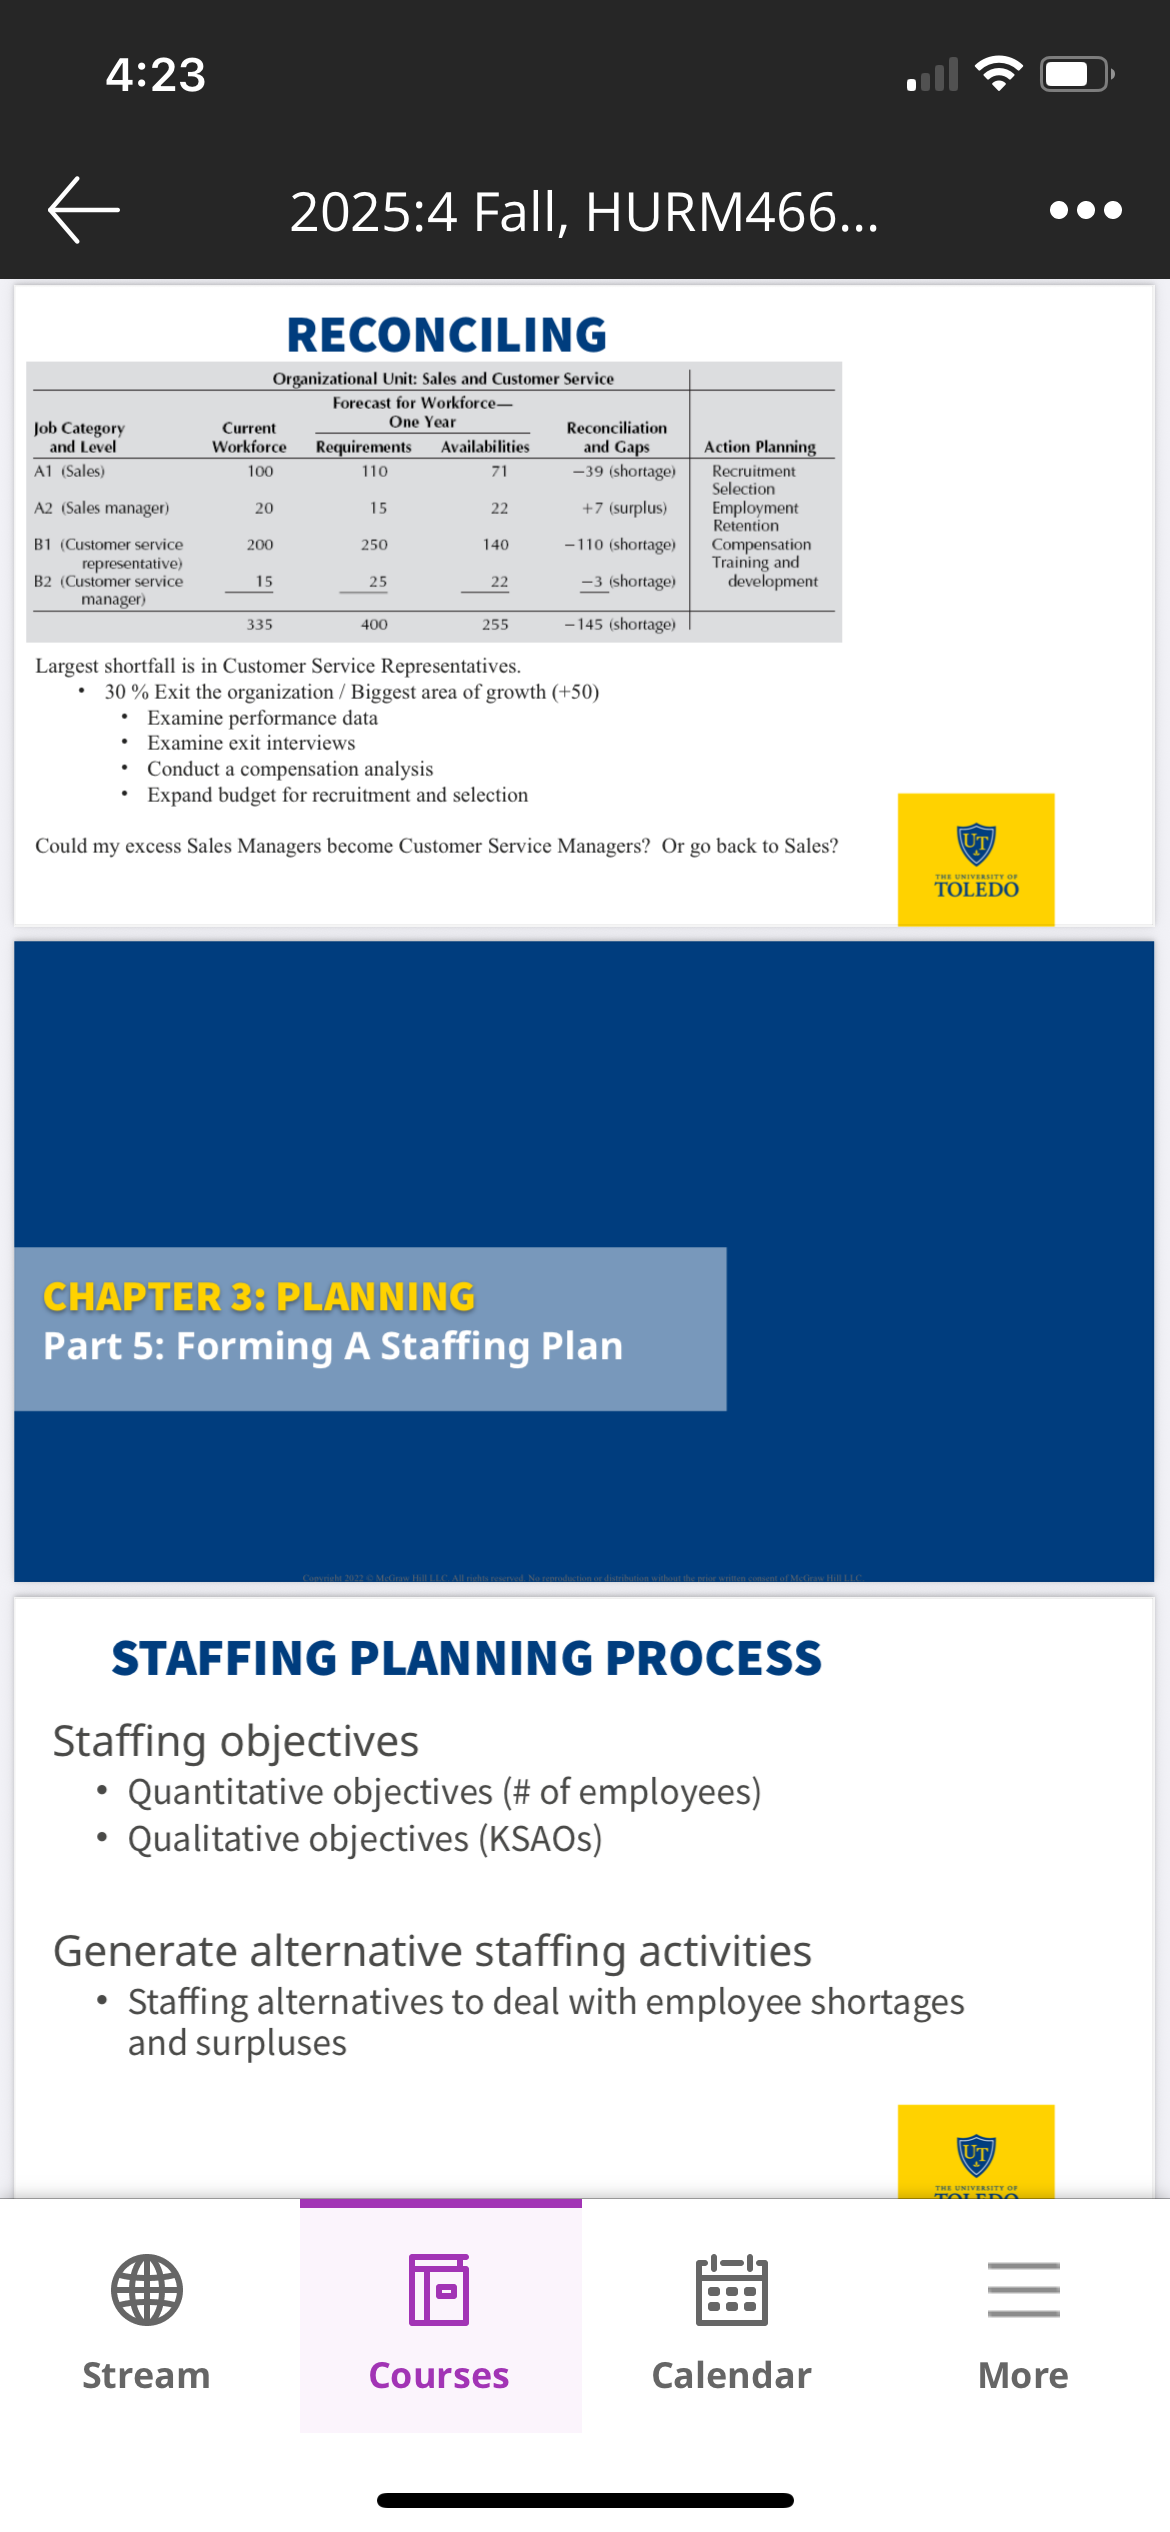
STAFFING PLANNING PROCESS
Staffing objectives
Quantitative objectives (# of employees)
Qualitative objectives (KSAOs)
Generate alternative staffing activities
• Staffing alternatives to deal with employee shortages and surpluses
FLEXIBLE WORKFORCE OPTIONS
Think of these options as a continuum.
More Permanent
Staffing firms provide employees to fill in as needed, Independent Contractors are a bit more stable, and then outsourcing completely removes the process from your organization by effectively partnering with another organization.
• We lose some degree of control when using a more flexible workforce
ECONOMIC CONSIDERATIONS
How do we add a price tag to our HRP?
Generally, we can rely on similar methods to those discussed previously
Regression to estimate cost of recruitment and selection efforts
May include additional time or personnel in HR in order to meet the additional demand such as hiring a dedicated recruiter.
Additional testing time and supplies for evaluating more candidates.
We may include training costs associated with new hires.
Benefits or retention efforts can be included too.
Depending on the nature of the flexible workforce arrangements, we may remove costs beyond those simply associated with recruiting and selecting a workforce.
SUCCESSION AND REPLACEMENT PLANNING
Identifying and tracking high-potential employees who can fill key positions when they become vacant.
Senior management regularly reviews leadership talent.
Ensures critical talent is available.
Provides development experience that managers must complete.
Helps attract and retain managerial employees.
"Works well in larger organizations that have a broad internal pool of talent to pull from.
succession plan allows
organizations to flag potential leaders early on in their careers and offer them appropriate developmental opportunities.
Succession Planning is NOT a substitute for Selection.
This should not be nepotism or favoritism.
It is not a guarantee that any individual will be promoted.
While talent retention is a likely outcome, that isn't the goal of Succession Planning.
A good succession plan serves as a roadmap for employee development and organizational stability.
It can play a critical role in organizing talent management.
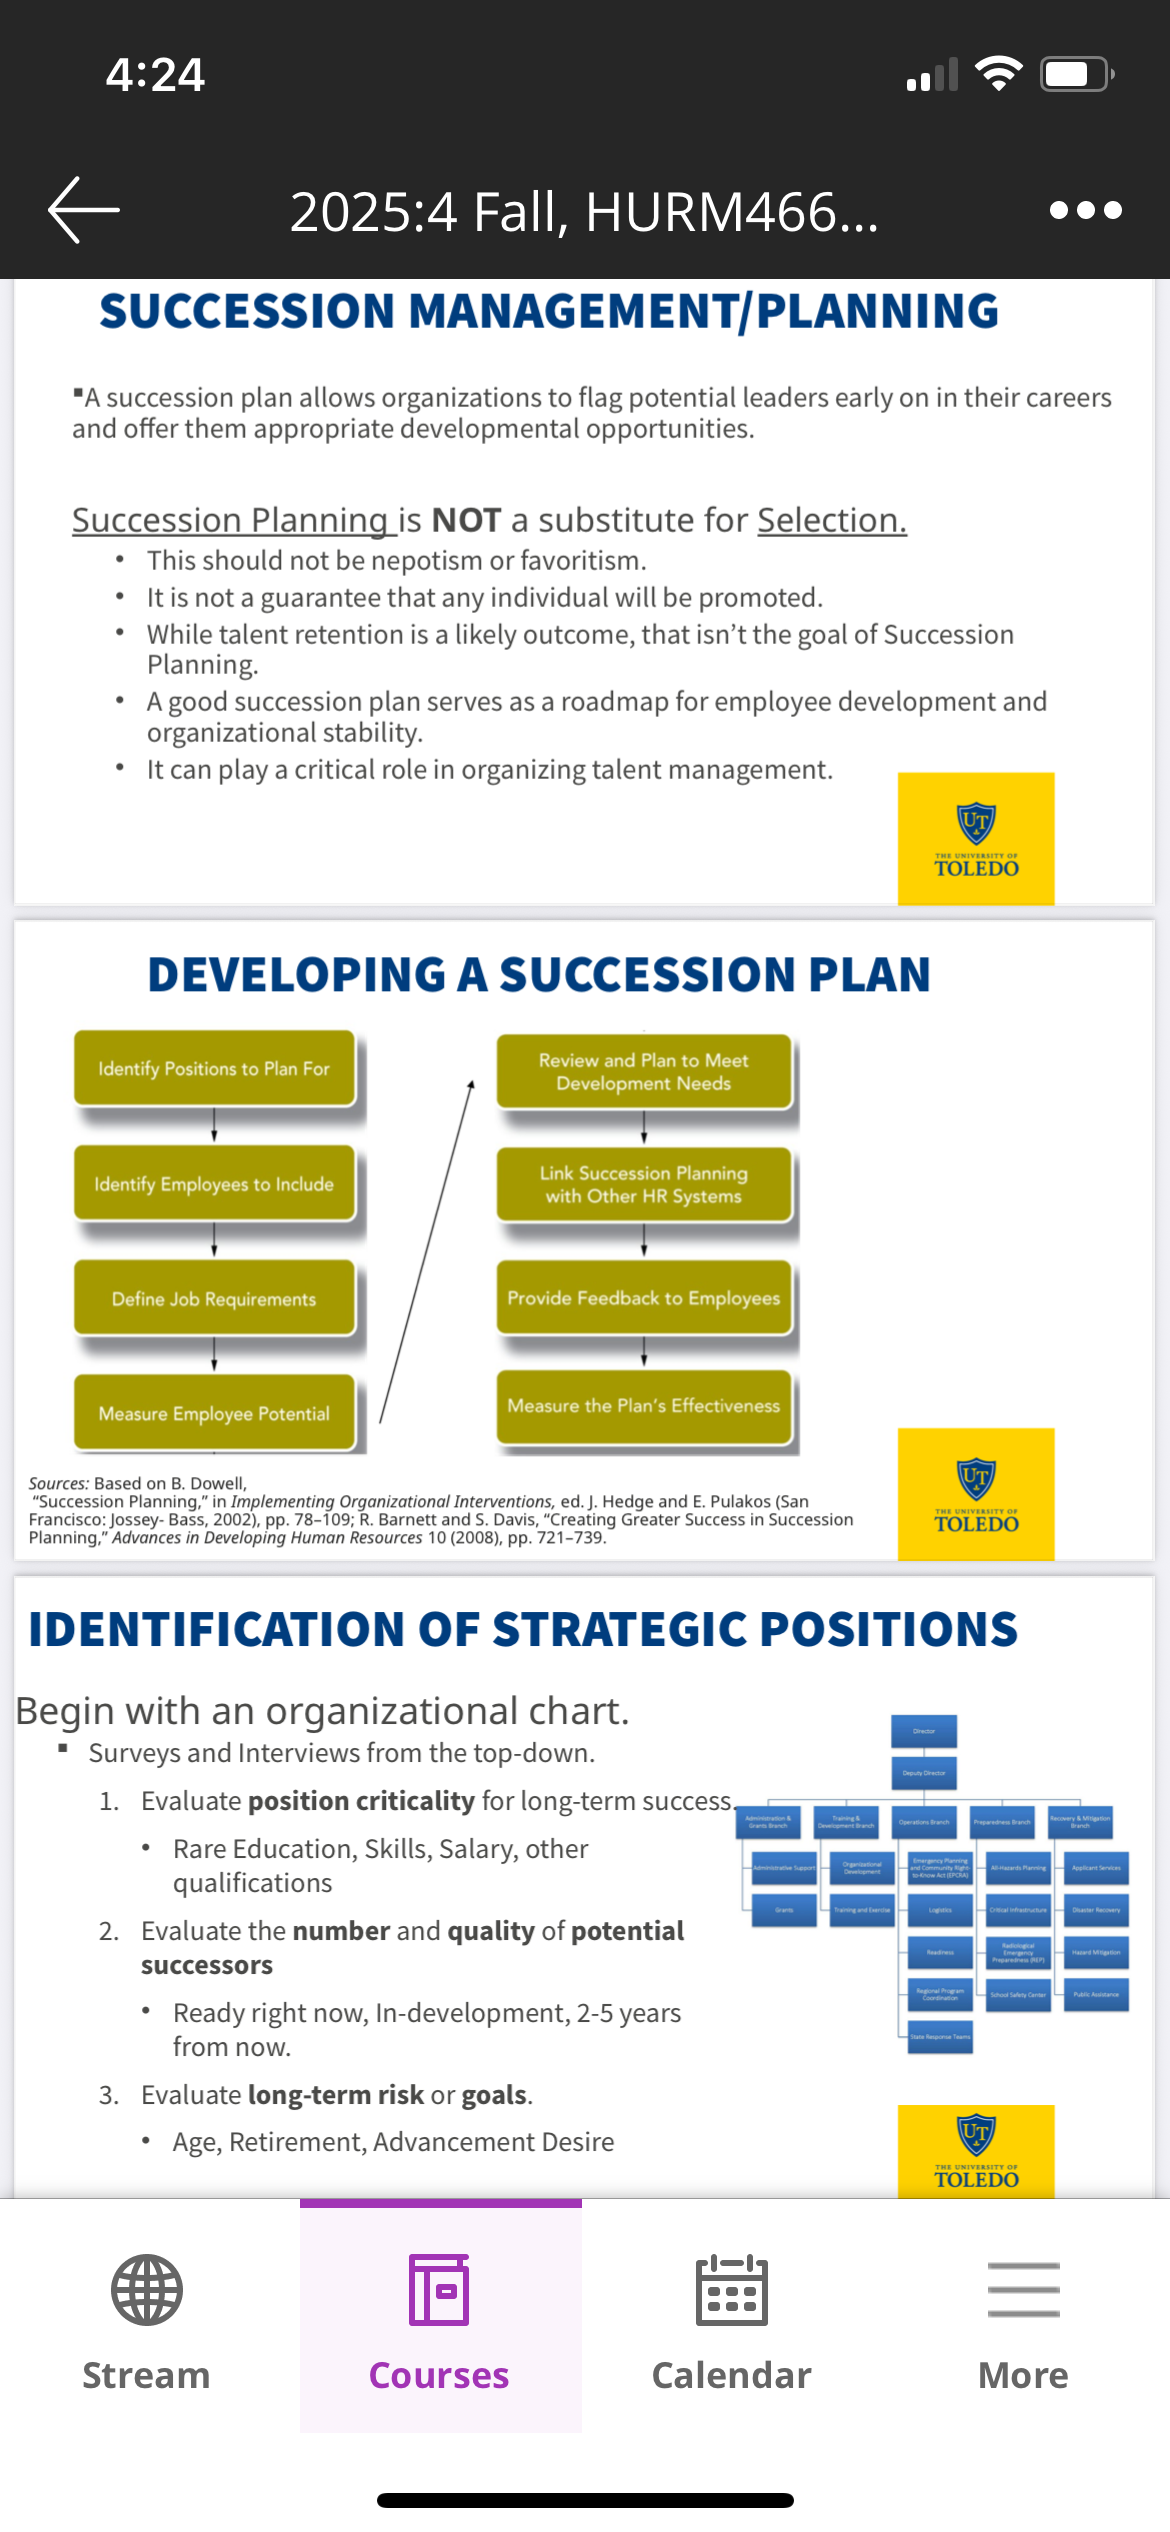
IDENTIFICATION OF STRATEGIC POSITIONS
Begin with an organizational chart.
• Surveys and Interviews from the top-down.
1. Evaluate position criticality for long-term success
• Rare Education, Skills, Salary, other qualifications
2. Evaluate the number and quality of potential successors
• Ready right now, In-development, 2-5 years from now.
3. Evaluate long-term risk or goals.
• Age, Retirement, Advancement Desire
1. Evaluate position criticality for long-term success
•
Rare Education, Skills, Salary, other qualifications
2. Evaluate the number and quality of potential successors
•
Ready right now, In-development, 2-5 years from now.
3. Evaluate long-term risk or goals.
• Age, Retirement, Advancement Desire
UTILIZATION STATISTICS
GUIDELINES FOR AFFIRMATIVE ACTION PLANS
GUIDELINES FOR AFFIRMATIVE ACTION PLANS
Purpose is remedying past discrimination.
Definite underutilization of women and/or minorities
Should not penalize majority group members
Should be eliminated once goals have been achieved
All candidates should be qualified
Include organizational enforcement mechanisms
This is another "hot button" issue in politics.Generally speaking, the results of these programs have been relatively unimpressive.
The unintended negative outcomes associated with Affirmative Action plans may outweigh the benefits.
E.g. stigma associated with candidates from minority groups being selected or promoted for high-level positions are seen as "undeserving".
DIVERSITY PLANNING
Recruiting implications
Advertise in a variety of media sources
Recruit at colleges and universities that have large numbers of individuals in underrepresented groups
Demonstrate diversity in recruiting materials
Selection techniques
Evaluate need for requirements that may eliminate a disproportionate number of underrepresented groups.
Focus on methods that minimize subjectivity
SO... YOU HAVE ADVERSE IMPACT. NOW WHAT?
Previously, Executive Order 11246 would require organizations to develop an "affirmative action" plan.
• Even if you don't legally meet the threshold of adverse impact (i.e.
4/5 rule) you may decide to set goals to more actively pursue diversity initiatives as described in chapter 2.
Recall that setting "quotas based on protected classes" is illegal.
The goal of an "affirmative action" plan was / is to develop a plan and set some goals around effective recruitment in order to address the issue.
SUCCESSION PLAN EXAMPLE
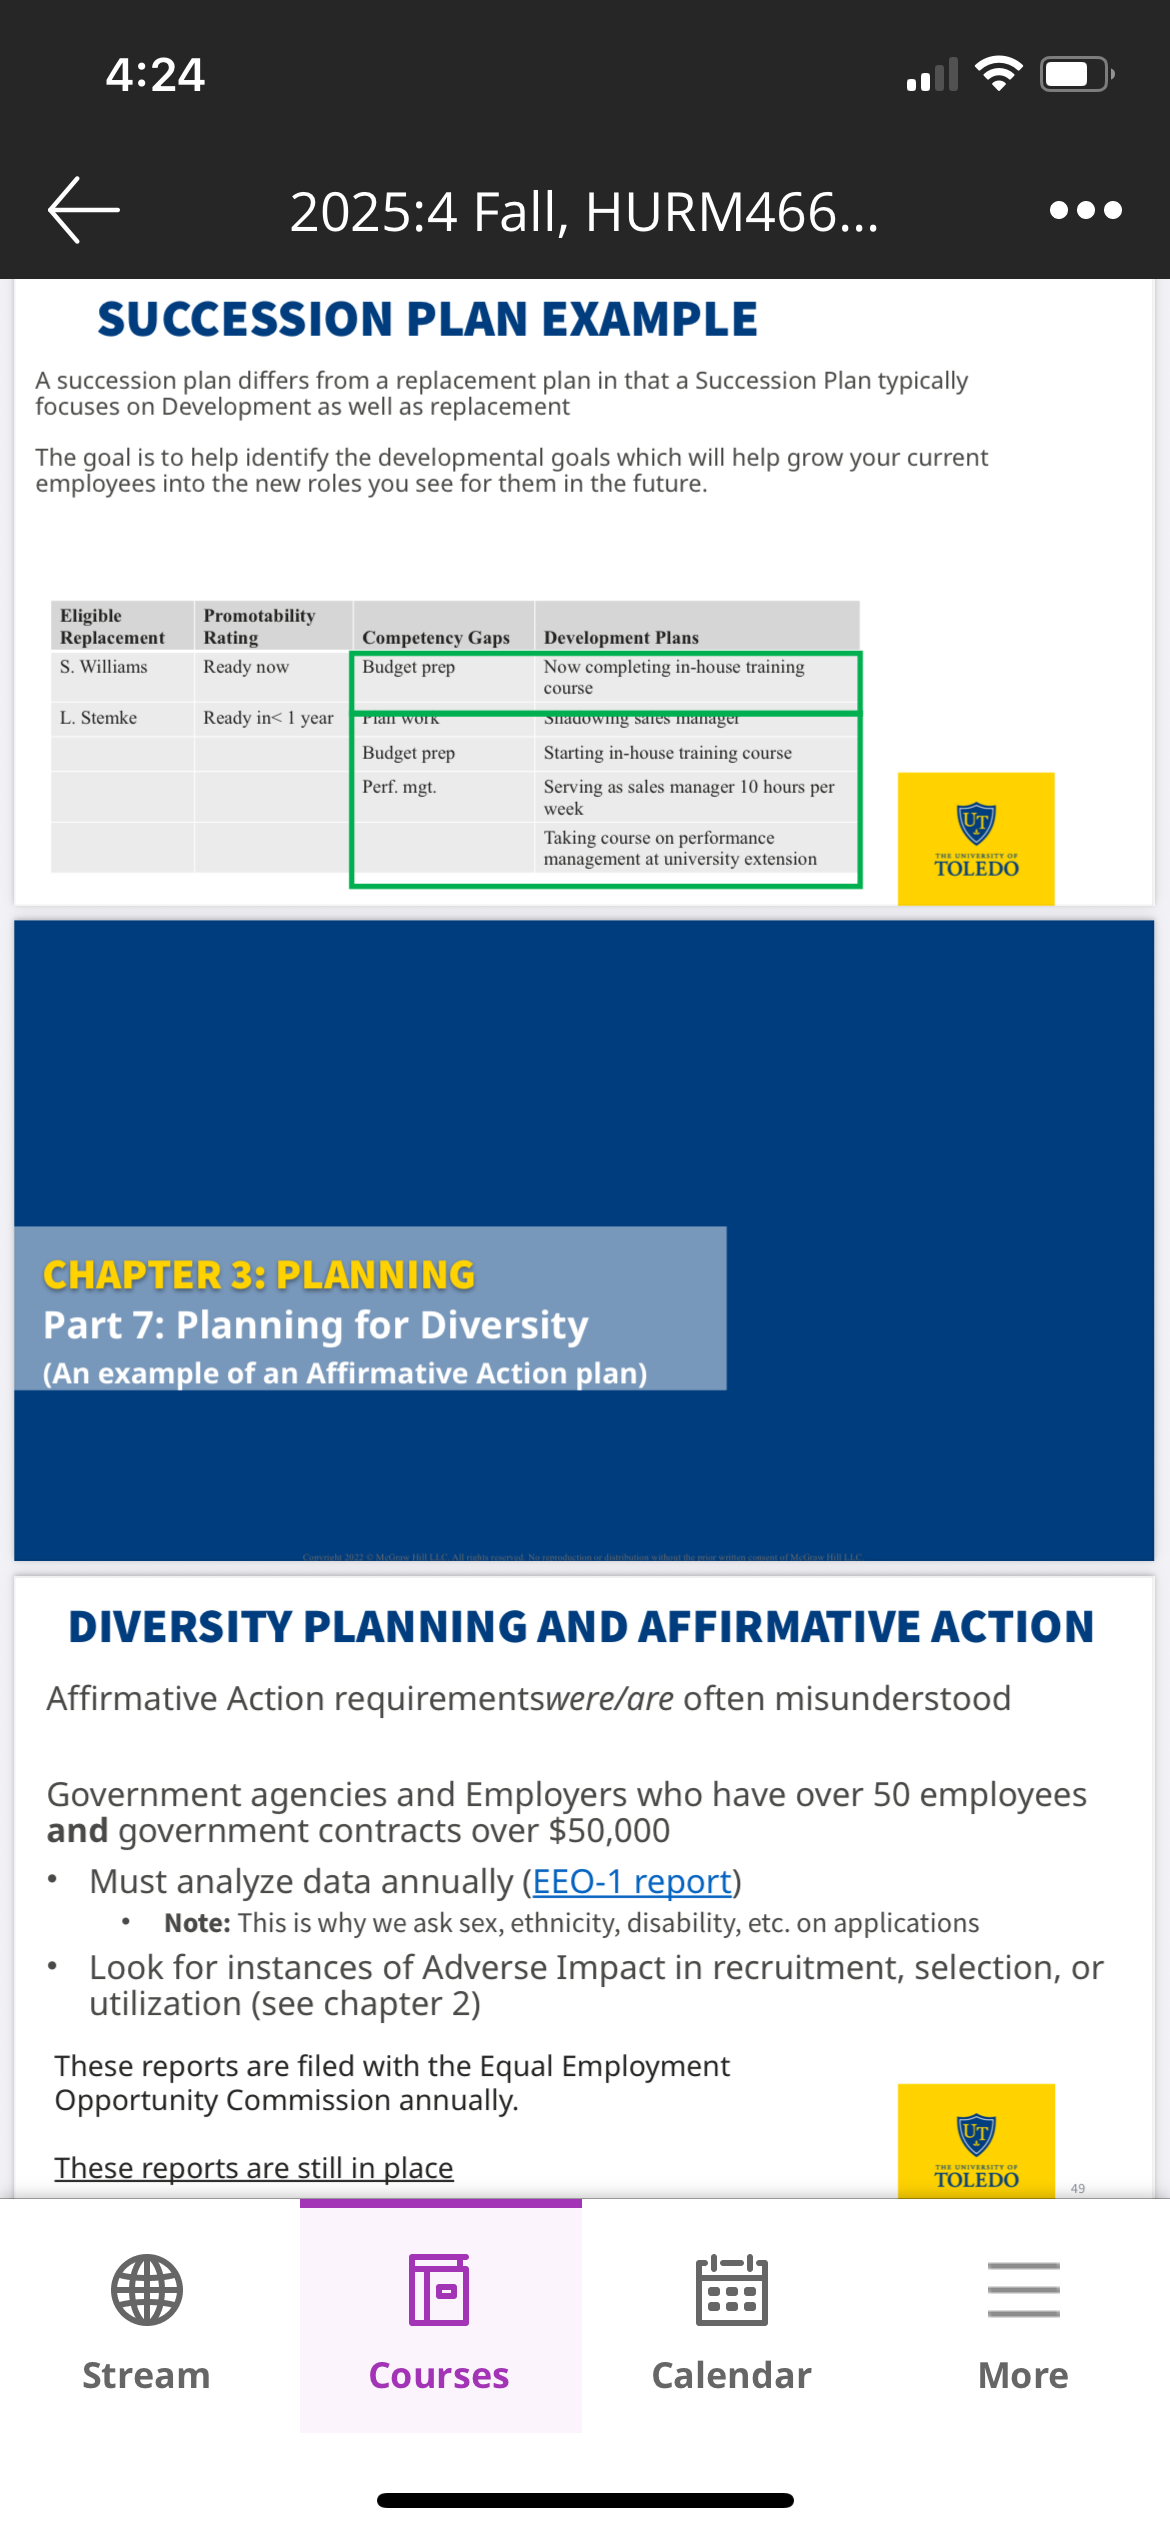
A succession plan differs from a replacement plan in that a Succession Plan typically focuses on Development as well as replacement
The goal is to help identify the developmental goals which will help grow your current employees into the new roles you see for them in the future.
REPLACEMENT CHART EXAMPLE

WHAT IS A NINE BOX?
A form of classification, commonly used for development activities.
Identification of those with the most to benefit from training and development
Helps to identify and retain top talent by providing potential career paths.
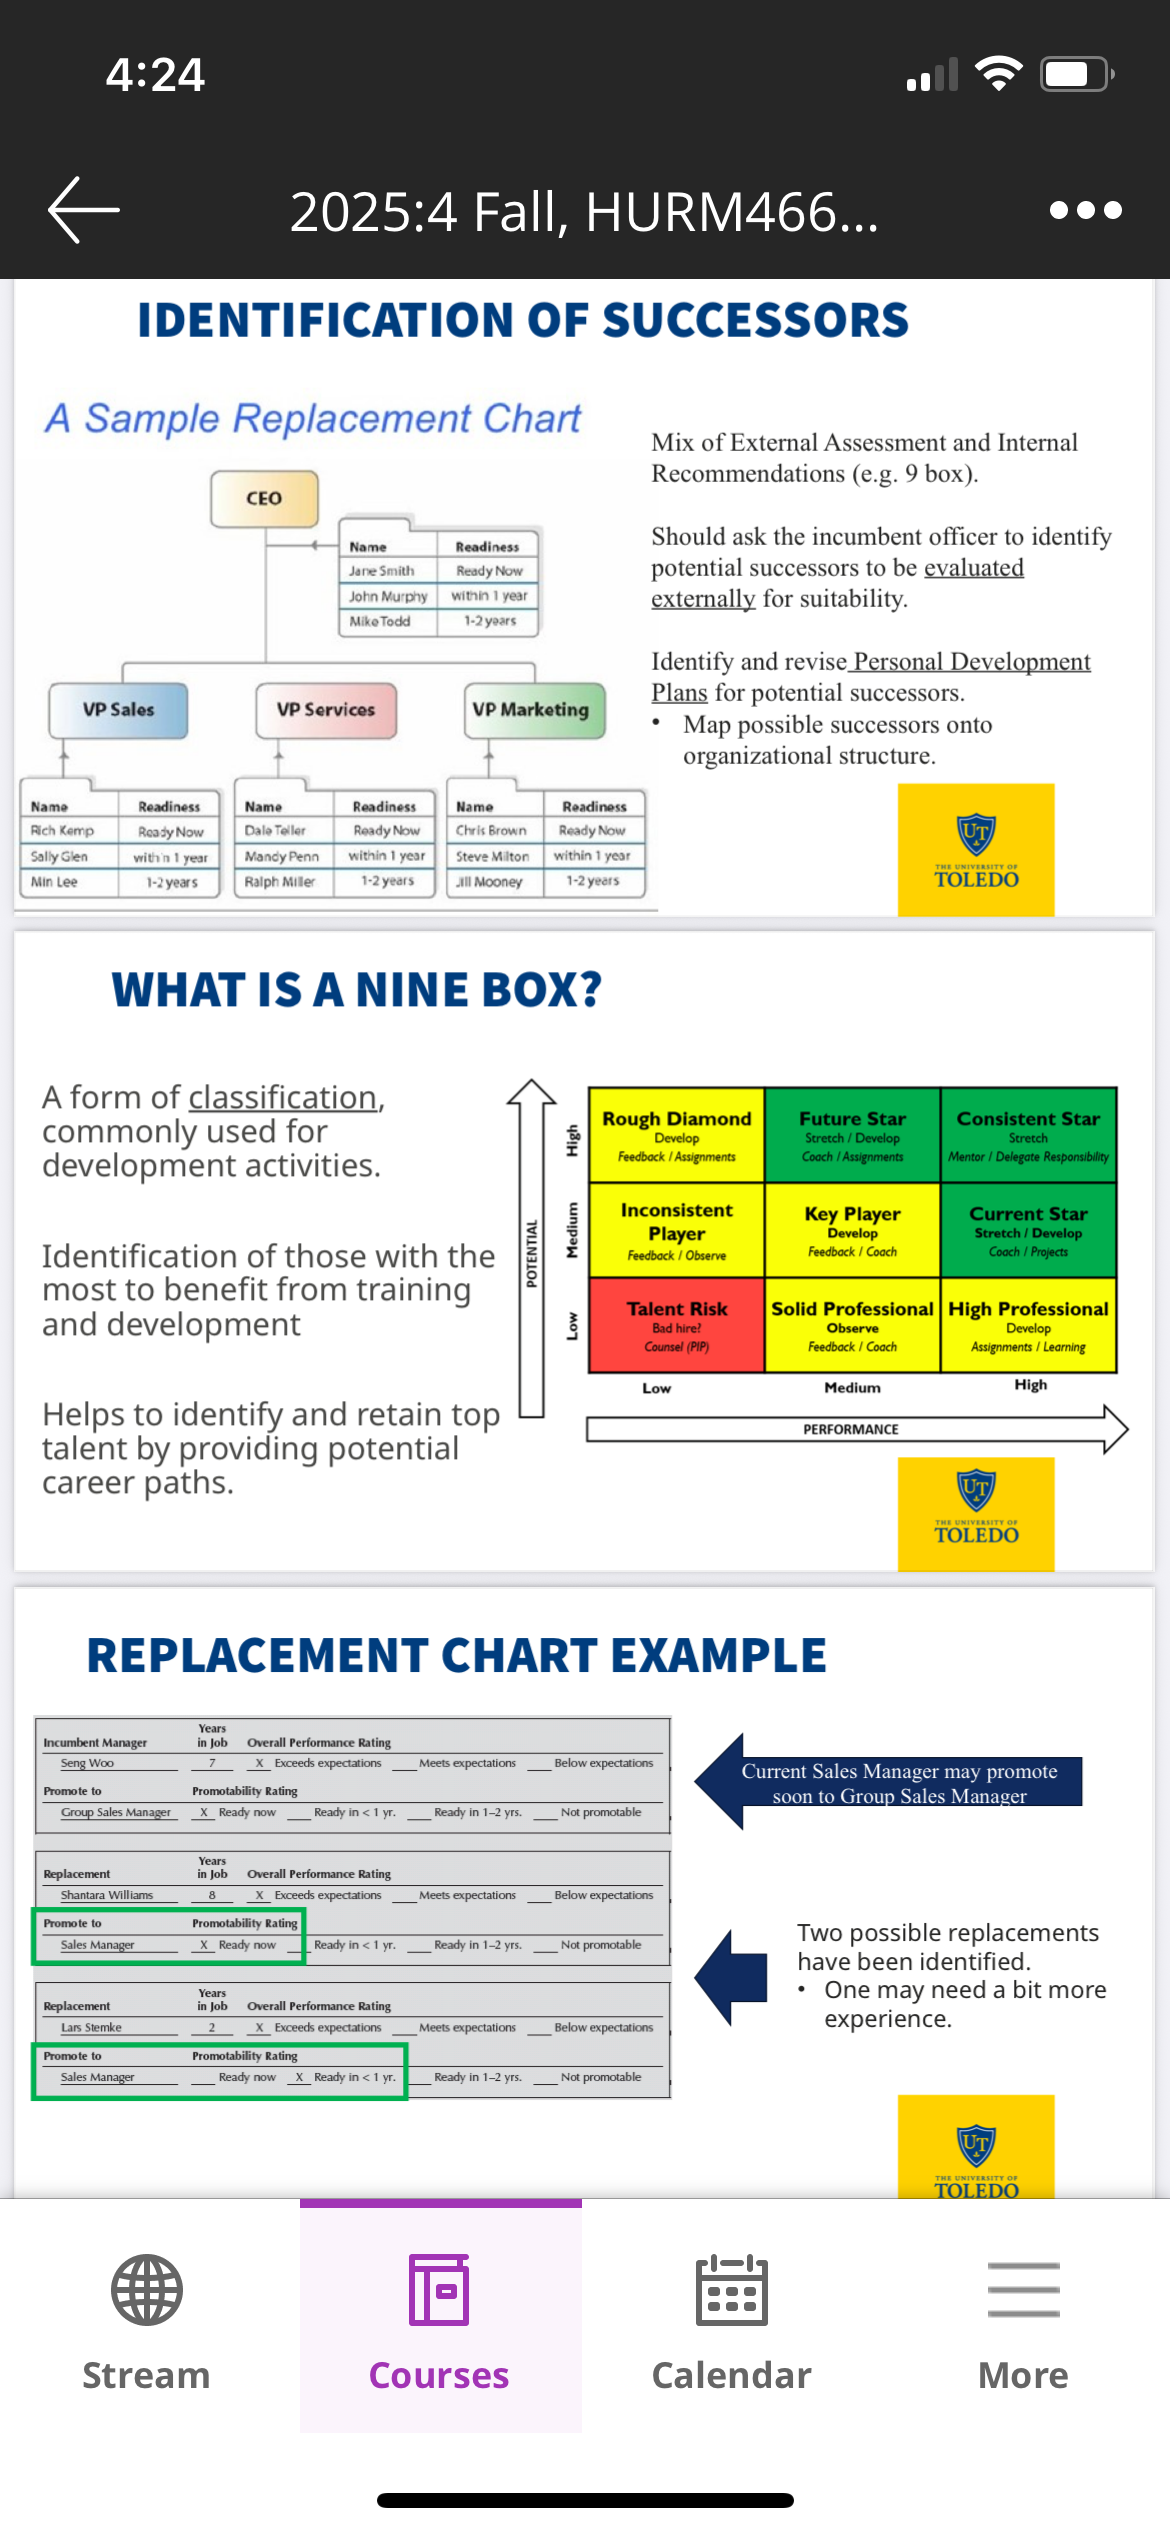
IDENTIFICATION OF SUCCESSORS
A Sample Replacement Chart
Mix of External Assessment and Internal
Recommendations (e.g. 9 box).
Should ask the incumbent officer to identify potential successors to be evaluated externally for suitability.
Identify and revise Personal Development
Plans for potential successors.
• Map possible successors onto organizational structure.

Core Workforce
Advantages:
Full-Time and Part-Time permanent employees
Stability
Continuity
Predictability
:49
Sense of commitment
Disadvantages:
Locked in the relationship
Reduced flexibility
Less inflow of new ideas
Flexible workforce advantages
Staffing Firms or Independent
Contractors
Flexible to address changing demands quickly
Quickly staff new areas
Fill in for core workers when absent
Flexible workforce Disadvantages
Lower Commitment
Lower Helping, Creative Suggestions or Extra effort
Potential for friction with core workers
Employee shortage Short term options
Subcontracting
Increase productivity
Increase overtime or part-time
Buy back vacation or holidays
Temporary assignmentsTemporary hires
Employee shortage Long term options
Hiring
Permanent
transfer into role
Recall of retired employees
Retraining
Outsourcing
Employee surplus Short term options
Hiring freeze
Retraining
Reduce workweek
Increase leave availability
Temporary reassignment
Temporary shutdown or layoff
Employee surplus’s long term options
Long-term hiring freeze
Permanent transfer out of role
Retirement incentives
Downsizing or long-term layoff