Chapter 18: Linking Interest Rates and Output Using IS-MP Analysis
1/116
There's no tags or description
Looks like no tags are added yet.
Name | Mastery | Learn | Test | Matching | Spaced | Call with Kai |
|---|
No analytics yet
Send a link to your students to track their progress
117 Terms
lower interest rates set by the Federal Reserve means mortgages and homes loans are more
affordable
the total amount of goods and services that people want to buy across the whole economy
aggregate expenditure
AE =
C + I + G + NX
Aggregate expenditure: C is
consumption
Aggregate expenditure: I is
planned investment
Aggregate expenditure: G is
government purchases
Aggregate expenditure: NX is
net exports
occurs when the quantity of output that suppliers collectively produce is equal to the quantity of output that buyers collectively want to purchase
macroeconomic equilibrium
total produce of output = aggregate expenditure
macroeconomic equilibrium
If output exceeds aggregate expenditure, businesses will (BLANK) their production
cut back
If output is less than aggregate expenditure, businesses will (BLANK) production
ramp up
adjustment in production push the economy toward the
macroeconomic equilibrium
if people purchase less than businesses produce managers respond by (BLANK) producing
cutting back
If aggregate expenditure is greater than production for a short while managers respond by (BLANK) production
ramping up
long-run analysis, focuses on the
supply side
long-run analysis explains the economy’s
potential output
in the short run, actual output may fail to meet
potential output
Why does in the short run, actual output may fail to meet potential output?
weak aggregate expenditure
What is wrong with in the short run, actual output exceeding potential output?
not sustainable
What makes actual output exceed potential output?
strong aggregate expenditure
actual output fluctuates around
potential output
focuses on the balance between short-run demand for output and long-run supply of output
output gap
when actual output equals potential output
just right
What factors drive fluctuations in actual output deviating from potential output?
demand-side
the level of output at the point of macroeconomic equilibrium
equilibrium output
equilibrium output can differ from
potential output
Equilibrium output is when
total production of output = aggregate expenditure
describes the economy’s resting point
equilibrium output
where Goldilocks wishes the economy would rest
potential output
the nominal interest rate adjusted for inflation
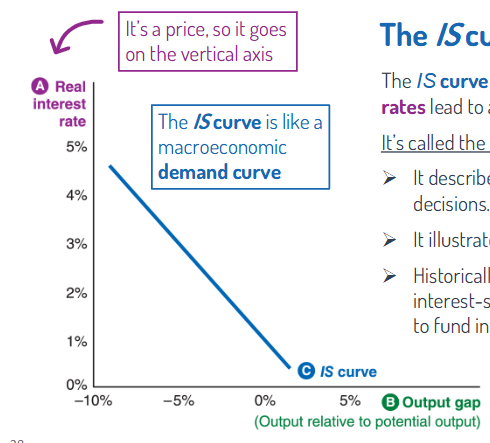
real interest rate
represents the opportunity cost of spending
real interest rate
the price that determines this year’s aggregate expenditure
real interest rate
If the federal reserve increases the interest rate
increased opportunity cost of spending, people spend less
If the federal reserve decreases the interest rate
decreased opportunity cost of spending, people spend more
Shows how total spending and output depend on the real interest rate
IS curve
illustrates the current real interest rate
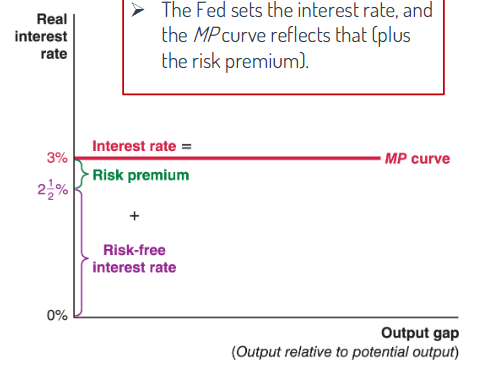
MP curve
dependent on both the federal reserve and financial markets
MP curve
lower interest rates boost
consumption, investment, government purchases, net exports
people substitute toward consumption and away from saving
lower real interest rate
lower interest rates lead to (BLANK) investment spending
more
reduce the interest payments the government must make on its debts
low interest rates
lower interest rates (BLANK) always spur government purchases. Sometimes use extra funds to pay down their existing debt instead
do not
low interest rates make the U.S. dollar cheaper, and this increases
net exports
leads foreign investors to demand fewer U.S. dollars, and U.S. investors to supply more U.S. dollars
low real interest rates
all together lower real interest rates yield higher
aggregate expenditure
lower real interest rates lead to
higher output and more positive output gap
illustrates how lower real interest rates lead to a more positive output gap
IS curve
describes investment and spending
IS curve
illustrates the interest sensitivity of output
IS curve
Draw the IS curve
y
lower real interest rates lead to
higher aggregate expenditure, output rises, more positive output gap
A change in the real interest rate leads to a (BLANK) the IS curve
movement along

If the real interest rate is 3% then
GDP is 5% below its potential level
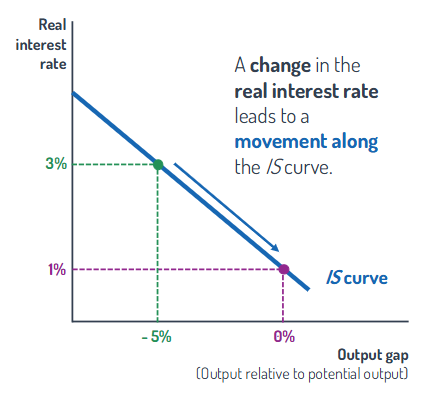
If the real interest rate falls to 1% then
GDP is at its potential level
changes in other factors that change aggregate expenditure at a given interest rate cause the IS curve to
shift
real interest rate =
risk-free real interest rate + risk premium
Is set by the federal reserve
risk-free real interest rate
the process of setting interest rates in an effort to influence economic conditions
monetary policy
The fed sets the nominal interest rate to influence the
real interest rate
Suppose inflation is 3%, and the Fed sets the nominal interest rate at 4.5%, then it’s also accurate to say it set the real interest rate at
1.5%
The Fed does (BLANK) set every interest rate in the economy?
not
The Federal Reserve effectively sets the
risk-free interest rate
the interest rate on a loan that involves no risk
risk-free interest rate
Is the reason why the interest rate you pay on your credit card, car loan, or business loan is typically higher than the risk-free interest rate set by the federal Reserve
risk premium
Why is a car loan less risky than a personal loan
bank can repossess the car
The buyers and sellers of risk meet on Wall Street to
trade risk
illustrates the current real interest rate
MP curve
MP stands for
monetary policy
MP curve shifts either because of the
Fed changing its monetary policy, changes in the risk premium
The MP curve reflects the
risk free interest rate + risk premium
Draw the MP curve
y
A higher (BLANK) signals greater risk in the banking system
TED spread
describes the output gap associated with each real interest rate
IS curve
where the IS curve and MP curve intersect
macroeconomic equilibrium
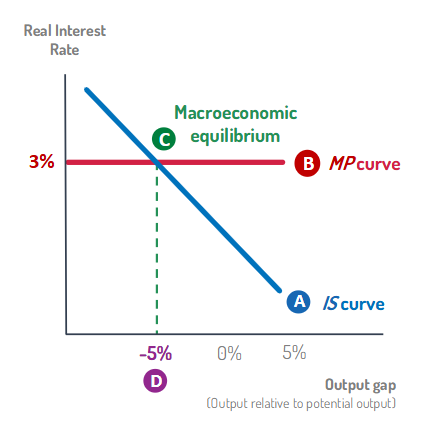
When the real interest rate is 3% then the
equilibrium output gap is -5%
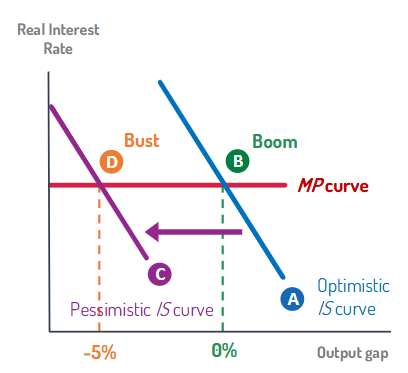
booms and busts of the business cycle reflect shifting periods of
strong and weak demand
describes spending plans when people are optimistic about their economic futures
optimistic IS curve
Optimistic IS curve leads to a boom where output is
at or above potential
When people become pessimistic about their economic futures and cutbacks occur
pessimistic IS curve
When there is a pessimistic IS curve the economic shifts to a bust and output is
less than potential output
Draw optimistic and pessimistic IS curves with an MP curve
y
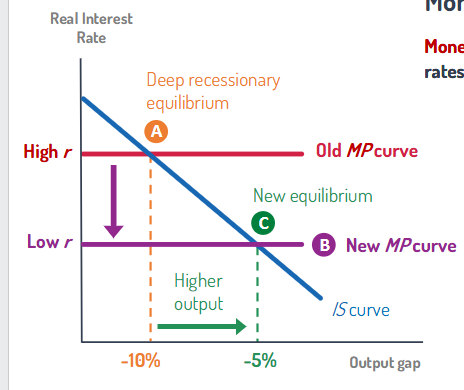
Keynes: The economy can in (BLANK) even when output is far below its potential and unemployment is widespread
macroeconomic equilibrium
Keynes: Unlikely to change form this “unhappy” spot unless the
government intervenes
Draw the shift from a deep recessionary equilibrium to a new equilibrium with higher output
y
the government’s use of spending and tax policies to influence economic outcomes
fiscal policy
Fiscal policy causes aggregate expenditure to change and shift the
IS curve
Increased government spending causes the IS curve to shift
right
When the IS curve shifts due to a change in government spending it shifts by
change in G x multiplier
A shift in the IS curve does not change the
interest rate
An increase in spending has a (BLANK) effect on aggregate expenditure
multiplied
a measure of how much GDP changes as a result of both the direct and indirect effects following from each extra dollar of spending
multiplier
An increase in spending has a multiplied effect due to (BLANK) effects throughout the economy
ripple
The IS curve shifts to reflect the new level of aggregate expenditure, accounting for both the (BLANK) of new spending and its (BLANK)
direct effect, ripple effects
IS curve: change in GDP =
change in spending x multiplier
The multiplier determines how far the IS curve
shifts
Multiplier = 2
Initial government spending = $150 billion
Generates a total of (BLANK) in additional spending
$300 billion
The state of the economy is determined by the intersections of the
IS and MP curves
spending shocks shift the
IS curve