MODULE 2: CAPITAL MARKET EXPECTATIONS, PART 2: FORECASTING ASSET CLASS RETURNS
1/20
There's no tags or description
Looks like no tags are added yet.
Name | Mastery | Learn | Test | Matching | Spaced |
|---|
No study sessions yet.
21 Terms
Three approaches to forecasting capital market expectations
Formal tools
Surveys: market expert opinions
Judgements: using qualitative data based on experience
Formal tools
Statistical methods: such as sample statistics, like sample mean, variance, and correlations. Apply shrinkage estimate to historical data, such as weighted average. Apply time series analysis as well based on lagged values of the variable.
Discounted cash flow model
Risk premium model: such as CAPM, factor model, and building blocks.
Risk premium (building block) approach (for forecasting bond returns)
this approach starts with a risk-free rate and then adds compensation for additional risks
The required return will include the one-period default-free rate, a term premium, a credit premium, and a liquidity premium
The Short Term Default Free Rate
matches the forecast horizon and uses the most liquid asset
As a result, it is closest to the government zero-coupon yield and is closely tied to the central bank policy rate.
Term Premium
There are four primary drivers of the term premium:
Inflation uncertainty: Higher inflation levels typically correspond to higher inflation uncertainty, causing nominal yields to rise and the term premium to increase.
Recession hedge: When inflation is caused by strong aggregate demand, nominal bond returns are negatively correlated with growth, corresponding to low term premiums. When inflation is caused by aggregate supply, nominal bond returns are positively correlated with growth, corresponding to higher term premiums.
Supply and demand: The relative supply of short- and long-term default-free bonds determines the slope of the yield curve, which influences the level of term premiums.
Business cycles: The slope of the yield curve and level of term premiums are also related to the business cycle.
Credit Premium
The credit premium compensates for the expected risk of default and is separate from the additional compensation for the expected level of default losses, both of which are components of the credit spread.
Liquidity Premium
Securities with the highest liquidity are the newest sovereign bond issues, current coupon mortgage-backed securities, and some high-quality corporate bonds. As a general rule, liquidity is higher for bonds that are (1) issued at close to par or market rates, (2) new, (3) large in size, (4) issued by a frequent and well-known issuer, (5) simple in structure, and (6) of high credit quality. An analyst could gauge the “true” liquidity premium by comparing the yield spread between the highest-quality issuer (usually the sovereign) and the next-highest-quality issuer. The analyst can then make adjustments to this spread as he moves further away from the features described previously.
LOS: Discuss risks faced by investors in emerging market fixed-income securities and the country risk analysis techniques used to evaluate emerging market economies.
Emerging market debt offers the investor high expected returns at the expense of higher risk. Many emerging countries are dependent on foreign borrowing, which can later create crisis situations in their economy, currency, and financial markets.
Many emerging countries also have unstable political and social systems. Their undiversified nature makes them susceptible to volatile capital flows and economic crises. The investor must carefully analyze the risk in these countries. For the bond investor, a significant risk is credit risk—does the country have the ability and willingness to pay back its debt? Economic, political, and legal risks are also important.
Signs that an emerging market is more susceptible to risk include:
Wealth concentration.
Income concentration and a less diverse tax base.
Greater dominance of cyclical industries, and including commodities and less pricing power.
Restrictions on capital flows and trade, and currency restrictions.
Inadequate fiscal and monetary policies.
Poor workforce education and infrastructure, and weak technological advancement.
Large amounts of foreign borrowing in foreign currencies.
Less developed and smaller financial markets.
Exposure to volatile capital flows.
Now coming to forecasting equity returns, what is equity risk premium?
The equity risk premium is generally defined as the amount by which the equity return exceeds the risk-free rate. An alternative way is to think about the equity premium as the amount by which the equity return exceeds the expected return on a default-free bond. Whereas the approach relative to the risk-free rate looks at a single premium for equity, the approach relative to bonds uses a building block approach.
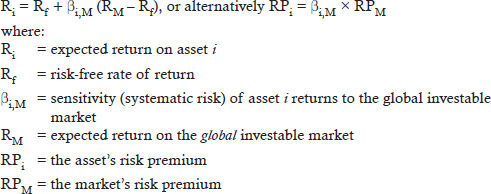
The Equilibrium Approach
The financial equilibrium approach assumes that financial models will value securities correctly. The Singer-Terhaar model is based on two versions of the international capital asset pricing model (CAPM): one in which global asset markets are fully integrated, and another in which markets are fully segmented. The model then looks at the expectations of actual segmentation/integration and takes a weighted average of the two assumptions to calculate returns. The Singer-Terhaar approach begins with the CAPM:
Think of the global investable market as consisting of all investable assets, traditional and alternative.
Emerging Market Equity Risk
Emerging markets are often characterized by fragile economies, political and policy instability, and weaker legal protections, including weak property rights as well as weak disclosure and enforcement standards. They tend to exhibit idiosyncratic risks where local country effects tend to be more important than global effects. Emerging markets tend to be less fully integrated than developed markets.
Forecasting Real Estate Returns
Unlike traditional asset classes (think equities, bonds, and cash or cash equivalents), real estate is generally immobile and illiquid, and each property is part of a heterogeneous group with its unique characteristics. Managing real estate also requires maintenance and, therefore, operating costs can be significant. Calculating returns is often done through appraisals, which are subject to time lags and data smoothing given that they are done infrequently, so appraised values may differ significantly from market values.
Business cycle effects on real estate
High-quality properties tend to fluctuate less with business cycles, while low-quality properties will show more cyclicality. When looking at real estate and business cycles, we observe the following characteristics:
Boom: Increased demand will drive up property values and lease rates, which induces construction activity. This higher activity translates to stronger economic activity.
Bust: Falling demand leads to overcapacity and overbuilding, driving values and lease rates down. Because leases lock in tenants for longer terms and moving costs are high, excess supply can’t be quickly absorbed.
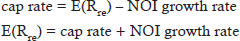
Capitalization Rates
The capitalization rate, or cap rate for short, is a commercial real estate property’s earnings yield, and is calculated by dividing current net operating income (NOI) by the property value. The cap rate is similar to the denominator of the Gordon growth model, looking at expected return less the NOI growth rate. When an infinite time period is assumed, the cap rate can be calculated as follows:
Risk of real estate
Real estate assets require several risk premiums to compensate for their higher risk. These include a term premium for holding long-term assets, a credit premium to compensate for the risk of tenant nonpayment, and an equity risk premium above corporate bond returns for the fluctuation in real estate values, leases, and vacancies. Overall, the combined risk premium is higher than that of corporate bonds but lower than equities.
Discuss major approaches to forecasting exchange rates.
Trade in goods and services affects exchange rates through (1) trade flows, (2) purchasing power parity, and (3) competitiveness and sustainability of the current account.
Discuss methods of forecasting volatility.
Estimating the variance for a single asset is relatively easy. Estimating variances for many assets is more complex, and requires the use of a variance-covariance (VCV) matrix or other forecasting tools.
Smoothed Returns to Estimate Volatility
Smoothing of data leads to underestimating risk and overstating returns and diversification benefits. Not adjusting for smoothing tends to lead to distorted portfolio analysis and suboptimal asset allocation decisions. As a result, it is important that analysts adjust the data for the impact of smoothing, by taking a weighted average of the current “true” returns and previously observed returns:

Recommend and justify changes in the component weights of a global investment portfolio based on trends and expected changes in macroeconomic factors.
Trend growth is generally favorable to equities because it implies long-term earnings growth. Trend growth is unfavorable to bonds because it typically results in higher interest rates. The analyst can use country-specific and global expectations through VCV matrices to adjust the allocations between equities and bonds.
As markets become more integrated globally, required returns will fall. We saw this relationship in the Singer-Terhaar model. The analyst should increase allocations toward emerging markets that are expected to see increased integration, and away from those markets that are already highly integrated.
When the economy is at the trough of the business cycle, equities perform well, and valuation ratios and earnings growth are expected to increase. The analyst could also use the Grinold-Kroner model to compute the required equity risk premium and increase the portfolio’s equity weights.
The analyst should focus less on monetary and fiscal policy activities, which are expected to be already reflected in asset values, but rather on structural changes in policy direction. For example, changes in the tax code or changes from standard interest rate targeting to other policies, including quantitative easing, can influence the direction of portfolio reallocation changes.
Current account balances fluctuate with business cycles. It is the long-term trend in current account balances that is more important in setting portfolio expectations. Rising current account deficits tend to be associated with rising required returns (and, therefore, falling asset prices), and increased capital flows to the deficit country to fund its deficit. Capital flows also influence currencies. If assets in a particular currency offer higher risk-adjusted return potential than in other currencies, capital will flow to that country and put upward pressure on its currency. The analyst will need to determine whether the currency still has potential to appreciate, or whether it is at its peak.