R&EH Exam 3
1/153
Earn XP
Description and Tags
make sure to draw out diagrams on cheat sheet.
Name | Mastery | Learn | Test | Matching | Spaced | Call with Kai |
|---|
No analytics yet
Send a link to your students to track their progress
154 Terms
what is a hypothesis?
a hypothesis is an educated guess about a relationship between variables.
It provides a clear, testable statement that can be examined using data.
it is the foundation of scientific research.
the role of hypothesis testing
hypothesis testing allows us to determine if observed results are due to chance or a real effect.
we compare the sample data to what we would expect if there were no real relationship (the null hypothesis).
helps ensure research findings are scientifically valid.
population
the entire group being studied (e.g., all college students in the U.S.).
sample
a subset of the population used for research (e.g., 200 randomly selected students).
sampling error
the difference between the sample statistics and the population parameters.
probability sample methods
simple random sampling
stratified random sampling
clustered sampling
systematic sampling
non probability sample methods
convenience sampling
snowball sampling
quota sampling
purposive or judgmental sampling
higher sampling error
less precise results
lower sampling error
more reliable conclusions
the importance of generalizability
generalizability = how well findings apply to a larger population.
a representative sample ensures accurate conclusions.
biased samples reduce research credibility.
what is the Null Hypothesis (H0)?
the null hypothesis (H0) states that there is no effect or relationship between variables.
it acts as the default assumption in research.
example:
“There is no difference in test scores between students who sleep 6 hours vs. 8 hours.”
examples of Null Hypotheses
“No difference between 9th and 12th graders on a memory test.”
“No relationship between reaction time and problem-solving ability.”
“No association between parental involvement and income.”
what is the Research Hypothesis (H1)?
the research hypothesis (H1) states that there is a relationship or effect.
it is the hypothesis researchers are trying to support with evidence.
there are two types of research hypotheses:
1. Directional
2. Nondirectional
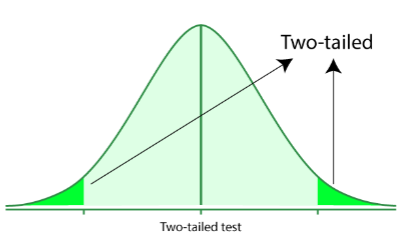
Nondirectional Research Hypotheses
reflect a difference, but the direction is not specified.
use a two-tailed test.
H1: X1 doesn’t equal X2
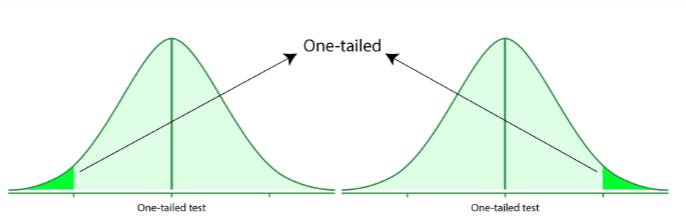
Directional Research Hypotheses
reflect a difference, and the direction is specified.
use the one-tailed test.
H1: X1> X2 or H1: X1<X2
Null Hypothesis
no relationship between variables
refers to the population
indirectly tested
written using Greek symbols
implied hypothesis
Research Hypotheses
relationship between variables
refers to the sample
directly tested
written using roman symbols
explicit hypothesis
good hypotheses should:
be stated in declarative form.
posit a relationship between variables.
reflect a theory or a body of literature on which they are based.
be brief and to the point and
be testable.
Why Probability?
the normal curve provides us with a basis of understanding the probability associated with any possible outcome.
basis for determining the degree of confidence that an outcome is “true”.
E.g., are changes in student scores due to a particular intervention that took place or by chance alone?
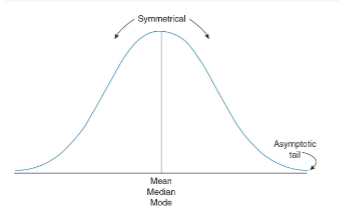
The Normal Curve
AKA the bell-shaped curve/
Visual representation of a distribution of scores.
Characteristics of Normal Curve:
Mean, median, and mode are equal to one another.
Perfectly symmetrical about the mean.
Tails are asymptotic (get closer to horizontal axis but never touch it).
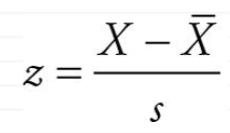
The z Score
a standard score
z is the z score
x is the individual score
x bar is the mean of the distribution.
s is the distribution’s standard deviation.
result of dividing the amount that a raw score differs from the mean of the distribution by the standard deviation.
The z Score
Scores below the mean are negative (left of the mean), and those above are positive (right of the mean).
A z score is the number of standard deviation the raw score is from the mean.
z scores across different distributions are comparable.
What z Scores Represent
the areas of the curve that are covered by different z scores:
encompassed by different values of standard deviation or z scores.
represents the probability of a certain score occurring.
what z Scores Really Represent
knowing the probability that a z score will occur can help you determine how extreme a z score you expect before determining that a factor other than chance produced the outcome.
Hypothesis Testing and z Scores
any event can have a probability associated with it.
Probability values help determine how “unlikely” the event might be.
The key is that something has less than 5% chance of occurring, and you have a significant result.
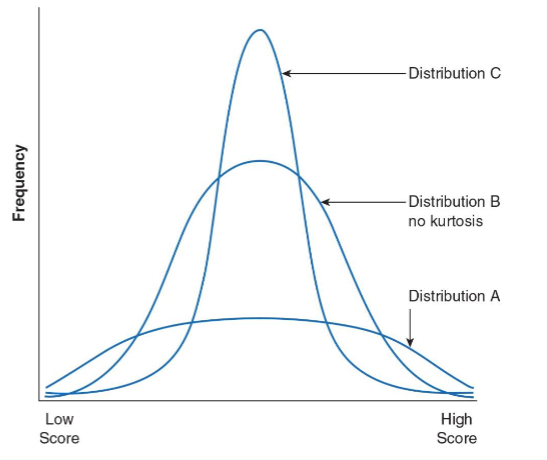
Fat and Skinny Frequency Distributions
Average value
Variability
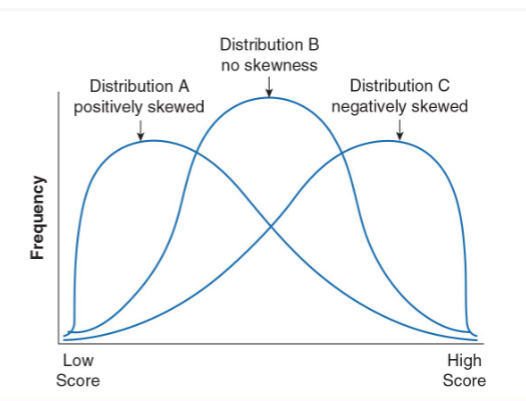
Skewness
Kurtosis
Variability
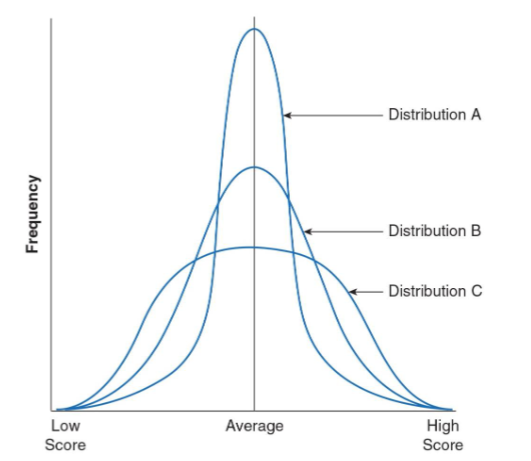
Skewness
Kurtosis