BUSS1040 Lecture 5 - Perfectly Competitive Markets
1/28
There's no tags or description
Looks like no tags are added yet.
Name | Mastery | Learn | Test | Matching | Spaced | Call with Kai |
|---|
No analytics yet
Send a link to your students to track their progress
29 Terms
Characteristics of a market
Concentration
number & size distribution of firms in market and market share
high concen - small no. of firms control large market share (telecomm, power)
low concen - large no. of firm and no firms have market power (food)
Product differentiation
physical/subjective diffs in consumers minds between rival firm products
feature of a prod that sets it apart from other similar prods
homogenous vs differentiated products
Barriers to entry
how difficult for new firm to enter market and compete w existing firms
legal barriers (govt reg, patent rights etc)
nature (technical, costs, financial)
Characteristics - Perfect comp
large no of buyers and sellers
single seller has no impact on p by either prod more or less
homogenous prod
each sellers prod is identical to its competitiors
low barriers
freedom of entry and exits by firms
perfect info
p and quality of prod assumed to be known to all consu and prod
perfect mobility of FOPs
price takers
indv firms take the market price as given — cant exert influence on p
Basic market structures - Monopolistic comp
many sellers (low concen)
differentiated prods
some barriers
Basic market structures - Oligopoly
few sellers (high concen)
homogenous or differentiated
high barriers
Basic market structures - Monopoly
one seller
unique; no close substitute
high barriers/blocked
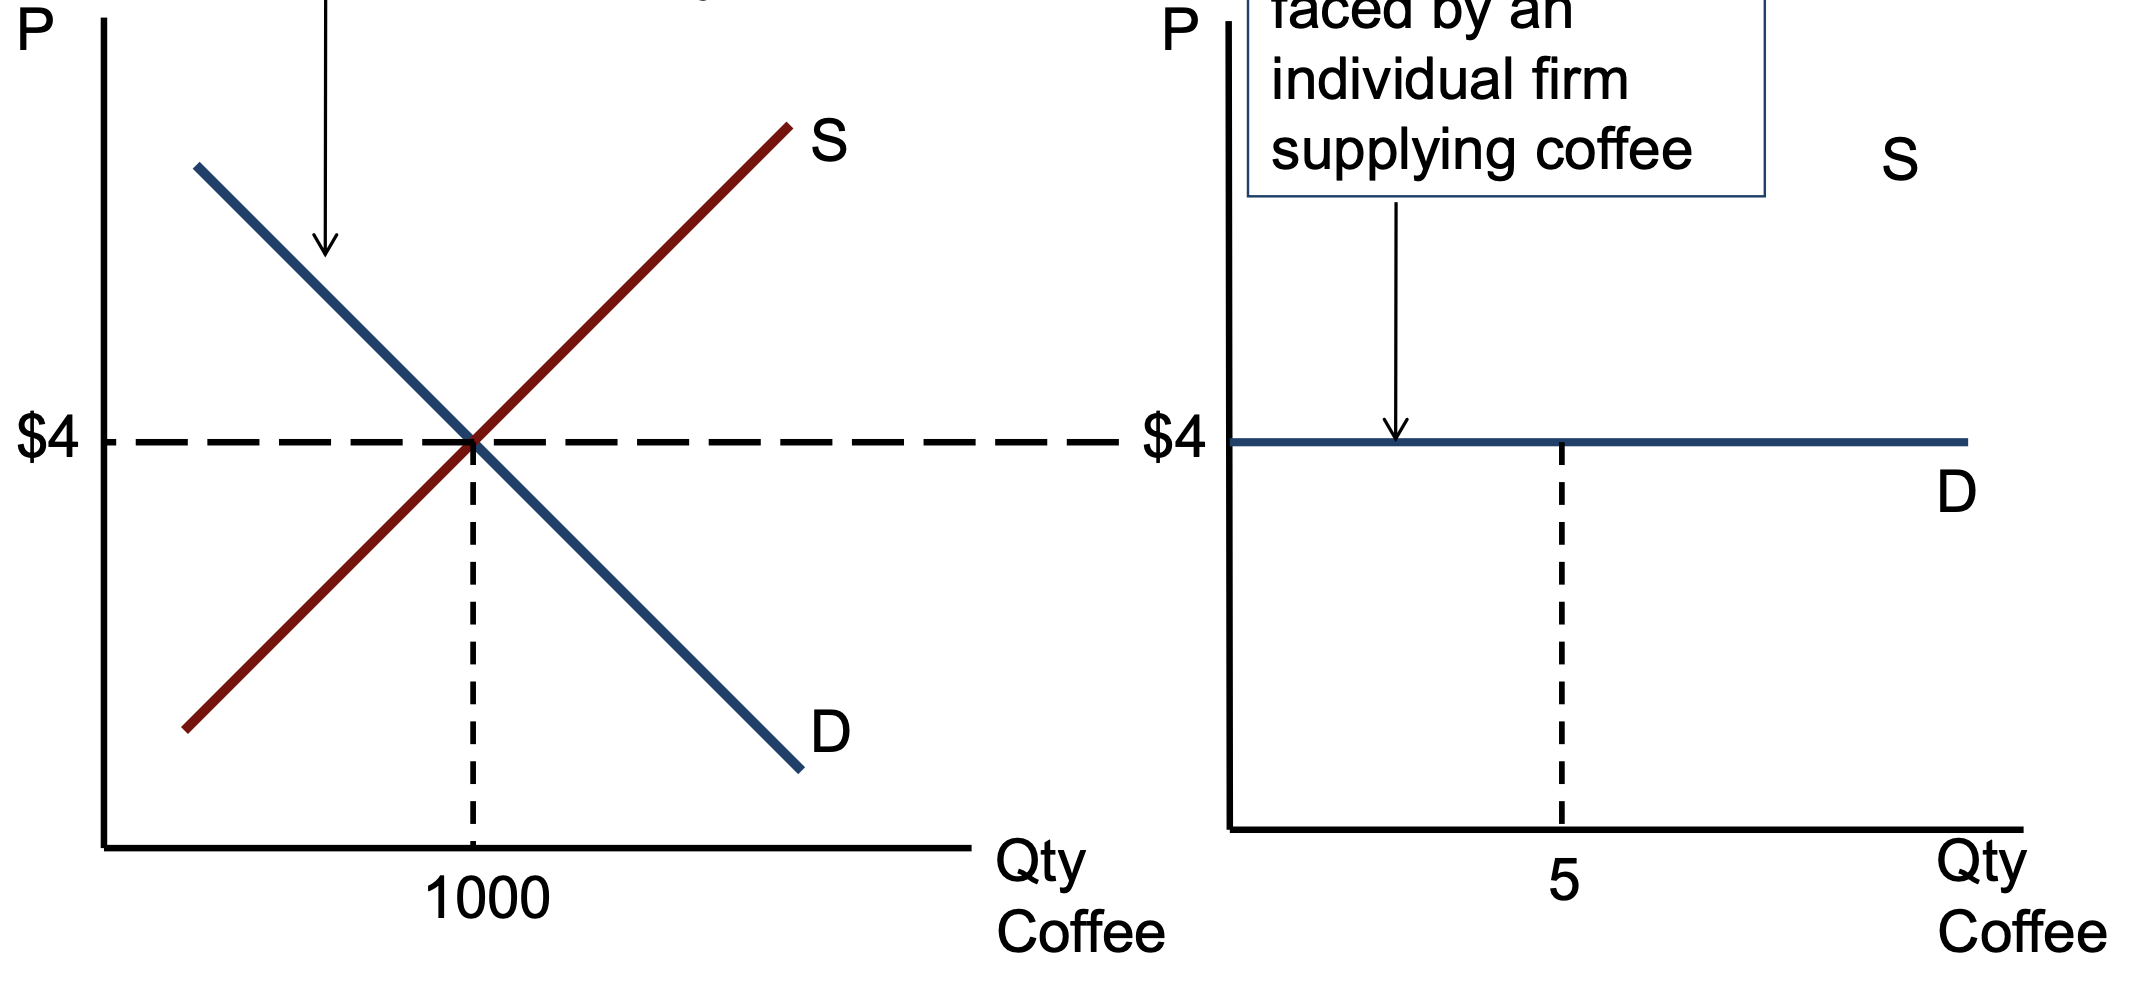
Market D curve vs D curve for firm (coffee supplier)
Profit
Profit = TR - TC
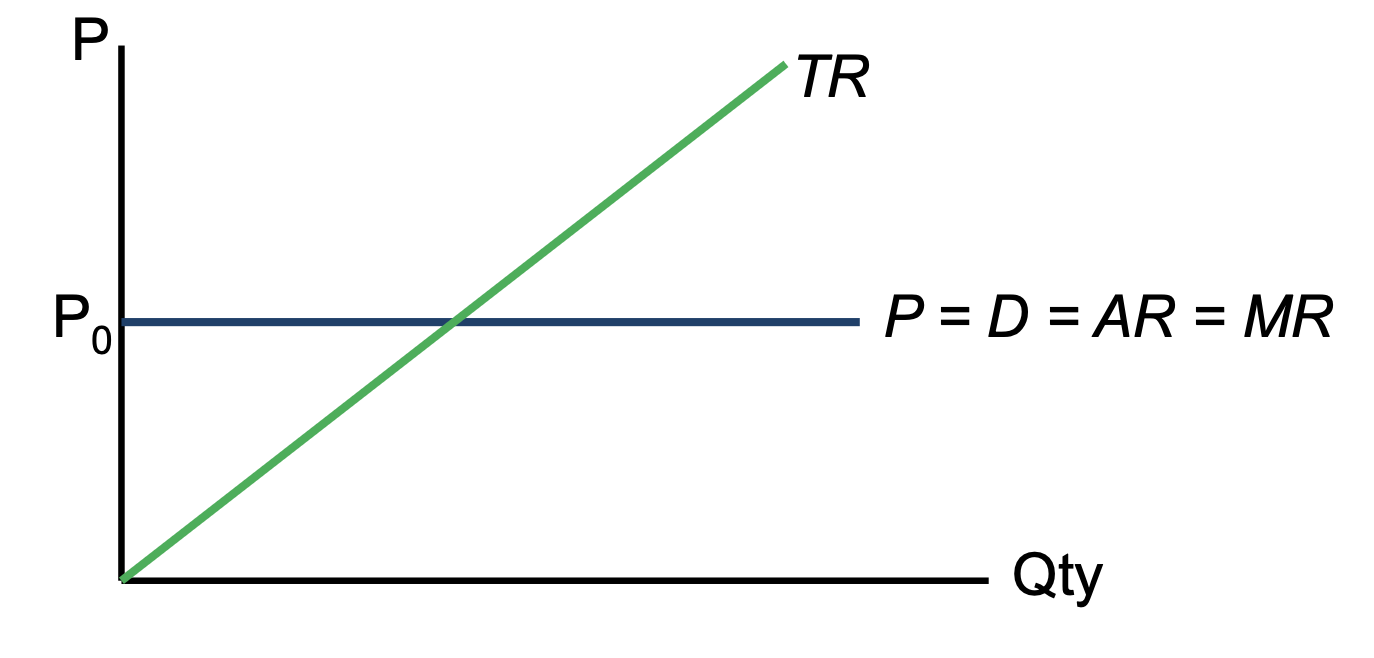
TR
TR = P x Q
Average Rev
AR = TR/Q = (P x Q)/Q = P
Marginal Rev
MR = △TR/△Q
Perfect Comp D Curve
MR = △TR/△Q = (P x △Q)/△Q = P
Therefore, P = D = AR = MR
Firms Cost formulas
TC, AFC, AVC, ATC, MC
TC = TFC + TVC
AFC = TFC/Q
AVC = TVC/Q
ATC = TC/Q
MC = △TC/△Q
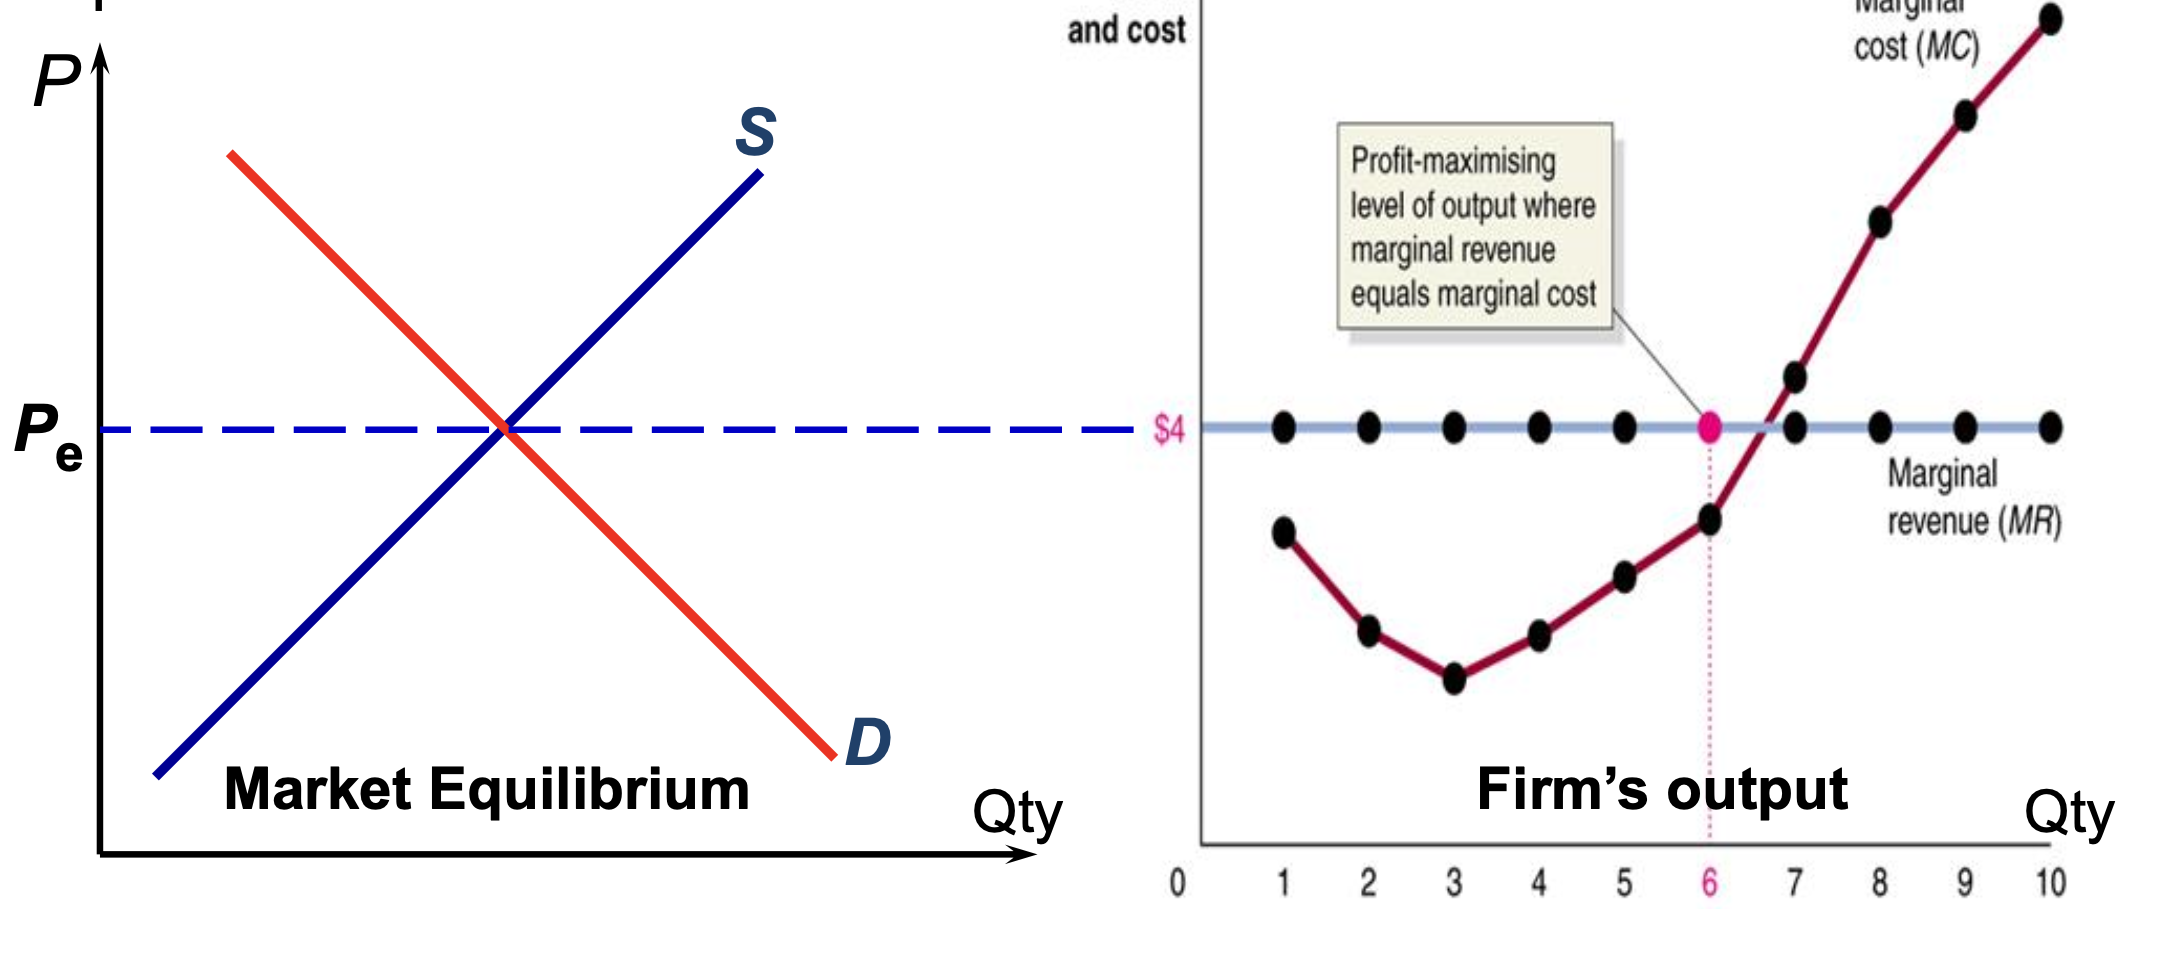
Profit Max
Profit max occurs when MR = MC and MC cuts MR curve from below
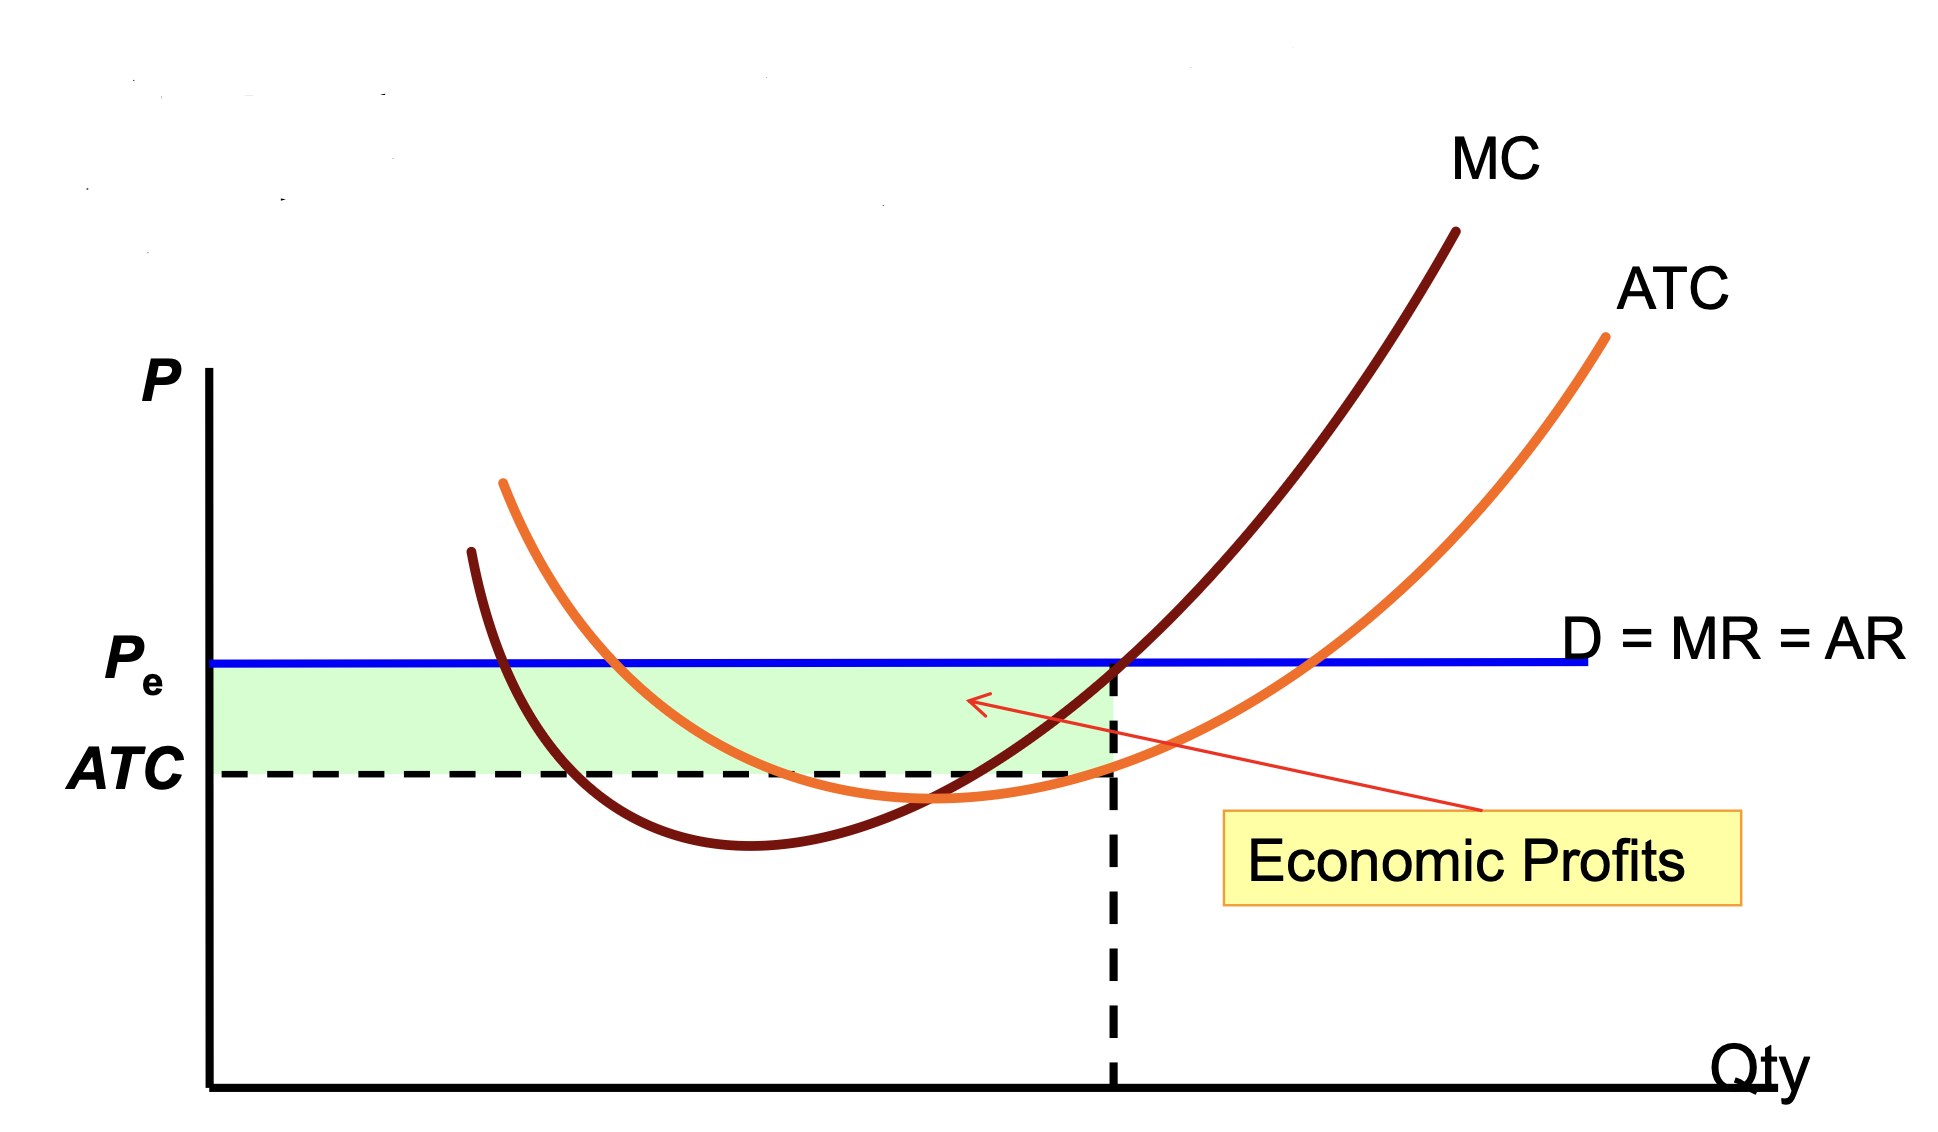
Economic Profits SR
Profit = (P-ATC) x Q
Econ profits
TR>TC or Profit>0
when P>ATC
Remember — TC = explicit costs + implicit costs
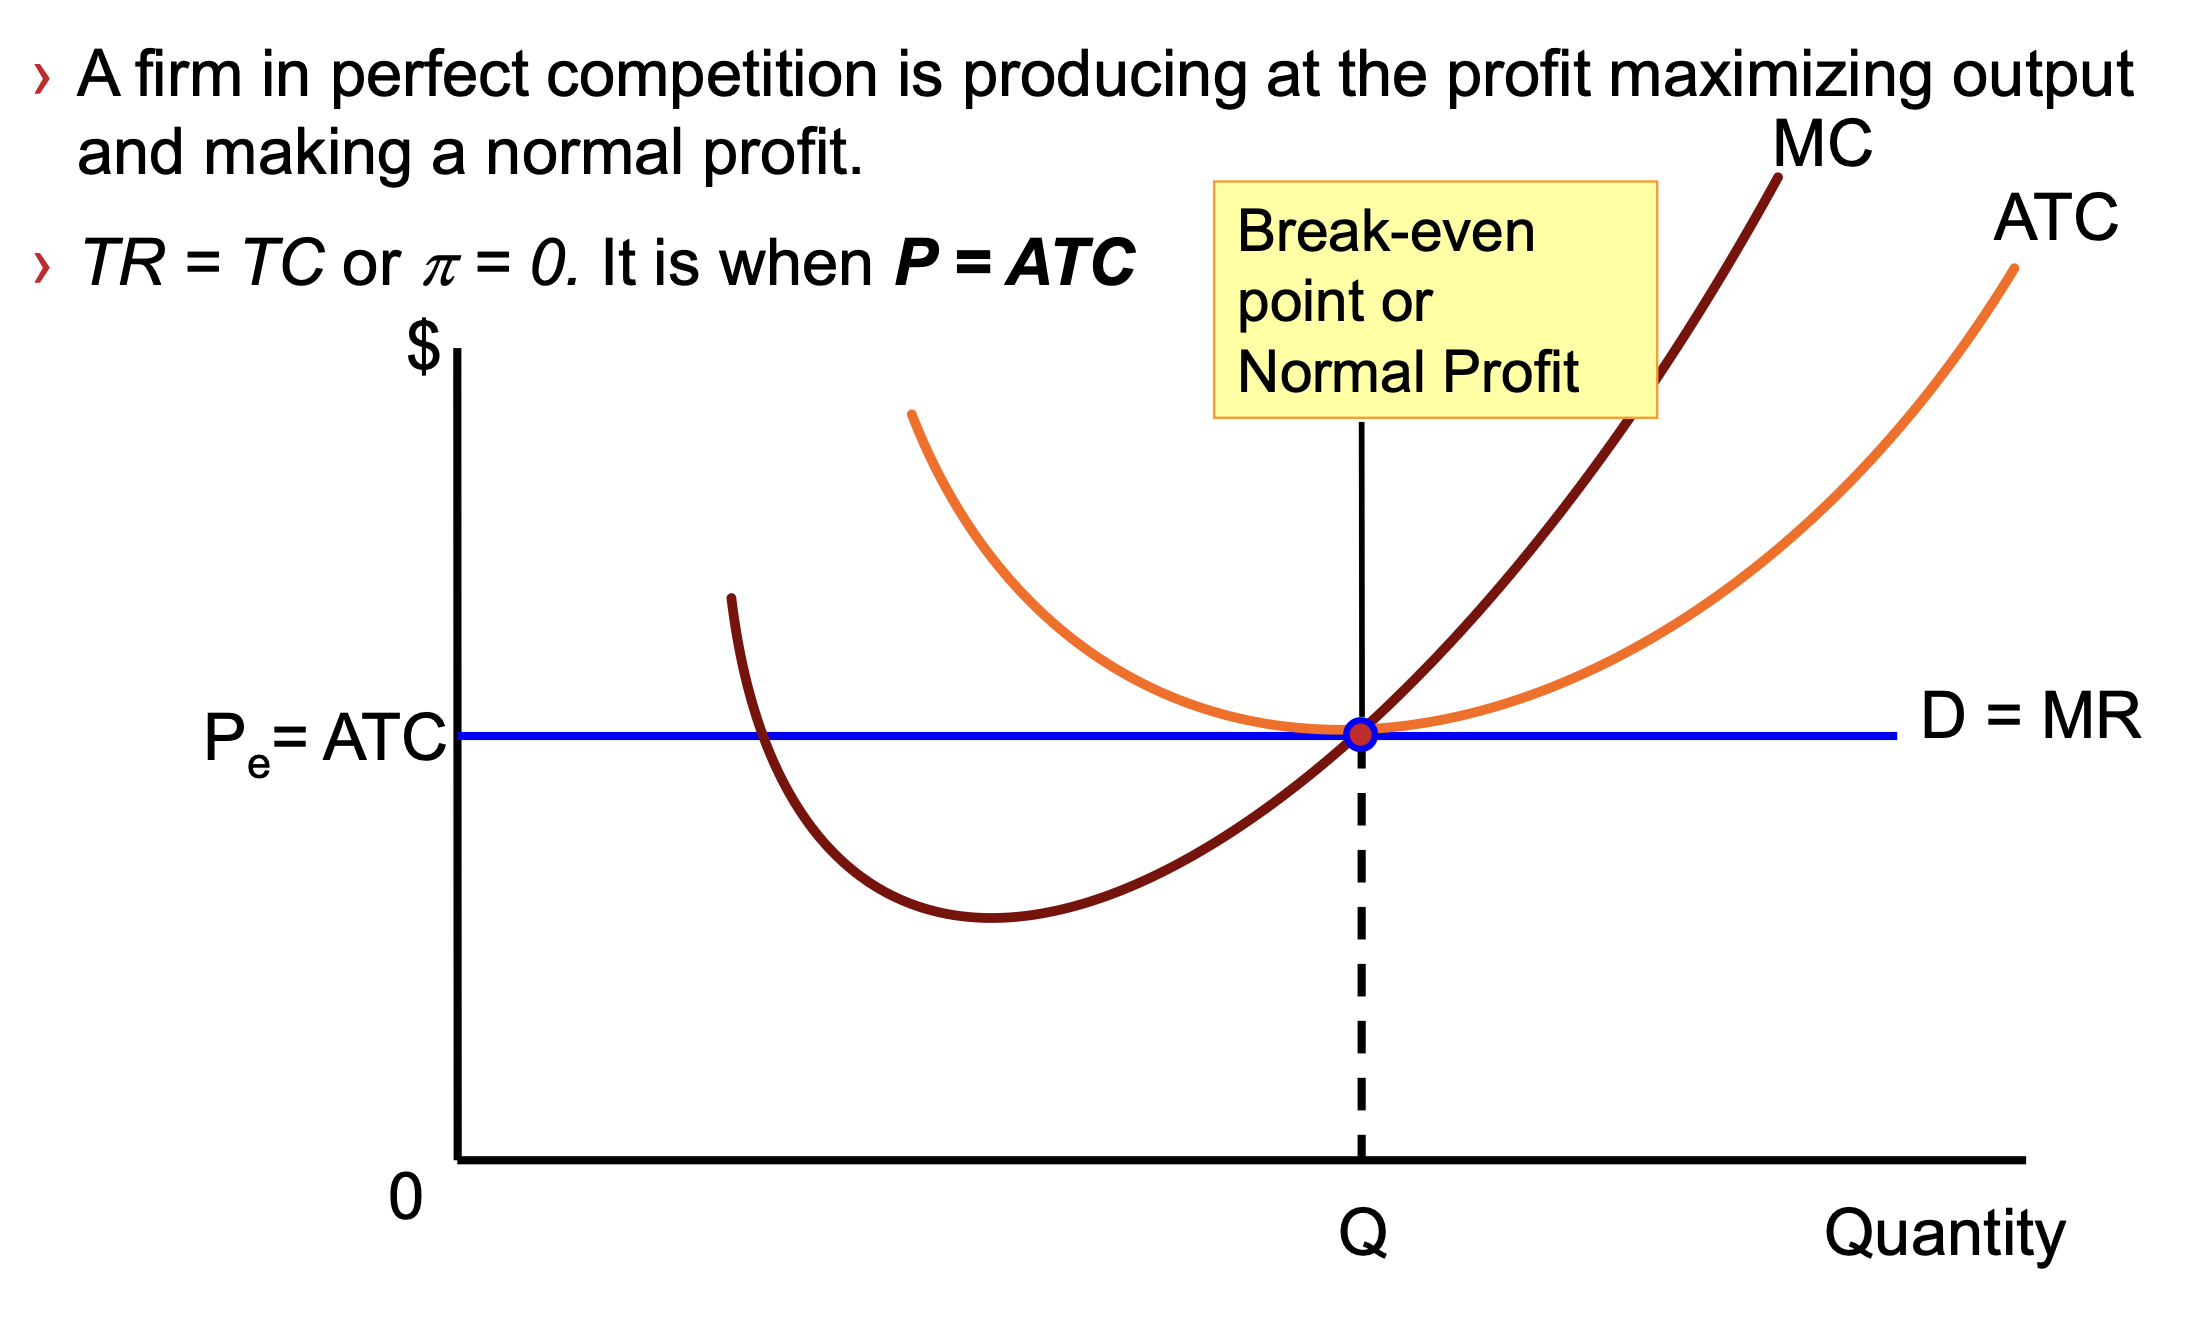
Break-even/Normal Profit SR
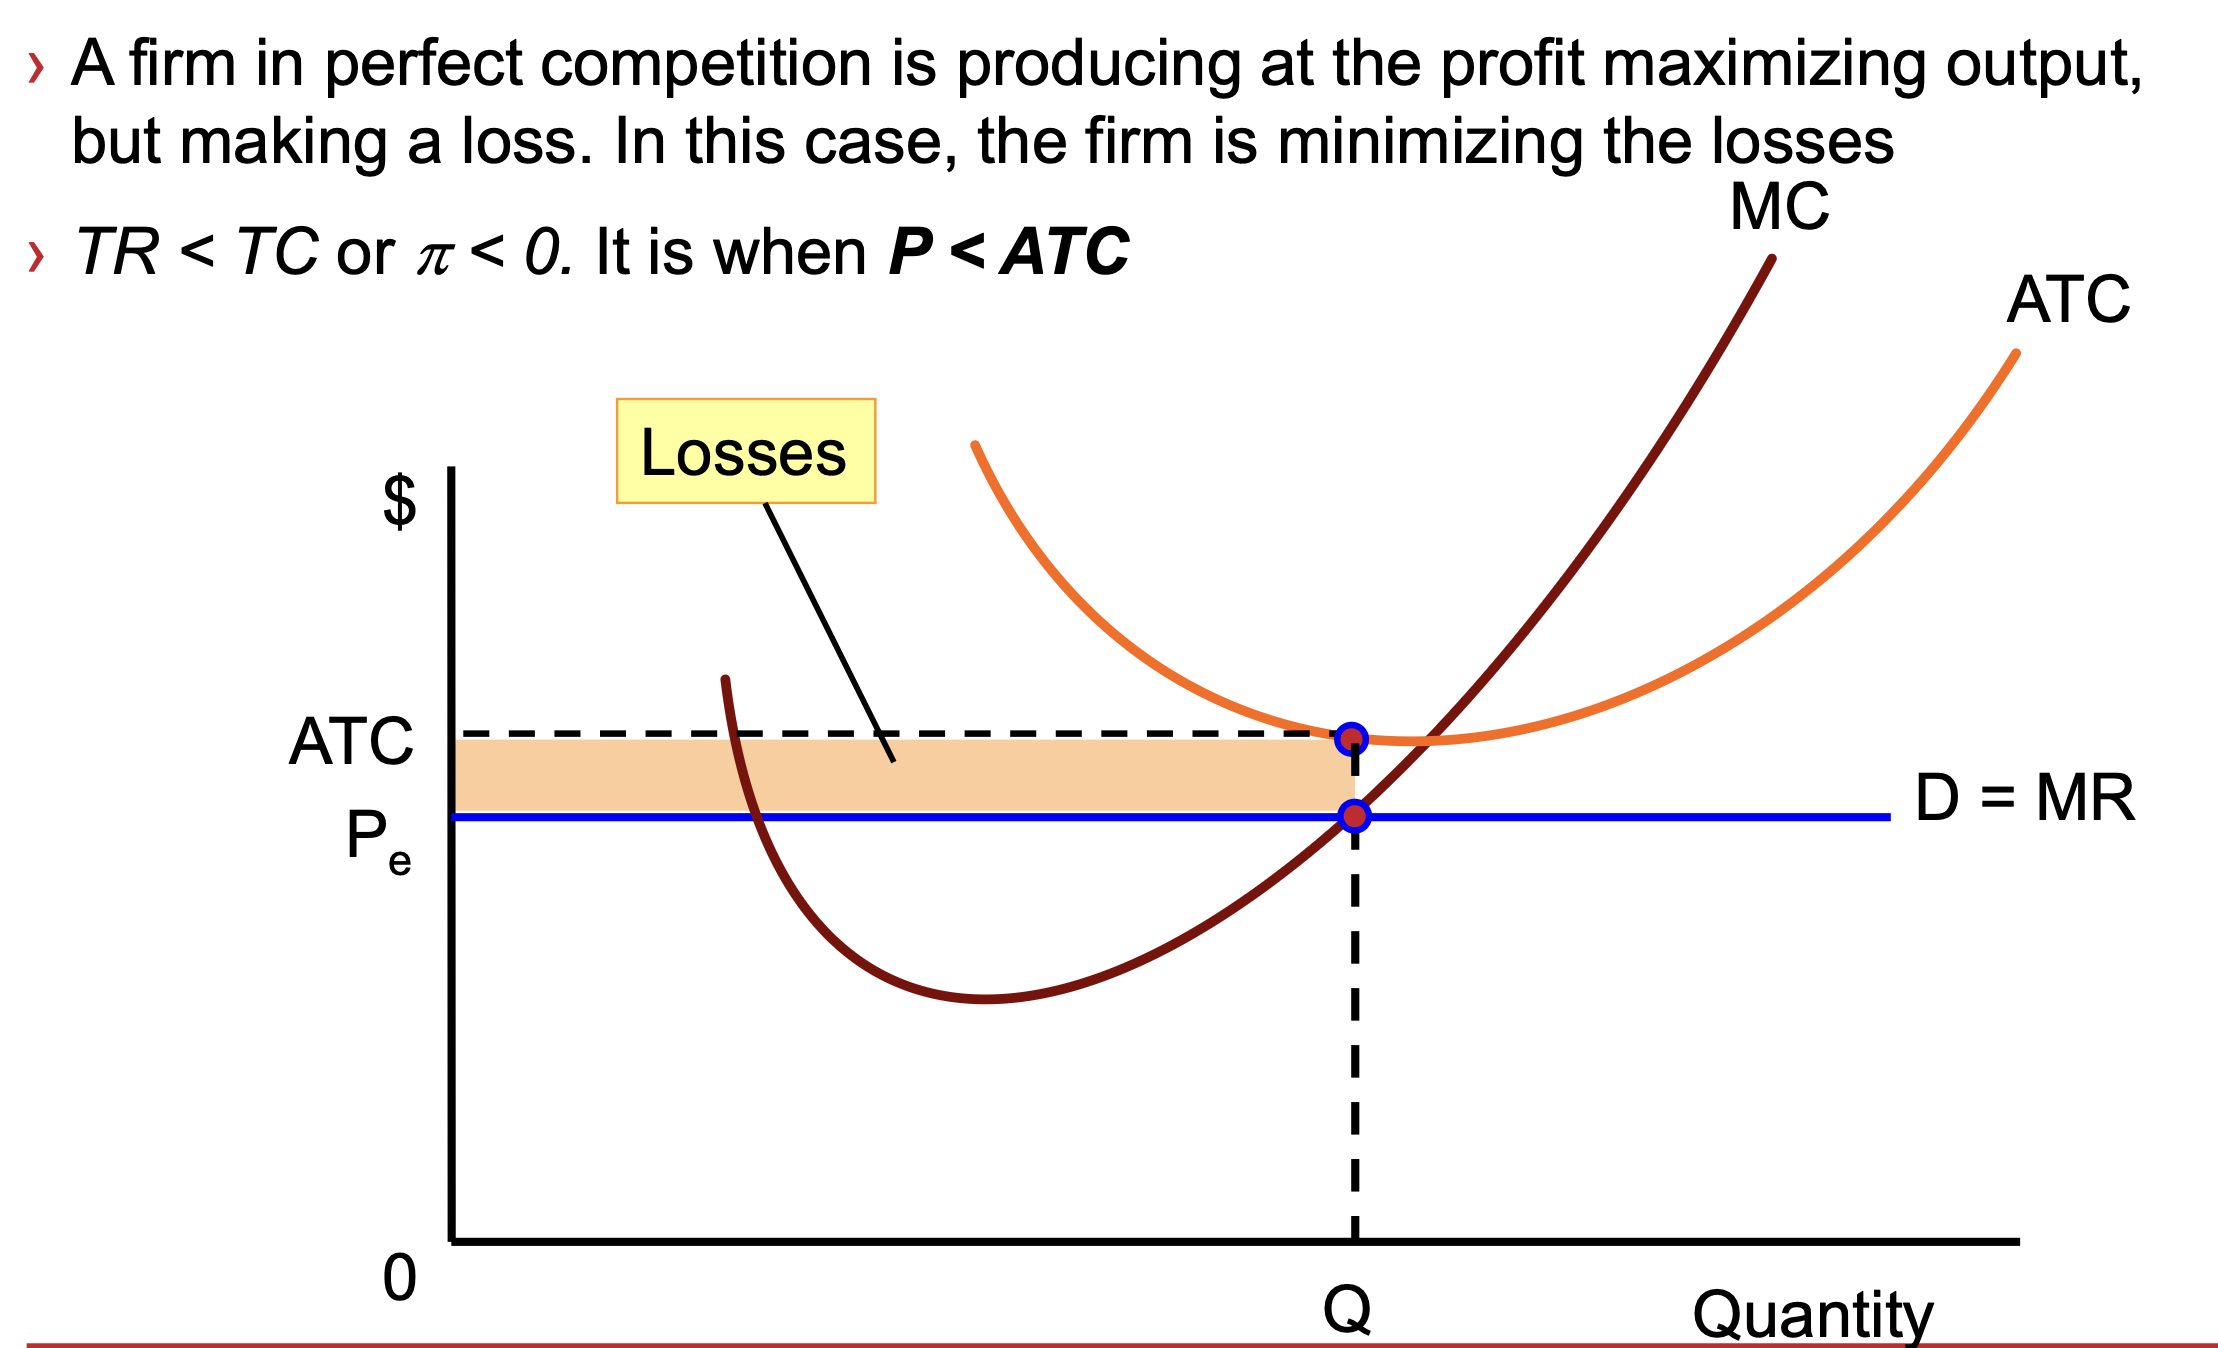
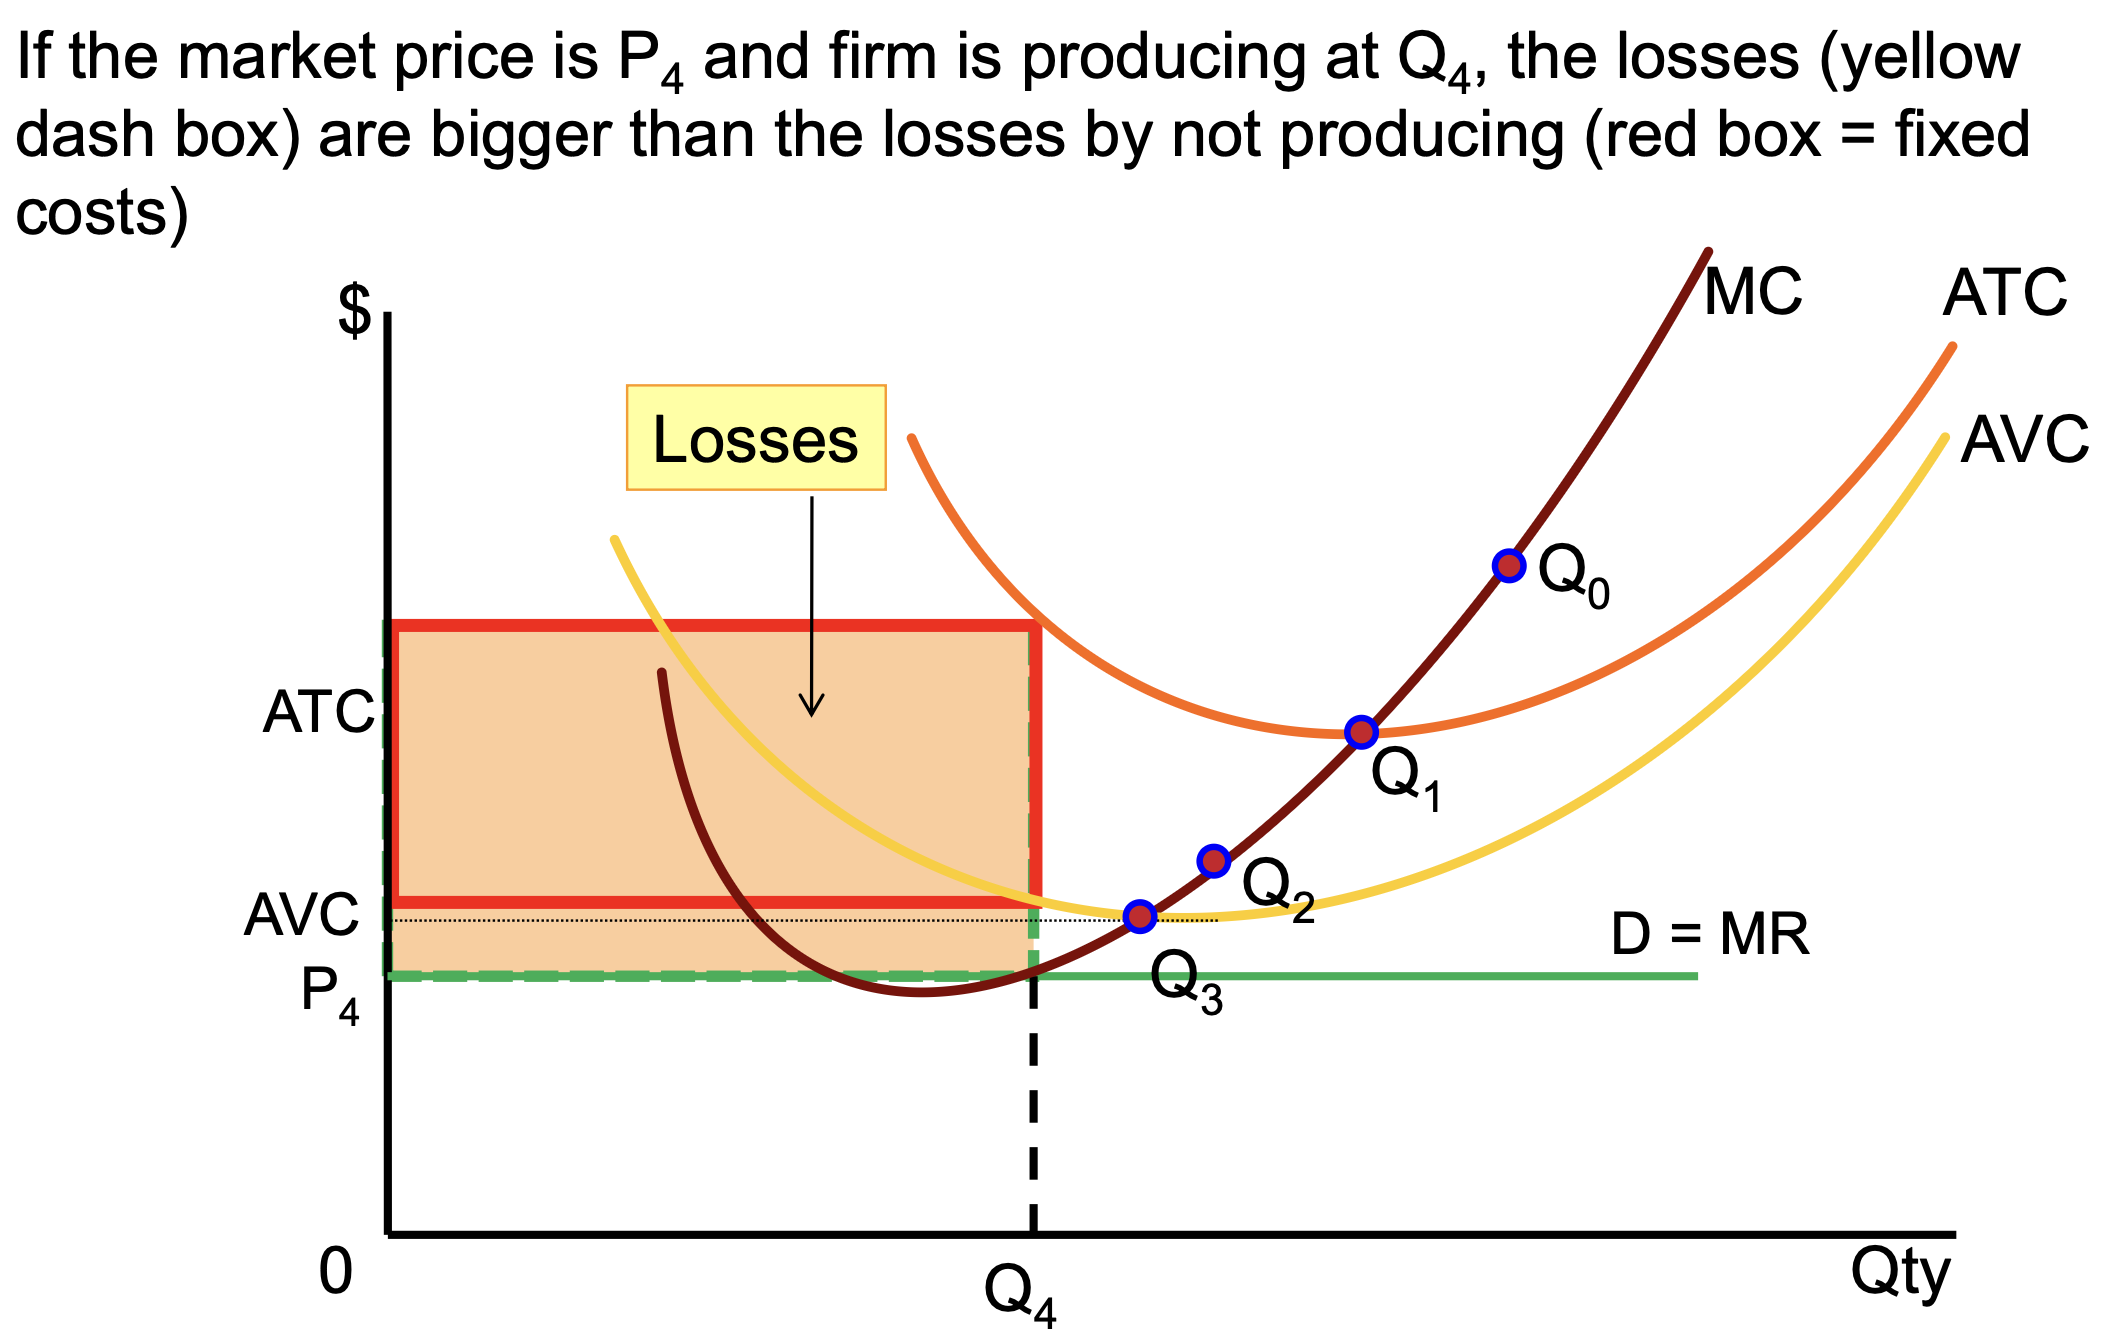
Making a loss SR
How firm can minimise losses SR
in SR — no firm will entry/exit
in SR — fixed costs will be incurred whether or not firm produces
if P>AVC — firm still produces because at least some fixed costs are recovered
if P<AVC — firm will shut down as by producing - losses are bigger
Shut down point on SR Curve
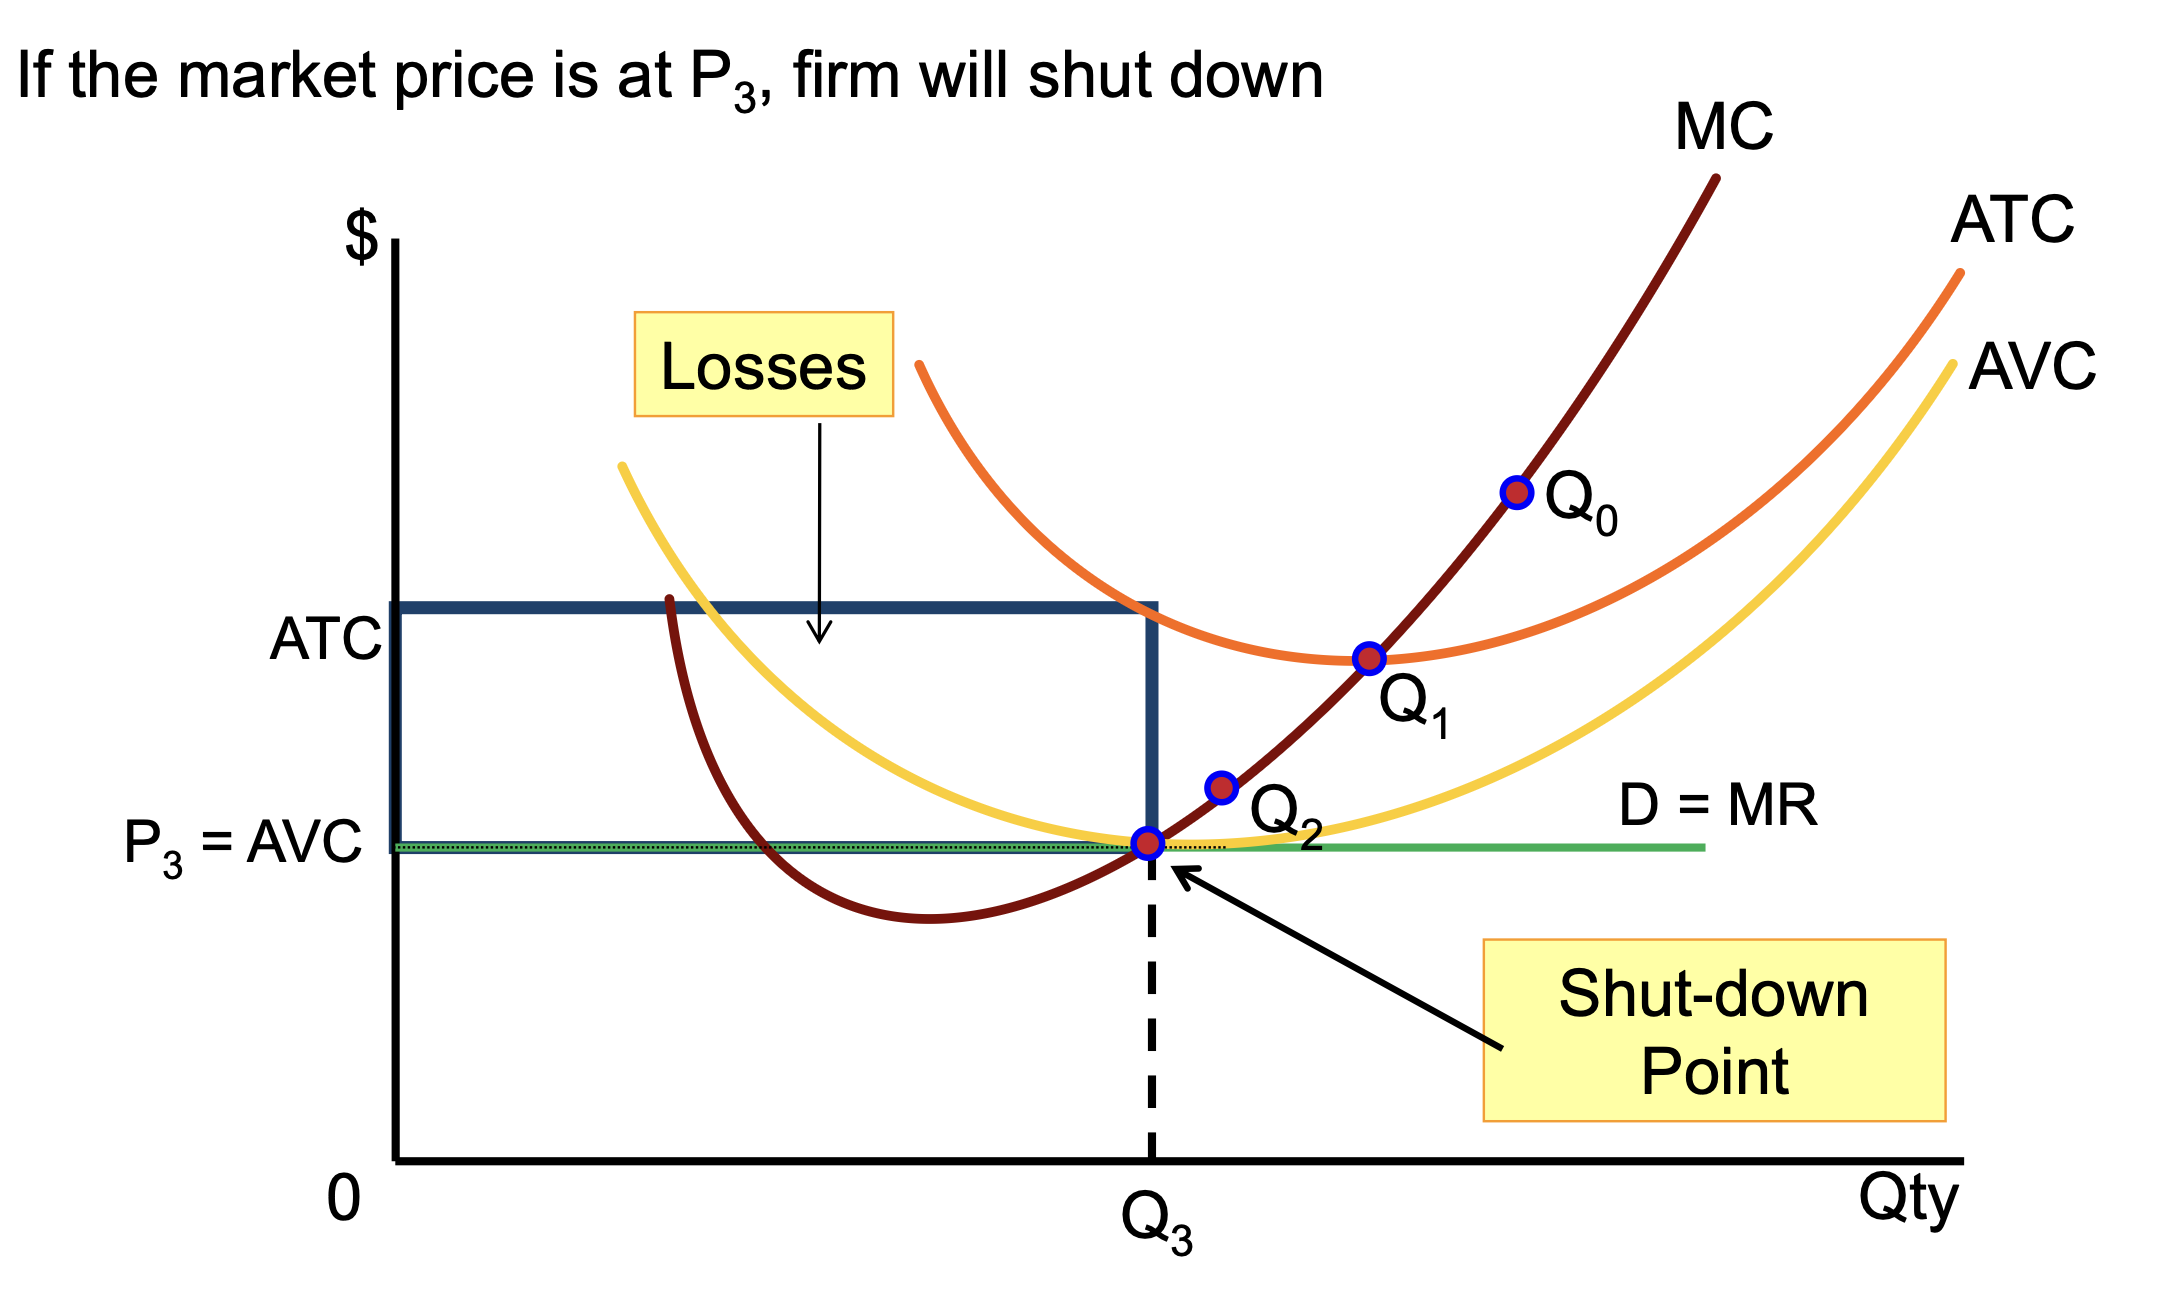
Losses bigger than losses by not producing
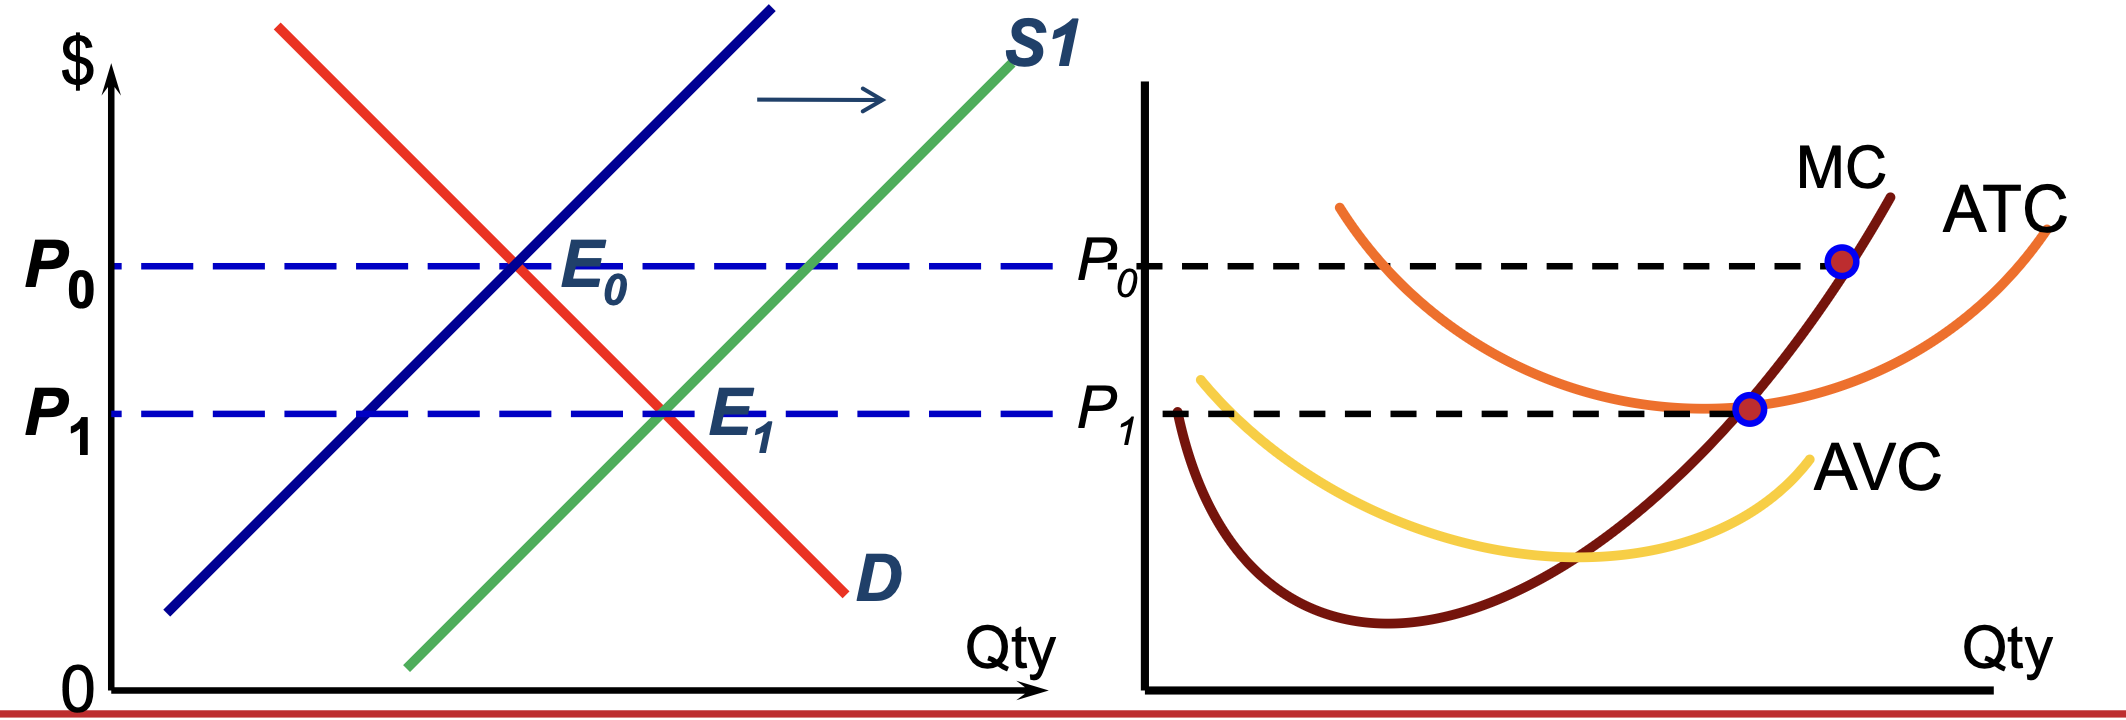
Econ to Normal Profit — LR Eq
firms can enter and exit freely in market
labour and capital perfectly mobile
if market eq p at P0 — firms will make economic profit — leads to entry of new firms into the market
marks eq p lower (P1) — until firms only make normal profit
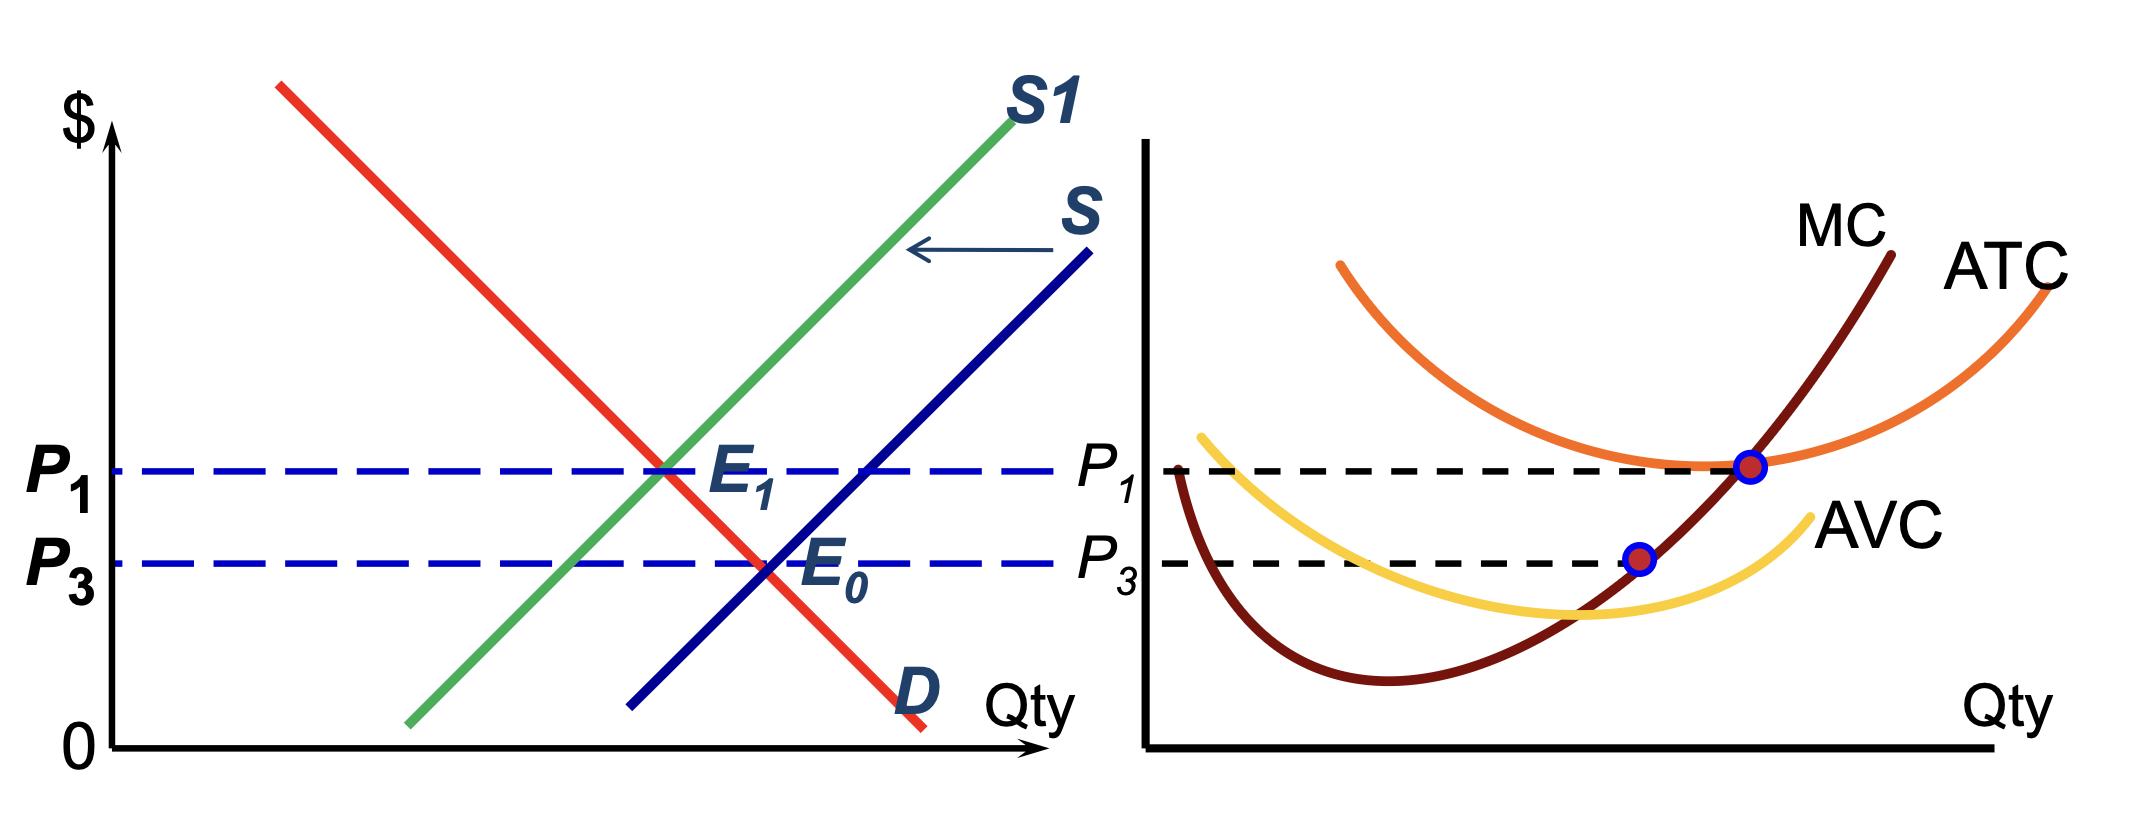
Loss to Normal Profit - LR Eq
if market eq is at P3 — losses
leads to exit of firms
makes eq p higher (P1) until firms make normal profit
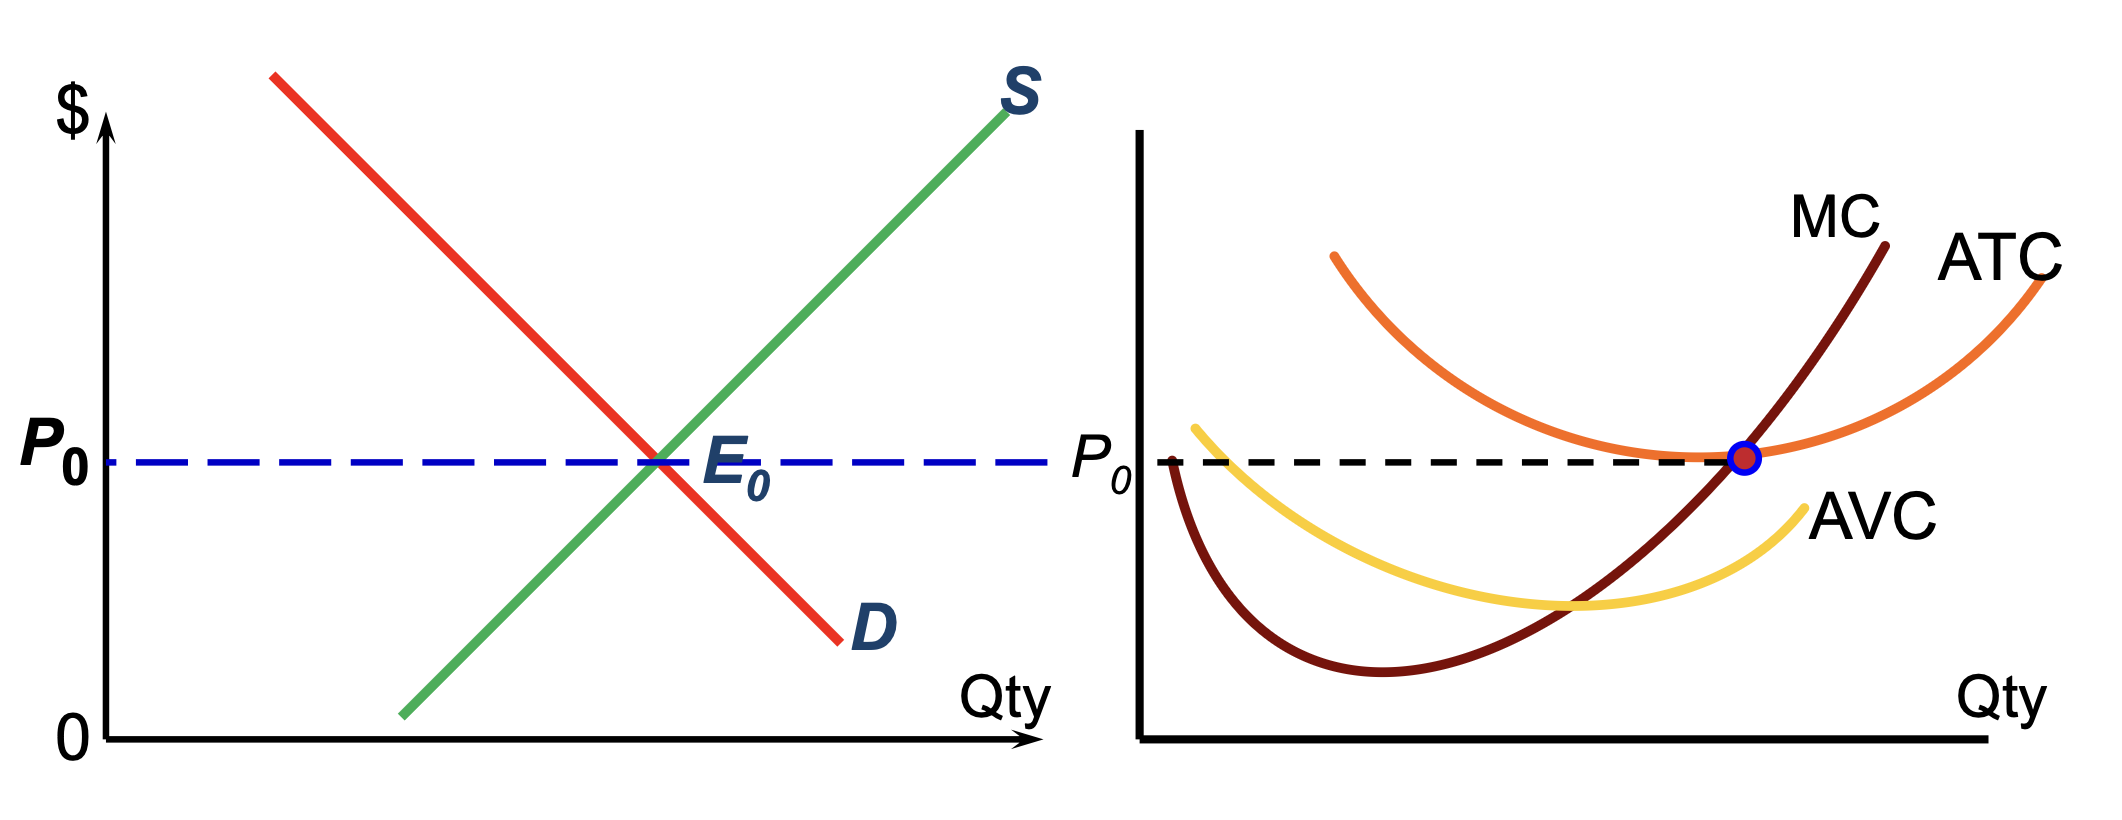
In Eq in the LR…
firms can only make normal or zero economic profit
P = MR = MC = ATC (min of ATC since MC cuts ATC at min pt)
External economies & diseconomies (LR indus s)
External economies
factors beyond control of indv firm that lower costs as indus expands
e.g. as computer indus expands — cost of chips fall
External diseconomies
factors outside control of a firm that raises firm’s costs as indus ouput increases
e.g. as wine indus expands — cost of water increases
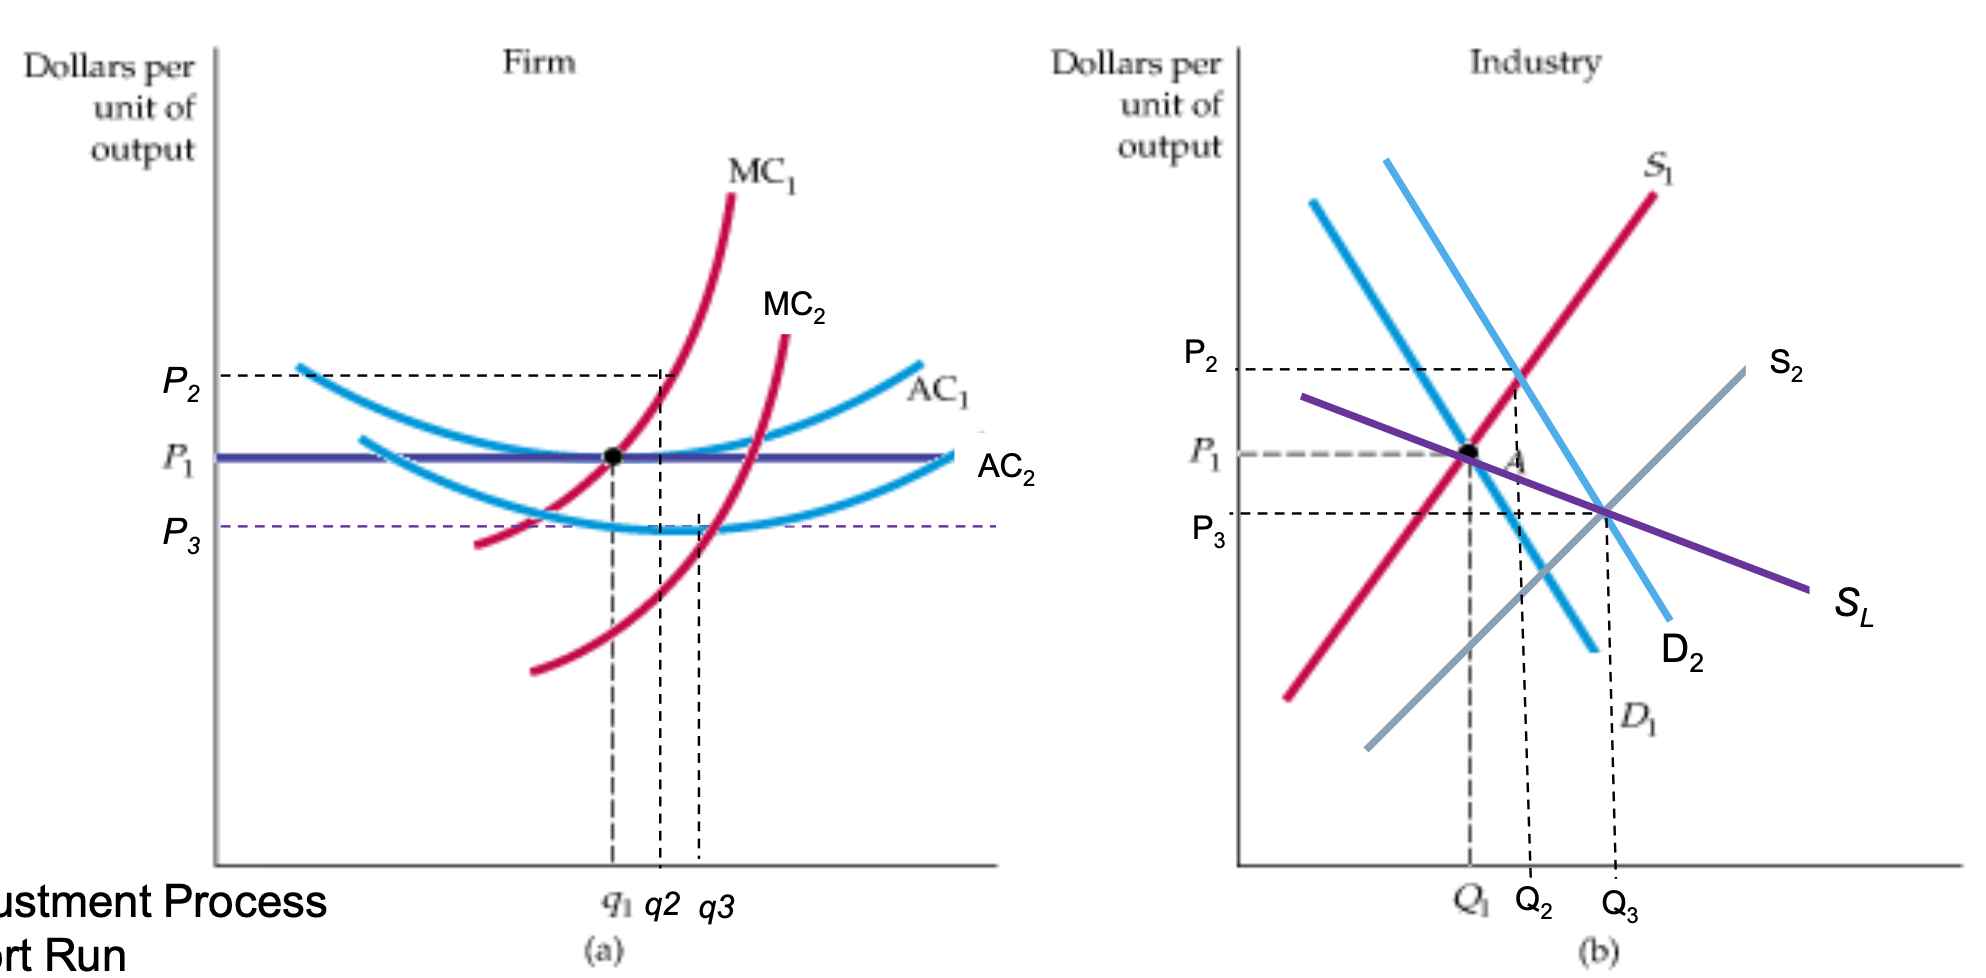
Constant Cost Industry (Graph + Adjustment Process)
SR
Industry
D decreases (D1→D2)
P rises (P1→P2)
SR Eq at C
Firm
Output increases (q1→q2) + rising MC
LR
economic profit attracts new firms — Market supply curve shifts (S1→S2)
Prices fall back to P1 w LR Eq at B
LR S curve is SL
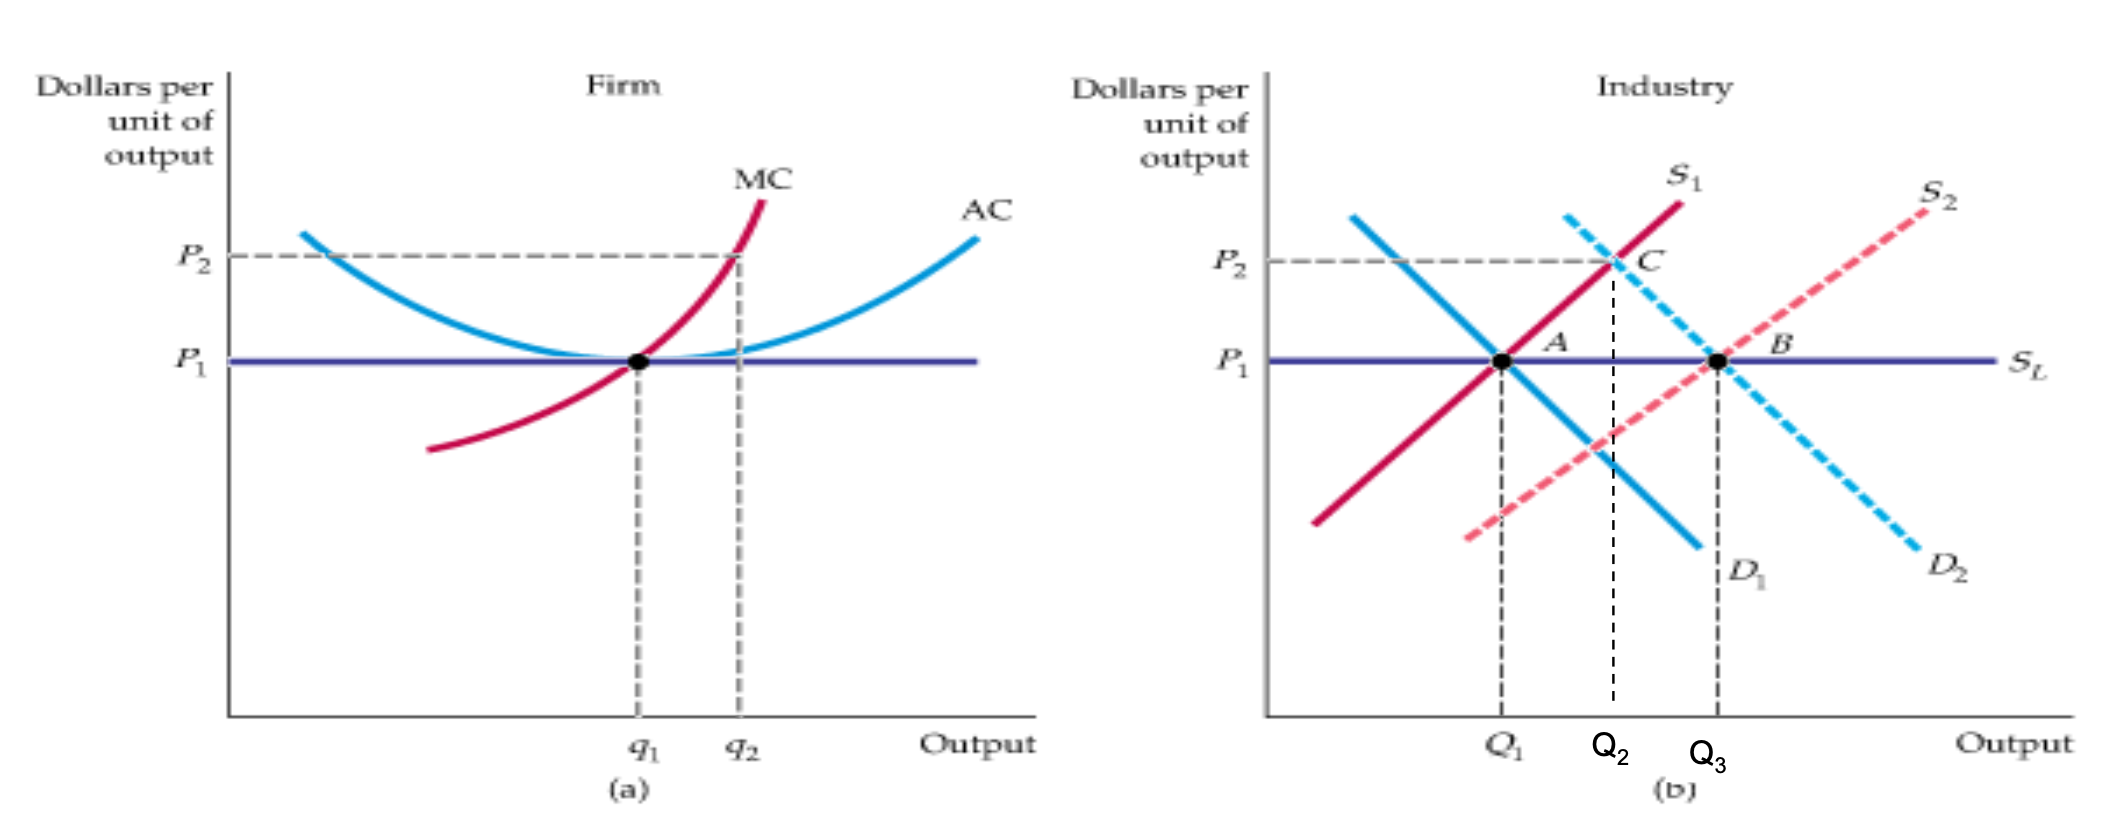
Constant cost industry
entry and exit in LR ensures all firms earn zero profits and the price is P* = ATCmin
assumes that all firms have access to same tech and same cost structure and does not change as indus grows
Increasing cost industry
upward sloping LR S curve
if potential entrants have a higher cost than incumbent firms (already in market)
some resources used in prod maybe available in limited qtys (input p rises as indus expands) — costs for all firms rise
congestion may rise w indus output (e.g. airlines)
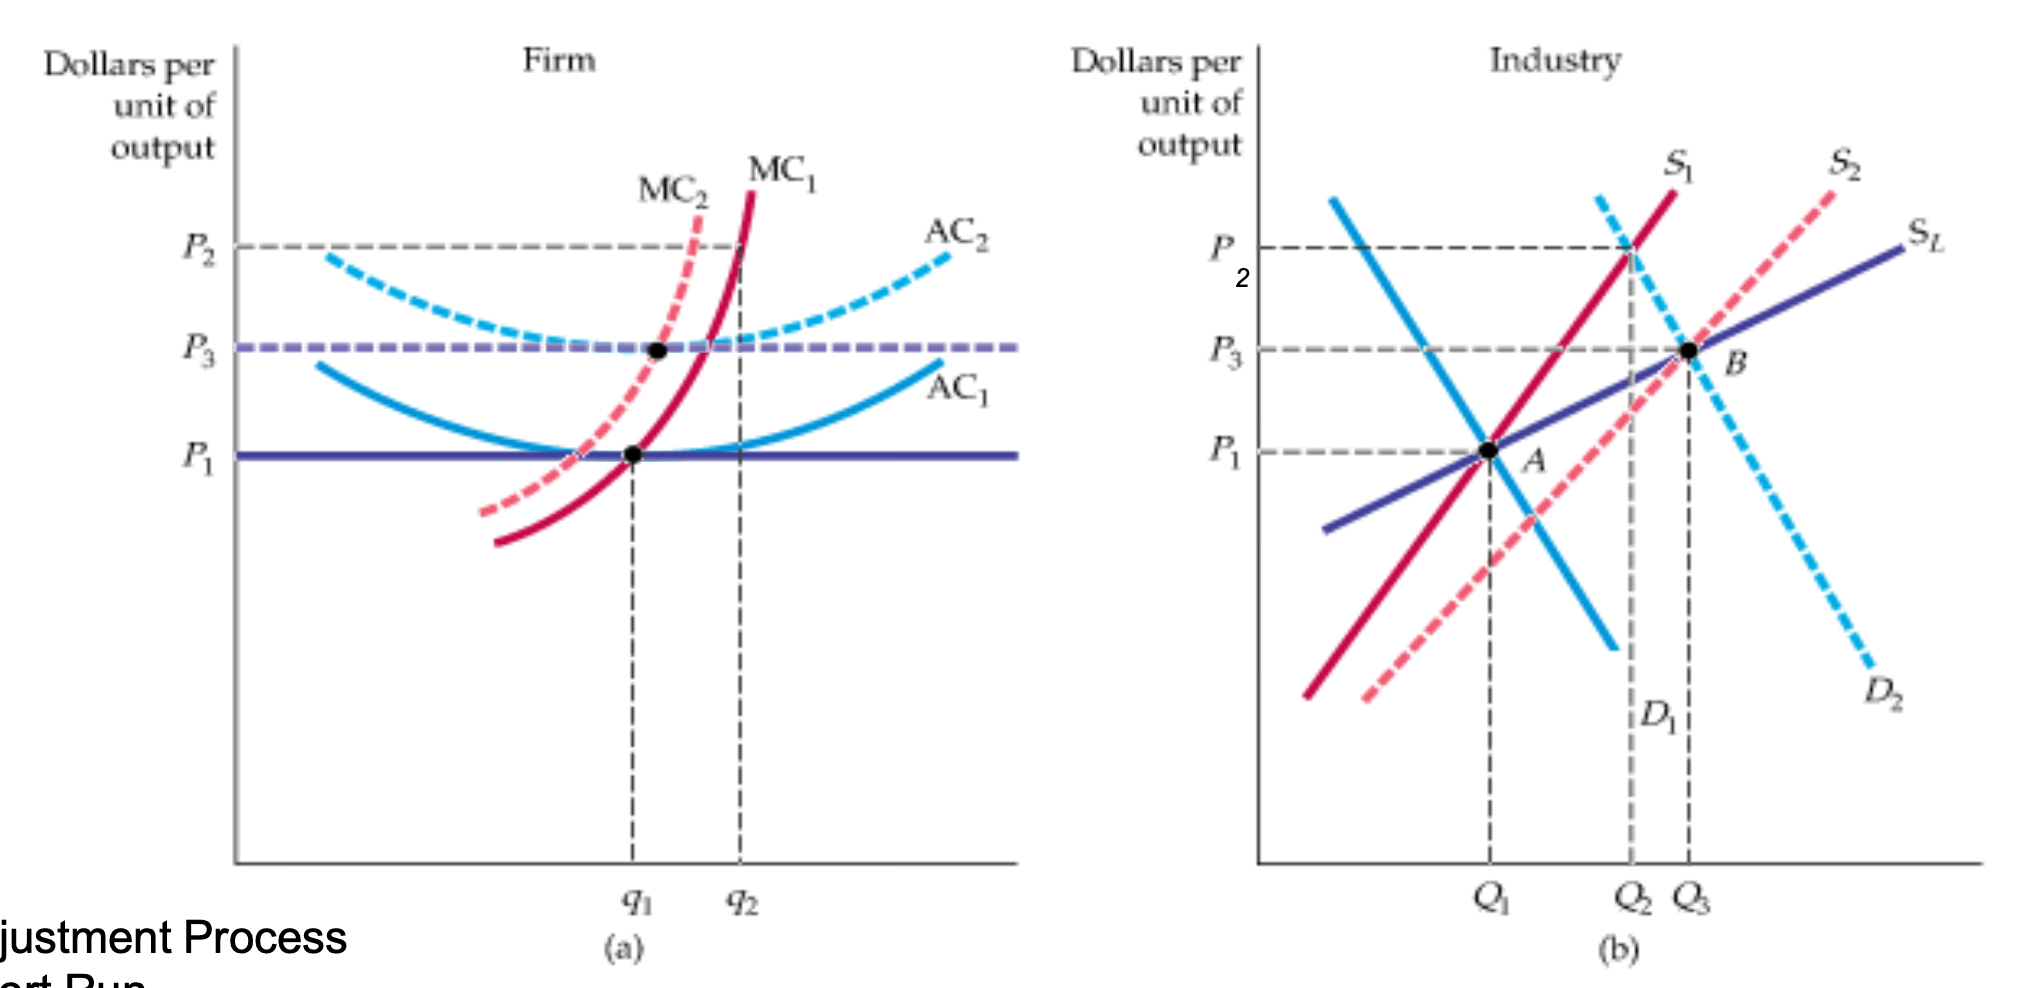
Increasing Cost Industry (Graph + Adjustment Process)
SR
Industry
Increase in D (D1→D2)
Increase in P (P1→P2)
Firm
q1 to q2 by moving along MC1
LR
Industry
increase in profits cause new firms to enter indus
shifts SR S curve (S1→S2)
P falls back (P2→P3)
as output expands — input p increases (AC1→AC2)
economic profit eliminated — LR S curve is SL
Decreasing Cost Industry
as output in indus expands — costs for all firms fall
if there are EOS in input markets
e.g. computer software — as market expanded — avg costs for all firms fall
following increase in d — entry will continue till no longer profitable
new LR Eq p has to be lower than initial Eq
LR indus s curve is downward sloping
Decreasing Cost Industry (Graph + Adjustment Process)
SR
Industry
increase in D (D1→D2)
increase in P (P1→P2)
Qty increases (Q2→Q2)
Firm
q1→q2 along MC1
LR
Industry
increase in profits cause new firms to enter
shift in SR s curve (S1→s2)
Qty increases (Q2→Q3)
p falls back (P2→P3)
output expands — input p falls — AC1→AC2
economic profit eliminated
LR s curve is SL