AP Macroeconomics Unit 2
1/41
Earn XP
Name | Mastery | Learn | Test | Matching | Spaced | Call with Kai |
|---|
No analytics yet
Send a link to your students to track their progress
42 Terms
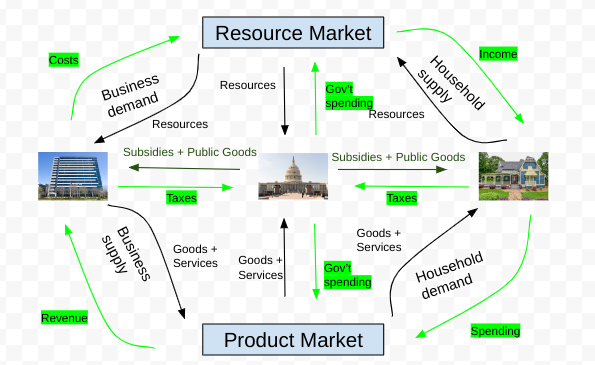
Circular Flow Model
A model showing how money, goods, and services flow through the economy. In this case, the “private” sector refers to households and the “public” sector refers to the government.

Nominal
Based on the current purchasing power.
Real
Adjusted for inflation. Does a better job than nominal things in comparing economic growth.
The Three Macroeconomic Goals
Promote Economic Growth
Limit Unemployment
Keep Prices Stable
Gross Domestic Product
The dollar value of all final goods and services within a country in one year.
GDP per Capita
The GDP per person. An accurate way of calculating the standard of living.
Calculating the percent change in GDP
(Year2-Year1/Year1) x 100
What’s not included in GDP?
Intermediate goods (the wheels of a car)
Nonproduction transactions (stocks)
Nonmarket and illegal activities (bake sale/black market)
If the intermediate good, by the end of the year, is still considered inventory (hasn’t been used), then it will count towards GDP.
Three Ways to Calculate GDP
The Income approach
Value-added approach
Expenditure approach
All methods should come to the same number.
Income approach
Adds up all income from producing goods and services.
Labor Income
Rental income (property)
Interest income (loans)
Profit
Mnemonic: WRIP. These are factor payments.
Expenditures approach
The most common method in this course.
Consumer spending: C
Business investment: I
Government spending: G
Net exports (exports - imports): Xn
Consumer Spending
Made up of: Any final good and service
Investment
Made up of: Businesses buying capital goods
Not made up of: Anybody else buying the same capital good for noncommercial purposes (consumer spending)
Government spending
Any spending made by the government. Doesn’t include transfer payments or interest payments on the national debt.
Net exports
Exports - imports. If you export more, you sell more. If you import more, you’re buying more.
Value-added approach
Adding up the value each stage adds to that product, up till it sells.
Unemployment
Workers looking for a job but aren’t currently working.
Unemployment rate
number of unemployed people/labor force
Labor Force
The amount of people who are eligible to work. They must be at least 16 years old, able and willing to work, not institutionalized (military), in schools, or retired.
Labor force participation rate
Labor Force/civilian population
The Three Types of Unemployment
Frictional
Seasonal (part of frictional)
Structural (also known as creative0
Cyclical
Frictional Unemployment
Temporary unemployment or between jobs. Usually when you’re moving to a new town. Seasonal unemployment is one type. It happens when your job is temporarily closed due to the season.
Structural Unemployment
When workers’ skills become obsolete due to changes in the labor force. This happens to steel workers, even today. Technological unemployment is one type of this.
Cyclical Unemployment
Unnatural employment. It is caused by a recession. As demand falls, labor falls, and workers are laid off.
Natural Rate of Unemployment
Frictional plus structural unemployment. Where the economy should be at its healthiest. If the UE is greater than NRU, the economy is inefficient. If the UE is less than NRU, the economy is in an unusually high production benefit. No unemployment results in extremely high prices.
What’s not included in unemployment?
Discouraged workers: people who supposed to be in the labor force but are not counted due to not wanting to look for a job.
Underemployed workers: people who are considered employed, but can’t work more hours/get enough pay.
Race/age inequalities.
Inflation
The rising general level of prices. You can expect this to happen every year. It causes the value of money to go down. This is considered bad, since banks won’t lend out as much and people will not save.
Deflation
A decrease in general prices. It is considered worse than inflation. In this scenario, people will hoard their money.
Disinflation
Remedying inflation by trying to do so at slower rates.
Inflation rate (%)
[(Y2-Y1)/Y1] × 100
Consumer Price Index (CPI)
A “market basket” including similar products. The CPI is set on a base year, whose value is 100. That value may change depending on the inflation rate.
(Price of market basket/Price in base year) x 100
Problems with the CPI
Substitution Bias: As prices increases, consumers may buy of some products and buy a product in a substitute not necessarily in that market basket. (CPI may be higher than shown.)
New Products: The market basket may not include the latest consumer goods. (CPI only measures prices.)
Product quality: The CPI disregards product quality. (CPI may not change, but economic well-being has.)
The Three Costs of Inflation
Menu costs: It costs money to change prices and print new menus.
Shoe leather costs: It costs time and effort to reduce any inflation.
Unit of account costs: Money’s value is now uncertain due to inflation. This decreases efficient spending.
Hyperinflation
A very sharp increase in the price levels of goods. This makes money useless.
GDP deflator
A measurement looking at the contrast between nominal and real GDP for a year.
(Nominal GDP/Real GDP) x 100.
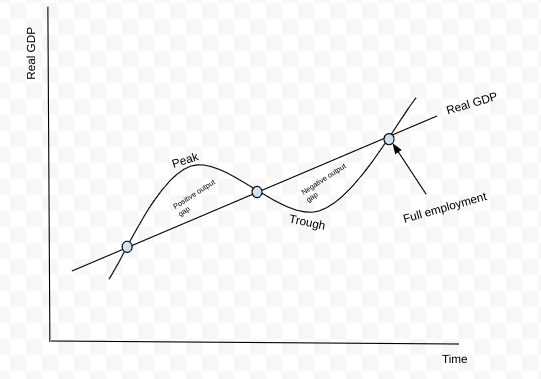
The Business Cycle
A graph that shows how the economy naturally fluctuates over time.

Positive output gap (inflationary)
When the current output is more than that of potential output. Represented when the curve is above the real GDP line.
Negative output gap (recessionary)
When the current output is less than that of potential output. Represented when the curve is below the real GDP line.
Recession
A generally six-month period of decline in real GDP.
Depression
An extreme recession that significantly lowers real GDP. It lasts more than a year.
Expansion
The upward sloping of the curve. It signals an improvement in the economy from the trough.
Contraction
The downward sloping of the curve. It signals the economy going into a downturn.