Gr 220 Exam 1
1/89
There's no tags or description
Looks like no tags are added yet.
Name | Mastery | Learn | Test | Matching | Spaced | Call with Kai | Chat |
|---|
No analytics yet
Send a link to your students to track their progress
90 Terms
The study of the Earth's shape, orientation in space, and gravitational field. The Earth is not a perfect oval or circle, the shape it is is known as a geoid
Using color and patterns to represent numerical or categorical data on maps. Match color to topic, hue progressions, value progressions, hue guidelines, value guidelines, pattern-value guidelines
Medieval thinking
The melding of geographical experience with religious teaching = church maps; example: importance of Jerusalem
Renaissance -> Globalism
Needed better tools for more accurate maps (age of exploration), The use of geometry reappeared, and the discipline entered into universities
Enlightenment
The reintroduction of science and precise measurement and thematic maps were introduced to show the distribution over space of different types of data (birth of spatial analysis)
Chronometer
Used for the navigation at sea, can measure/map latitude
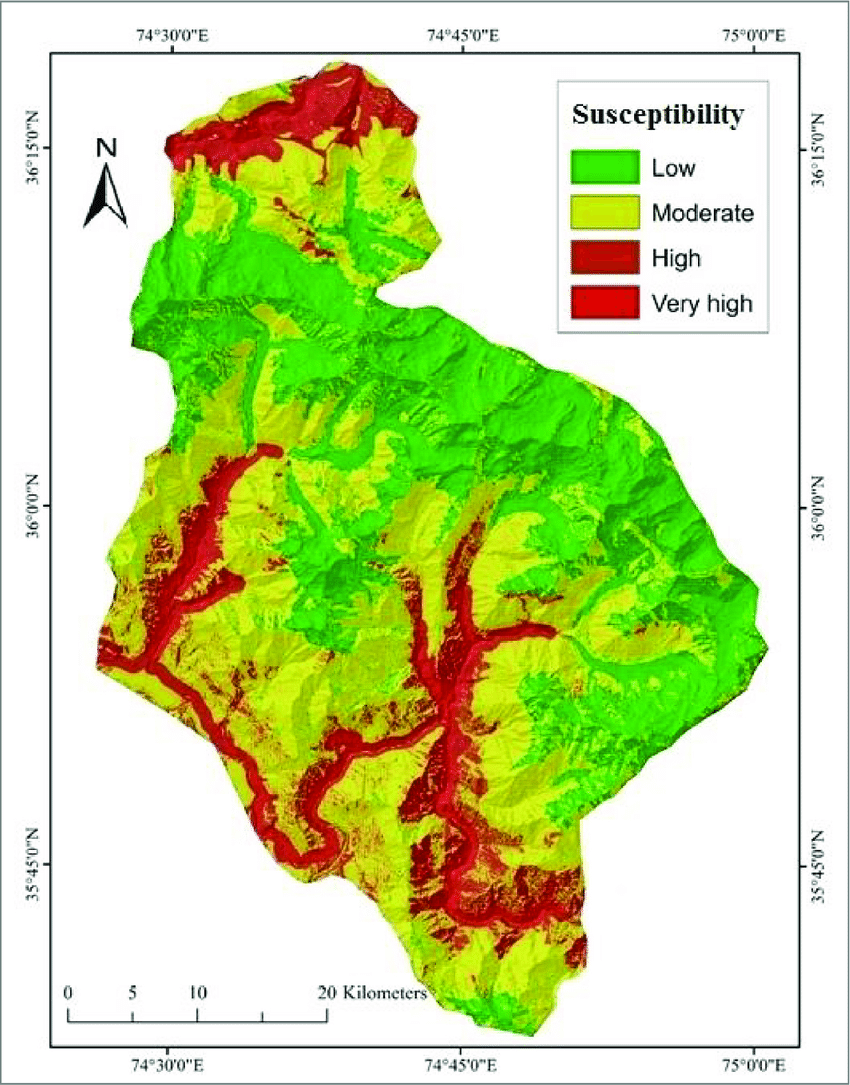
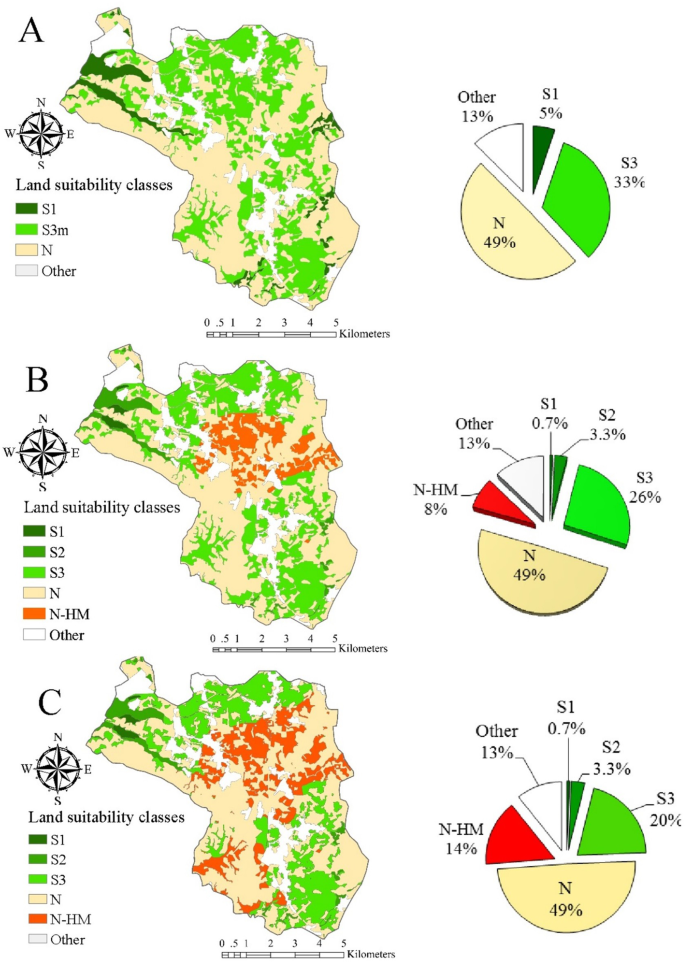
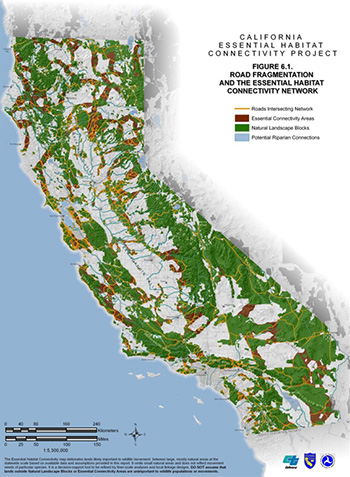
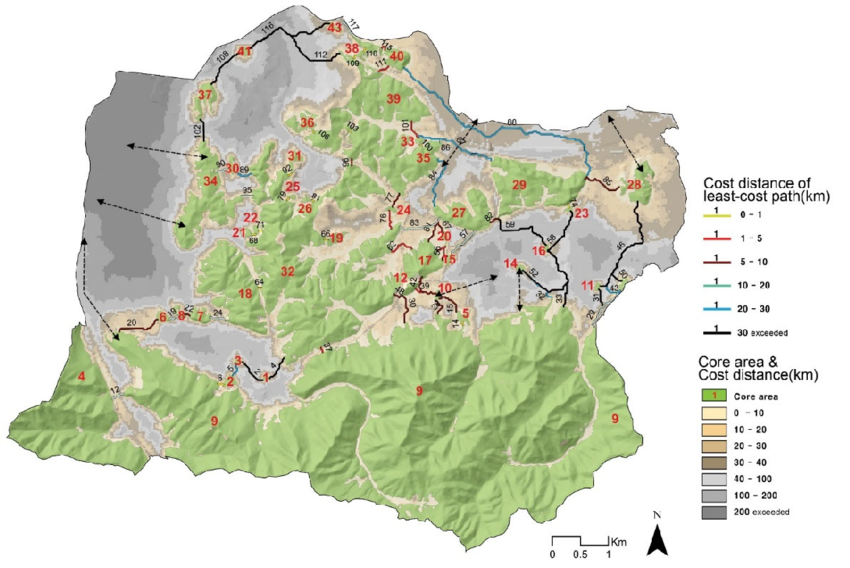
Cartographical modeling
susceptibility maps, suitability maps, habitat maps, least cost path maps
susceptibility maps
Shows the susceptibility of an area to a specific disaster
suitability maps
Shows the suitability of an area for crops/forests/species etc.
habitat maps
Shows the habitat of a specific species
least cost path maps
think of it as a map which shows the line of best fit
Technology and Cartography
Manual tech, Magnetic tech, Mechanical tech, Optical tech, Photo-chemical tech, Information age mapping - GIS, Future - virtual reality
Original GIS
1963 Canada Geographic Information System
Forms of Representation
Graphicacy and graphical representation
Need for maps
extend vision, provide spatial understanding, facilitate navigation and communication
Categories of maps
classed by scale, function and subject
classed by function
general reference maps, thematic maps, and charts
Margin elements
Margin elements are all the non-map items in your map
Primary Elements
Maps, insets, legend, title, subtitle, north arrow, scale bar, date, authorship, page border
secondary elements
neat lines, graticules, network path, disclaimer, data source and citation, logo, graphs, photos, map number, copyright, projection, and descriptive text
what is a font
Font is the design of letter style group: e.g. 12 point italic Futura
Typeface: general category of text: e.g. Futura, Arial, Times Roman
BUT, most people just call it all “Font” these days
Serif
Closer range reading to eliminate confusion of I and L or other similar letters
non-serif
More readable at a distance (posters)
Web maps (usually but not always these days)
Lower resolution situations
Favored fonts
Verdana (san) and Georgia (serif)
General Sizes
Reading body text: 12 -14 pt
Title: 16-20-24 (depending)
Letter spacing
Don’t space out more than 4x the letter height or the features won’t look like they make a word
Red text
important or dangerous, highways
Green text
natural features
Brown and grey/black
natural features, parks, forests, mountain ranges
Nature of color
Product of our mental processing of electromagnetic radiation (EM)
Spectral color
Visual sensation of light occurs because receptors in our eyes are stimulated by EM radiation of certain wavelengths
Hue
the color dimension associated with different dominant wavelengths of EM
Brightness
general term for how light or dark a color appears
Value
sensation of lightness or darkness evoked by a color
Additive color system
Mixing different amounts of RGB (primary colors) creates the secondary colors
Subtractive color system
Begins as white and colors (wavelengths) are ‘’blocked” or filtered from reflecting light back to you
Trichromatic theory
Eyes have red, blue and green wavelength receptors, But this is only true to the extent that our eyes have cones sensitive to blue, green, and red wavelengths
Opponent theory
Electrical impulses from the cones do not travel directly to the brain
Cone cells are connected to three types of ganglion (nerve) cells
BY (blue-yellow)
GR (green-red)
WBK (white-black)
CIE (Commission International de l’Eclairage)
Objective system
Precise specification of any color in numeric terms
Makes use of spectrometers to measure reflectance
Munsell System
3 dimensions of color; hue, chroma and value (think xyz plane)
Natural Color System
whiteness to blackness, color wheel
RGB Color Model
A cube with positions specified as ‘x’, ‘y’, ‘z’
Range of integers defines colors in the cube
0,0,0 = black;
255,255,255 = white
HLS Color Model
Hue, Lightness, Saturation
Double cone – similar to the Natural Color System
Each Hue specified by angular distance from blue
HVC Color Model
Hue, Value, Chroma
Three-dimensional color space identical to Munsell color solid
Visual acuity
the ability to detect and differentiate between small symbols
Single Hue Progression
Value decreases and chroma increases systematically all the colors move from pure white to pure hue
Bi-Polar Progressions
Progression from a one pure hue to another pure hue
Denotes a range of change from a positive to a negative
Center is white
Partial Spectral Hue Progression
Endpoint and mixture hues match part of the solar spectrum
Represent mixing/percentage of two variables in an area
Blended Hue Progression
Use related hues to ‘blend together’ the two end point hues
Value Progression
Used on monochrome maps
From white to black / light to gray
Full-Spectral Progression
Hues from blue through red are used
Easy for map readers to match colors with legend classes
Used in elevation
Two-Variable Color Progression
Two variables, each represented by one hue
Progression within each hue
Hue Guidelines for Quantitative Progressions
Darker = more
Yellow has fewest
Best to use yellow as an endpoint hue in progressions
Value Guidelines for Quantitative Progressions
Greater value contrast among symbols, greater the clarity
Pattern-Value Guidelines for Quantitative Progressions
Regular spaced dots, lines, or cross-hatch can be used to indicated ‘value progressions’
Dots, depending upon spacing, can provide progression of texture
Dot and line patterns have an orientation to viewers
Texture pattern progression
Progression of coarse- to-fine texture dot, parallel line, or cross-hatch can be used to symbolize quantitative texture
geoid
roundish blobby thing) - is the HYPOTHETICAL shape that the ocean surface would take under gravity and rotation alone (no tides or wind) - this shape is extended ‘through’ continents. There are almost an infinite number of geoids
Special color design issues
Color blindness
Type of ellipsoid used
At small scale (continents, regions, countries)?
not much
At medium scale (states / districts / counties)?
sometimes
At large scale (towns, parcels)?
yes
Which ellipsoid is used when creating a datum?
The ellipsoid (spheroid) is used that best fits the geoid at the area where the map is going to be made.
For world maps, an ellipsoid that best fits the whole geoid is used (these are derived from satellite measurements).
For local maps, the ellipsoid that best fits that area is used.
Vertical Datums
Height above Geoid:
mean sea level is no longer used; orthometric heights (height above geoid) is used
What are the six types of projects
Equal Area projection: preserves area (also equivalent area)
Conformal projection: preserves shape (preserves angles), but only locally
Azimuthal projection: preserves direction
Equidistant projection: preserves distance
Gnomonic projection: preserves shortest route
Compromise: preserves neither
UTM
Worldwide
Universal transverse mercator
Both a projection and coordinate system
Tangent along central mendian
Greatest accuracy is the central meridian
State Plane Coordinate System
Each state is divided into one or more zones
Each zone is its own coordinate system (similar to UTM)
East-west zones (horizontal) use Lambert Conformal Conic Projection
North-south (vertical) zones use the Transverse Mercator Projection
Military Grid Reference System (MGRS)
System is an extension of the UTM system. UTM zone number and character are used to identify an area 6 degrees (E-W) and 8 degrees (N-S)
UTM Zone number and designator are followed by 100 km square easting and northing identifiers
The system uses a set of alphabetic characters for the 100 km grid squares
the different data types
- Integer data and floating point data
- Categorical data:
Interval and Ordinal
Numeric data
Ratio data
Ordinal
Natural ordered, Ranked data, first second third, etc.
Interval data
Measured along an equidistant scale
Temp
No natural zero point
Ratio data
There is a natural zero point
Population density
Time
Kelvin temperature scale
Nomial
Named
Can not be defined as ordinal
three projection surfaces
cylindrical, conic, and azimuthal