Advanced research methods - Lecture 3
0.0(0)
Studied by 5 people0%Exam Mastery
Build your Mastery score
 AP Practice
Supplemental Materials Call Kai
Call KaiCard Sorting
1/15

Earn XP
Last updated 2:43 PM on 2/1/23
Name | Mastery | Learn | Test | Matching | Spaced | Call with Kai | Chat |
|---|
No analytics yet
Send a link to your students to track their progress
16 Terms
1
New cards
What can we say about the outcome of a logistic regression?
Outcome is always dichotomous / dummy (0/1 - yes/no).
2
New cards
How do RQ start?
How likely is it that …
3
New cards
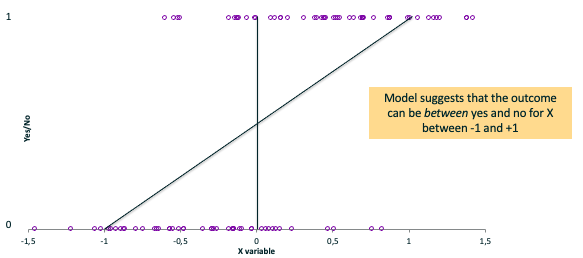
What happens if you fit an OLS on this?
You get a weird, untrue line between outcomes.
Model suggests that the outcome can be *between* yes and no for X between -1 and +1
Model suggests that the outcome can be *between* yes and no for X between -1 and +1
4
New cards
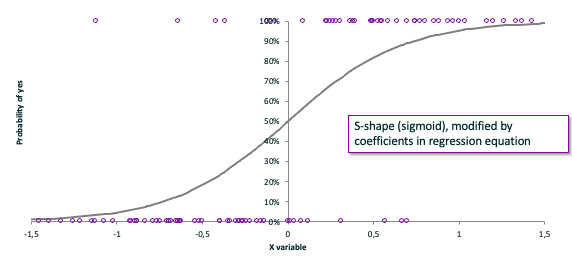
What if X < -1 or X>1 in logistic regression?
The curve approaches -1 and 1, but it takes much more time.
5
New cards
6
New cards
What is the difference in equation between OLS and logistic regression?
OLS: Y = β0 + β1 \* X1 + …
* Left side: X1 is linearly associated with the outcome
* Outcome = continous
Logistic = Ln(p/(1-p)) = β0 + β1 \* X1 + …
* Left side: X1 is linearly associated with the log of the odds of the outcome
* odds = (p/(1-p))
* Outcome = dichotomous
* Left side: X1 is linearly associated with the outcome
* Outcome = continous
Logistic = Ln(p/(1-p)) = β0 + β1 \* X1 + …
* Left side: X1 is linearly associated with the log of the odds of the outcome
* odds = (p/(1-p))
* Outcome = dichotomous
7
New cards
What can you use a OLS and logistic regression for?
OLS: Predict an outcome
* His predicted (*average*) weight is 80 kg (OLS)
Logistic: Predict the probability of an outcome
* There is a 15% chance that he weighs more than 70 kg (Logistic)
* His predicted (*average*) weight is 80 kg (OLS)
Logistic: Predict the probability of an outcome
* There is a 15% chance that he weighs more than 70 kg (Logistic)
8
New cards
What is the difference in interpretation between OLS and logistic regression?
OLS
* presented in terms of B
* For each x increase, y incerases on an average …
→ **Direction and size of effect**
Logistic regression
* presented in terms of B or OR
* Positive or negative B indicates that the probability of being > 70 kg increases with height
**→ Direction of effect**
* OR >1 (or <1) indicates that the probability of being >70 kg is larger (or smaller) for people with more height
**→ Direction of effect**
* presented in terms of B
* For each x increase, y incerases on an average …
→ **Direction and size of effect**
Logistic regression
* presented in terms of B or OR
* Positive or negative B indicates that the probability of being > 70 kg increases with height
**→ Direction of effect**
* OR >1 (or <1) indicates that the probability of being >70 kg is larger (or smaller) for people with more height
**→ Direction of effect**
9
New cards
How do you interpretate B coefficient for OLS?
For each unit increase in X, the outcome (Y) increases/decreases on average with … (coeffecient) (linear shape graph)
10
New cards
How do you interpretate B coefficient for logistic regression?
For each unit increase in X, the probability of the outcome (Y) increases / decreases. (S-shape graph)
11
New cards
OLS: How do you interpreate measures of association for weight?
Average weight men = 85, women = 72
* Absolute difference in means = 85-72= 13 kg
* Relative difference (ratio) = 85/72=1,18
* On average, men are 1.18 times as heavy as women
* On average, men are 18% more heavy than women
\
* Absolute difference in means = 85-72= 13 kg
* Relative difference (ratio) = 85/72=1,18
* On average, men are 1.18 times as heavy as women
* On average, men are 18% more heavy than women
\
12
New cards
Logistic regression: How do you interpretate measures of association for weight?
Proportion (/probability) men: 48%, women 40%
* Risk difference (absolute) = 48%-40%=**8% points**
* Risk difference (relative risk) = 48%/40% = 1.2
* Men are 1.2 times as likely to be overweight as woman.
* Men are 20% more likely to be overweight than women are.
Berekening kan ook andersom, wel resultaten anders interpreteren.
* Risk difference (absolute) = 48%-40%=**8% points**
* Risk difference (relative risk) = 48%/40% = 1.2
* Men are 1.2 times as likely to be overweight as woman.
* Men are 20% more likely to be overweight than women are.
Berekening kan ook andersom, wel resultaten anders interpreteren.
13
New cards
How do you interpretate the B coefficient and the OR odds ratio for logistic regression?
β = 0: no difference in probability (no effect) between groups
β > 0: higher X means *higher* probability of Y between groups
β < 0: higher X means *lower* probability of Y between groups
\
OR is the ratio between the odds of being overweight for men compared to the odds of being overweight for women
* OR = 1: no difference in odds (no effect)
* OR > 1: higher odds of Y
* OR < 1: lower odds of Y
β > 0: higher X means *higher* probability of Y between groups
β < 0: higher X means *lower* probability of Y between groups
\
OR is the ratio between the odds of being overweight for men compared to the odds of being overweight for women
* OR = 1: no difference in odds (no effect)
* OR > 1: higher odds of Y
* OR < 1: lower odds of Y
14
New cards
What is the marginal effect?
Comparison between ‘everyone gets treated’ and ‘no one gets treated’ (i.e., we will simulate counterfactual outcomes)
15
New cards
What is table 2 fallacy?
Fallcy is t o interpret all coefficients in the same way.
* That it is wrong to assume that all coefficients from one regression model can be interpreted in the same way
* Some coefficients represent full effects, some partial effects
* Some coefficients are unbiased, some are biased
* That it is wrong to assume that all coefficients from one regression model can be interpreted in the same way
* Some coefficients represent full effects, some partial effects
* Some coefficients are unbiased, some are biased
16
New cards
What about coefficients for confounders?
They may always be biased (there will likely always be some U for which you cannot adjust).
Confounders are not randomized.
Uncontrolled unknown confounding is possible in RCT. Careful with interpretating → table 2 fallacy.
Confounders are not randomized.
Uncontrolled unknown confounding is possible in RCT. Careful with interpretating → table 2 fallacy.