Working as a Physicist
0.0(0)
Card Sorting
1/45
Earn XP
Description and Tags
A-Level Physics topic one
Last updated 9:51 AM on 11/22/22
Name | Mastery | Learn | Test | Matching | Spaced | Call with Kai |
|---|
No analytics yet
Send a link to your students to track their progress
46 Terms
1
New cards
Validity
A measurement is valid if it measures what it is supposed to be measuring
2
New cards
True value
The value that would have been obtained in an ideal measurement
3
New cards
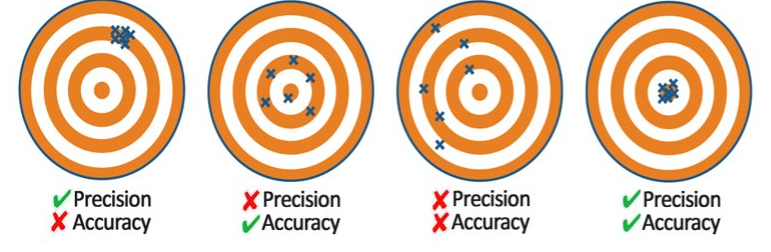
Accuracy
How close a measurement is to its true value. A measurement result is considered accurate if it is judged to be close to the true value.
4
New cards
Precision
A quality denoting the closeness of agreement (consistency) between values obtained by repeated measurement
5
New cards
Repeatability
The precision obtained when measurement results are obtained by a single operator using a single method over a short timescale. An experiment is said to be repeatable if the same person with the same equipment obtains the same result when doing the same experiment a number of times, over a short time period.
6
New cards
Reproducibility
The precision obtained when measurement results are obtained by different operators using different pieces of apparatus. An experiment is said to be reproducible if different people with different equipment, measuring the same quantity, get a similar result. This is a harder test of the quality of data.
7
New cards
Uncertainty
The range of values within which the true value can be considered to lie with a given level of confidence or probability. A quantification of the doubt about the measurement result.
8
New cards
Error
The difference between the measurement result and the true value if a true value is thought to exist. This is not a mistake in the measurement. The error can be due to both systematic and random effects and an error of unknown size is a source of uncertainty.
9
New cards
Resolution
The smallest measuring interval and the source of uncertainty in a single reading.
10
New cards
Significant figures (SF)
The number of SF used in recording the measurements depends on the resolution of the measuring instruments and should usually be the same as given in the instrument with the fewest SF in its reading.
11
New cards
SI base units
Mass-kg
Length-Metres
Time-Seconds
Current-Amps
Temp-Kelvin
Amount of Substance-Moles
Luminous Intensity-Candela
Length-Metres
Time-Seconds
Current-Amps
Temp-Kelvin
Amount of Substance-Moles
Luminous Intensity-Candela
12
New cards
acceleration unit
m/s^2
13
New cards
density
kg/m^3
14
New cards
charge
Amps * seconds
15
New cards
force
kg*acceleration
16
New cards
energy
1/2 mv^2
17
New cards
exact
10^8
18
New cards
peta
10^15
19
New cards
tera
10^12
20
New cards
giga
10^9
21
New cards
mega
10^6
22
New cards
kilo
10^3
23
New cards
deci
10^-1
24
New cards
centi
10^-2
25
New cards
micro
10^-6
26
New cards
nano
10^-9
27
New cards
pico
10^-12
28
New cards
femto
10^-15
29
New cards
atto
10^-18
30
New cards
random error
Measurements vary due to unpredictable circumstances. They cannot be corrected and
can only be mitigated by making more measurements and calculating a new mean.
can only be mitigated by making more measurements and calculating a new mean.
31
New cards
Systematic error
Measurements differ from the true value by a consistent amount each time. They can be corrected by using a different technique to take measurements and calibrating measuring instruments.
32
New cards
Precision vs Accuracy
33
New cards
Difference between Accuracy and Precision
Accurate data need to very close to the target value, but precise data need not be close to the target value. Precise data only need to be close together.
For quality purposes, accuracy is desired while precision is not. Precision is required when it is coupled with accuracy.
Accurate data can be precise but precise data may or may not be accurate. Precision is not dependent on accuracy.
For accuracy, one measurement is enough; however, for precision many measurements are required.
34
New cards
Absolute Uncertainty
± smallest significant figure
35
New cards
Percentage uncertainty
fractional uncertainty *100
36
New cards
Single readings
The uncertainty is simply a result of half the resolution of the measuring device
37
New cards
Repeated Readings
For a simple analysis we may consider the uncertainty to be half of the range in the results.
38
New cards
Combining uncertainties
is a value is put in the equation you add its uncertainty to the total uncertainty
39
New cards
reading vs measurements
reading= half resolution, no zero error
measurement=resolution, zero error so double
measurement=resolution, zero error so double
40
New cards
Displacement (distance)/time graphs
x axis=time, y axis=distance
gradient= velocity of object
area under graph= nothing meaningful
gradient= velocity of object
area under graph= nothing meaningful
41
New cards
Displacement
distance traveled in a particular direction, vector version of distance
42
New cards
Velocity
vector version of speed
43
New cards
velocity=
speed/time
44
New cards
acceleration=
(final velocity-initial velocity)/time
45
New cards
velocity/time graphs
time=x axis, velocity=y axis
gradient=acceleration of object
area under line= displacment
curved line on acceleration/time graph shows= changing acceleration= jerk (they will legit never ask you this on an exam)
acceleration going past the x axis means a change in direction
gradient=acceleration of object
area under line= displacment
curved line on acceleration/time graph shows= changing acceleration= jerk (they will legit never ask you this on an exam)
acceleration going past the x axis means a change in direction
46
New cards
Acceleration/time graphs
gradient=jerk
area under line/curve=velocity
area under line/curve=velocity