Epidemiology
0.0(0)
Studied by 11 peopleCard Sorting
1/97
Earn XP
Description and Tags
Last updated 2:29 AM on 10/30/22
Name | Mastery | Learn | Test | Matching | Spaced | Call with Kai |
|---|
No analytics yet
Send a link to your students to track their progress
98 Terms
1
New cards
Causal inference
the process of making cause-and-effect conclusions by reasoning from knowledge and factual evidence
2
New cards
Cause
• Anything that alone, or in conjunction with other
factors, affects the likelihood of an outcome.
• The science of causal inference uses methods
to distinguish causal and non-causal
associations
factors, affects the likelihood of an outcome.
• The science of causal inference uses methods
to distinguish causal and non-causal
associations
3
New cards
Association
There must be a statistical dependence
between the causal factor and effect
between the causal factor and effect
4
New cards
Time order
Cause must precede the effect
5
New cards
Direction
A change in an outcome is consequence of a
change in an antecedent factor (Asymmetry in the relationship)
change in an antecedent factor (Asymmetry in the relationship)
6
New cards
Hill's Inferential Framework
1. Strength of association
2. Temporality
3. Consistency
4. Theoretical plausibility
5. Coherence
6. Specificity in the causes
7. Biological gradient
8. Experimentation
9. Analogy
2. Temporality
3. Consistency
4. Theoretical plausibility
5. Coherence
6. Specificity in the causes
7. Biological gradient
8. Experimentation
9. Analogy
7
New cards
Strength of association
Strong associations are more likely to indicate causality than weak associations.
• Strength” depends on the metric of association: a large ratio may reflect a small difference and vice-versa
• Precision is important: a strong point estimate may not be inconsistent with a weak effect
Example:
• Incidence of lung cancer in smokers vs. non-smokers: RR = 19.4 (95% CI 18.4, 20.2)
• Incidence of colon cancer in smokers vs. non-smokers: RR = 1.4 (95% 1.1, 5.6)
8
New cards
Temporality
Exposure precedes disease/outcome in time
Some study designs are inherently better at clarifying the issue of temporality than others: RCTs and prospective cohort studies
HOWEVER…
Just because B follows A, does not of itself, confirm a causal relation:
Thunder follows lightning. Does lightning cause thunder?
Some study designs are inherently better at clarifying the issue of temporality than others: RCTs and prospective cohort studies
HOWEVER…
Just because B follows A, does not of itself, confirm a causal relation:
Thunder follows lightning. Does lightning cause thunder?
9
New cards
Consistency
Similar conclusions from diverse methods of study in different populations under a variety of circumstances
Example:
• The association between smoking and lung cancer was supported by ecological, cohort, and case control, by independent investigators, on different continents and people
Example:
• The association between smoking and lung cancer was supported by ecological, cohort, and case control, by independent investigators, on different continents and people
10
New cards
Theoretical Plausibility
There is a rational and theoretical basis for such a conclusion
• This criterion links the interpretation of epidemiological information to biological data from basic sciences
• The mechanism must be plausible in the face of known biological facts
Example:
• Biological theory of smoking causing tissue damage which over time results in cancer in the cells was a highly plausible explanation
11
New cards
Coherence
Facts stick together to form a coherent whole.
• The fit of an epidemiological estimate with results from any type of scientific research or theory.
Example:
• Epidemiologic, pharmacokinetic, laboratory, clinical, and biological data create a cohesive picture about smoking and lung cancer.
• The conclusion (that smoking causes lung cancer) “makes sense” given the current knowledge about the biology and history of the disease.
12
New cards
Specificity in the Causes
• Specificity: the exposure is linked to a specific effect or mechanism
• A cause leads to a single effect, not multiple effects
• Debatable principle and rarely used
• Example: Asbestos exposure and the development of asbestosis
• FASD and in-utero alcohol exposure
• A cause leads to a single effect, not multiple effects
• Debatable principle and rarely used
• Example: Asbestos exposure and the development of asbestosis
• FASD and in-utero alcohol exposure
13
New cards
Experimentation
• Experimental evidence supports observational
evidence
• Example: Tar painted on laboratory rabbits’
ears was shown to produce cancer in the ear
tissue over time. It was clear that carcinogens
were present in tobacco tar.
evidence
• Example: Tar painted on laboratory rabbits’
ears was shown to produce cancer in the ear
tissue over time. It was clear that carcinogens
were present in tobacco tar.
14
New cards
Analogy
• Causal inference drawn from comparison or
correspondence to other causal associations
• Sometimes a commonly accepted phenomenon in one area can be applied to another area.
• Usefulness is questionable and it is rarely used
• Example: Before the HIV was discovered, epidemiologists noticed that AIDS and Hepatitis B had analogous risk groups, suggesting similar types of agents and transmission
15
New cards
The Sufficient-Component Cause Model (Rothman)
“Causal Pie”
“Causal Pie”
A disease can have multiple
sufficient causal mechanisms
sufficient causal mechanisms
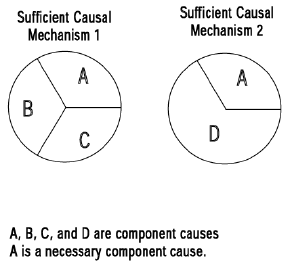
16
New cards
Sufficient cause
complete causal mechanism (minimal set of factors) that make disease inevitable.
17
New cards
Component cause
Each participating factor in a sufficient cause
Most component causes are neither
necessary nor sufficient (smoking
not necessary nor sufficient for lung
cancer)
Most component causes are neither
necessary nor sufficient (smoking
not necessary nor sufficient for lung
cancer)
18
New cards
Necessary cause
present in each causal combination of component causes
19
New cards
Contributing cause
needed in some cases
20
New cards
Causal Effect as a Counter-Factual Question
• “What if” questions.
• Extend the logic of randomized experiments to observational data.
• Example: What is the causal effect of attending private school vs. public school on high school graduation?
• Binary treatment T:
T: Attending private school (=1) vs. public school (=0)
• Potential outcomes:
• Y1: Potential outcome if attending private school
• Y0: Potential outcome if attending public school.
• For each particular individual, one can generally observe only one, but not both, of the two potential outcomes. The unobserved outcome is called the “counterfactual” outcome.
21
New cards
Epidemiology
Greek roots:
epi = upon
demos = people
logos = study
“The study of the distribution and determinants of health-related states and events in populations, and the application of this study to control health problems”
epi = upon
demos = people
logos = study
“The study of the distribution and determinants of health-related states and events in populations, and the application of this study to control health problems”
22
New cards
Population
Group of people with a common characteristic.
23
New cards
Public Health
Organized community effort to prevent disease
and promote health
and promote health
24
New cards
Illness
what a person physiologically or psychologically
experiences.
experiences.
25
New cards
Disease
a medically definable physiological or psychological dysfunction.
26
New cards
Sickness
the state of dysfunction of the social role of a
person with disease.
person with disease.
27
New cards
health
a state of complete physical, mental, and social wellbeing and not merely the absence of disease (WHO, 1948).
28
New cards
Endemic
disease and injuries occurring at a consistent rate
29
New cards
Epidemic
the occurrence of disease or injuries in clear excess of normalcy.
30
New cards
Pandemic
an epidemic that affects several countries or
continents
continents
31
New cards
Syndemic
the aggregation of two or more concurrent or
sequential epidemics or disease clusters in a population
sequential epidemics or disease clusters in a population
32
New cards
Distribution
Epidemiology is concerned with the frequency
and pattern of health events in a population.
and pattern of health events in a population.
33
New cards
Frequency
the number disease/injury events in a population and the rate or risk of disease in the population.
34
New cards
Pattern
the occurrence of health-related events by time,
place, and personal characteristics.
place, and personal characteristics.
35
New cards
Determinants
Factors that bring a change in a person’s health
• Causal factors
• Preventive factors
• Individual, environmental, and societal
• Causal factors
• Preventive factors
• Individual, environmental, and societal
36
New cards
time
includes annual occurrence, seasonal occurrence, and daily or even hourly occurrence during an epidemic.
37
New cards
Place
includes geographic variation, urban-rural
differences, and location of worksites or schools.
differences, and location of worksites or schools.
38
New cards
Personal characteristics
demographic factorssuch as age, race, sex, marital status, and socioeconomic status, as well as behaviours and environmental exposures.
39
New cards
Surveillance
monitor aspects of disease occurrence that are pertinent to effective control.
40
New cards
Uses of Epidemiology
- Study natural course of disease from onset to
resolution (Hypertension)
- Determine the extent of disease in a population
(Diabetes)
- Identify patterns and trends in disease occurrence (Asthma)
- Identify causes of disease (Outbreaks)
- Evaluate the effectiveness of measures that prevent and treat disease
resolution (Hypertension)
- Determine the extent of disease in a population
(Diabetes)
- Identify patterns and trends in disease occurrence (Asthma)
- Identify causes of disease (Outbreaks)
- Evaluate the effectiveness of measures that prevent and treat disease
41
New cards
7 Principles of Epidemiology
- Provide the *scientific basis* to prevent disease & injury and promote health.
- Determine relative importance of health needs to *establish priorities* for research and action.
- Identify population groups at *greatest risk* to *target* interventions.
- *Evaluate effectiveness* of programs in improving the health of the population.
- Study *natural history* of disease from precursor states through clinical course
- Conduct *surveillance* of disease and injury occurrence in populations
- Investigate disease *outbreaks*
42
New cards
Hippocrates (460-377 B.C.)
Idea that disease might be associated with physical environment
43
New cards
John Graunt (1620-1674)
• First epidemiologist and statistician; summarized patterns of mortality in London (Bills of Mortality)
• Discovered regularity of deaths and births, uniformity and predictability of many important biological phenomena
• Discovered regularity of deaths and births, uniformity and predictability of many important biological phenomena
44
New cards
James Lind (1716-1794)
One of the earliest experimental studies to discover the cause and prevention of scurvy (linked to diet rather than hereditary or infectious)
45
New cards
William Farr (1807 – 1883)
• Pioneer in describing states of health in a population
• Determinants of health, and measures for prevention and control of diseases.
• Determinants of health, and measures for prevention and control of diseases.
46
New cards
John Snow (1813-1858)
• Provided observational evidence that cholera was transmitted by fecal contamination of drinking water (the Broad Street epidemic, 1854).
• Almost 500 fatalities from cholera occurred within a 10-day period within 250 yards of the junction of Broad and Cambridge Street.
• Almost 500 fatalities from cholera occurred within a 10-day period within 250 yards of the junction of Broad and Cambridge Street.
47
New cards
Ignas Semmelweis (1840’s)
Pioneered hand-washing to help prevent the spread of septic infections in mothers following birth
48
New cards
Richard Doll (1912-
2005) and Austin
Bradford Hill (1887 –
1991)
2005) and Austin
Bradford Hill (1887 –
1991)
British Doctors Study (1951)
• Early research on smoking and lung cancer
• Early research on smoking and lung cancer
49
New cards
Thomas Dawber (1913-
2005) and William
Kannel (1923-2011)
2005) and William
Kannel (1923-2011)
Framingham Study, one of the most influential and longest-running studies of heart disease in the world.
50
New cards
Descriptive epidemiology
used when little is known about the disease
looks at who, what, when and where
looks at who, what, when and where
51
New cards
analytic epidemiology
used when insight about various aspects of disease are available
looks at why and how
looks at why and how
52
New cards
Uses of Descriptive Epidemiology
Study of the occurrence and distribution of disease (place, person, time)
- Provides a systematic method for characterizing a health problem
- Ensures understanding of the basic dimensions of a health problem
- Helps to identify populations at higher risk for a health problem
- Provides information used for allocation of resources
- Enables development of testable hypotheses
53
New cards
Person variables
• Age
• Sex
• Ethnicity
• Immune status
• Socioeconomic status
• Marital status
• Access to health care
• Diet
• Occupation
• Sexual history
• Travel
• Sex
• Ethnicity
• Immune status
• Socioeconomic status
• Marital status
• Access to health care
• Diet
• Occupation
• Sexual history
• Travel
54
New cards
Place variables
Does frequency of disease vary with location?
• From country to country?
• From province to province?
• Among urban and rural?
• Among cities or neighbourhoods?
• In different parts of a workplace?
• From country to country?
• From province to province?
• Among urban and rural?
• Among cities or neighbourhoods?
• In different parts of a workplace?
55
New cards
choropleth maps
maps use different shadings/colours to indicate the count/rate of cases in an area
56
New cards
spot maps
show location of individual cases
57
New cards
Time variable
Does the rate of a disease change over time?
• Has the frequency of disease changed over several decades?
• Does frequency of disease vary in a cyclic way that relates to the seasons?
• Has the disease changed over the course of days?
Usually shown as a graph
• Number / rate of cases on vertical (y) axis
• Time periods on horizontal (x) axis
Time period will depend on what is being described
Used to show trends, seasonality, day of week / time of day, epidemic period
58
New cards
Secular change
characteristic related to time
(long-term)
(long-term)
59
New cards
point epidemics
short-term spread of disease
60
New cards
Cyclic trends
A cyclical process is one in which a series of events happens again and again in the same order.
61
New cards
seasonal variations
Seasonal variation is variation in a time series within one year that is repeated more or less regularly. Seasonal variation may be caused by the temperature, rainfall, public holidays, cycles of seasons or holidays.
62
New cards
denominator data
A definition of the population at risk
• Ex: Smokers at risk for lung cancer
• Population at risk for perinatal diseases
• Residents in a city
• Ex: Smokers at risk for lung cancer
• Population at risk for perinatal diseases
• Residents in a city
63
New cards
Numerator Data
A definition of the events or conditions of interest
• Ex: Lung cancer
• Preterm birth
• Internet access
• Ex: Lung cancer
• Preterm birth
• Internet access
64
New cards
Census
• Complete collection, and compilation of demographic, economic, and social data pertaining to a specific time or times to all persons in a country or delimited territory
• Collected at regular intervals
• Collected at regular intervals
65
New cards
Census advantages
- Good estimate of population size
- Provides a relatively complete picture as Census is mandatory
- Provides a relatively complete picture as Census is mandatory
66
New cards
Census disadvantages
- Incompletely enumerated reserves and settlements
- DA to postal code linkage is not always 100% accurate
- Data quality and breadth dropped with the 2011 Census (but hopefully things have changed! )
- DA to postal code linkage is not always 100% accurate
- Data quality and breadth dropped with the 2011 Census (but hopefully things have changed! )
67
New cards
Ontario vital statistics
- Ontario births
- Ontario marriages
- Ontario deaths
- other sources
- Ontario marriages
- Ontario deaths
- other sources
68
New cards
Registries
Tracks all occurrences of type of disease or condition or category of disease or condition
- Birth defects
- Perinatal Database
- Cancer
Limitation: Cooperation of agencies and medical facilities as well as adequate funding.
- Birth defects
- Perinatal Database
- Cancer
Limitation: Cooperation of agencies and medical facilities as well as adequate funding.
69
New cards
Administrative health data
- Health or health services information “for some administrative purpose (e.g., billing), but not primarily for research or surveillance purposes”.
- Typically used for operational, rather than for research
purposes.
- Passive (involuntary - Has to be collected no matter what (as opposed to active which involves actively searching for participants)).
- Under the Health Information Act, individual consent is not required.
- Typically used for operational, rather than for research
purposes.
- Passive (involuntary - Has to be collected no matter what (as opposed to active which involves actively searching for participants)).
- Under the Health Information Act, individual consent is not required.
70
New cards
Deterministic data linkage
looking for exact matching on a number of identifiers/merged variables
71
New cards
Probabilistic data linkage
uses conditional probability that identifiers on different records will match; linked "declared" only when score is above a subjective threshold
72
New cards
limitations of administrative health data
virtually all data collected for the ministries is for administrative purposes, such as management of the provincial health care insurance plan;
Data elements collected may change over time. Some data elements currently available may be unavailable in early years (vice versa)
accuracy and consistency of recording/coding
Data elements collected may change over time. Some data elements currently available may be unavailable in early years (vice versa)
accuracy and consistency of recording/coding
73
New cards
How can administrative health data be used for epidemiological research
- disease surveillance
- events from multiple sources
- identification of first time incident events
- etiologic research
- longitudinal follow-up of cohorts
- health care utilization for a given disease
- adverse outcomes/complications of care
- economic outcomes (e.g. LBW babies and costs associated with survival)
- prognostic research
- survival improvements when therapy changes
74
New cards
new opportunities for epidemiological research using health data
- linkage with other data beyond the health sector
- linkage with survey/census data
- birth cohorts and prospective updates
- cross-cohort harmonization studies
- comparative effectiveness
- big data
- linkage with survey/census data
- birth cohorts and prospective updates
- cross-cohort harmonization studies
- comparative effectiveness
- big data
75
New cards
closed (or fixed) population
Permanent membership;
- ends only by death
- defined by an event
Example: atomic bomb survivors; people who were in the WTC on September 11. This population will never gain new members.
- ends only by death
- defined by an event
Example: atomic bomb survivors; people who were in the WTC on September 11. This population will never gain new members.
76
New cards
Dynamic/Open population
transient membership, determined by a changeable state. An individual is a member of the population as long as it has the transient state/characteristic (e.g., living in Ontario).
may gain and lose members over time because of migration, birth, death
may gain and lose members over time because of migration, birth, death
77
New cards
Steady state
the number of people leaving the population is equal to the number of those entering the population.
78
New cards
How do we measure the occurrence of disease in a population?
case count / population size
* case count is the number of people affected by the disease
* case count is the number of people affected by the disease
79
New cards
ratio
Division of two unrelated numbers
80
New cards
proportion
Division of two related numbers; numerator is a subset of the denominator
81
New cards
ratio
Division of two numbers; time is always in denominator
82
New cards
incidence
• measures the occurrence of NEW disease events.
• For diseases that occur more than once, it usually measures the first occurrence of the disease.
• New cases of the disease are measured in a population who is at risk of getting the disease.
• takes into account the specific amount of time that members of the population are followed until they develop the disease.
• deals with the transition from health to disease so time must pass for this change to occur and be observed.
o It is useful to evaluate the effectiveness of programs that try to prevent disease from occurring in the first place.
o The incidence risk provides good evidence for studying causality when the condition of interest is relatively uncommon and the population is static, because the population at risk at the start is not very different from the population at risk of developing the disease. In a dynamic population, with many people entering or leaving, or where the condition under study is common, the incidence rate is preferred. This is because this measure accounts for the time that the subjects in the population spend at risk of developing the condition, either in the population where many people enter or leave, or as part of the non-disease group when the condition is common.

83
New cards
Cumulative incidence (also known as incidence risk)
Proportion of a candidate population that becomes diseased over a specified period of time.
Numerator is a subset of the denominator. Time is not integral part of this proportion.
Average risk of getting a disease over certain period of time. It is commonly used in fixed populations with small losses to follow-up and the candidate population has been followed for a specified time period.
Numerator is a subset of the denominator. Time is not integral part of this proportion.
Average risk of getting a disease over certain period of time. It is commonly used in fixed populations with small losses to follow-up and the candidate population has been followed for a specified time period.
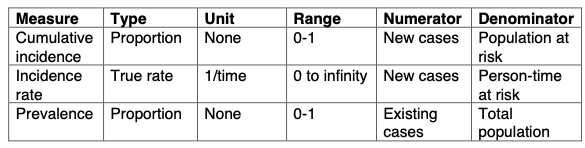
84
New cards
incidence rate
Occurrence of new cases of disease that arise during person-time observation.
The numerator is the same as the cumulative incidence but the difference between the two measures lies in the denominator.
Incidence rate includes time in the denominator and it is a TRUE rate.
The numerator is the same as the cumulative incidence but the difference between the two measures lies in the denominator.
Incidence rate includes time in the denominator and it is a TRUE rate.

85
New cards
prevalence
measures the frequency of EXISTING disease. *It is the proportion of the total population that is diseased*. There are two types of prevalence measures:
1. point prevalence
2. period prevalence
Prevalence is influenced by the occurrence of new cases (incidence, I) and the duration of each case (D): *P= I x D*
o Useful for evaluating healthcare needs and planning health service provision.
o Particularly important for chronic conditions.
o Prevalence obscures causal relationships because it combines incidence and survival, so it is not good for studies of causality.

86
New cards
point prevalence
proportion of the population that is diseased at a single point in time (like a single snapshot of the population)
87
New cards
period prevalence
proportion of the population that is diseased during a specified duration of time (e.g., 1 yr). The numerator for period prevalence includes cases present at the start, as well as incident cases which arose during the period of interest.
88
New cards
Crude mortality (or death) rate
Total number of deaths from all causes per 100,000 population per year. Crude means that rate is based in raw data, with no adjustments.
89
New cards
Cause-specific mortality rate
Number of deaths from a specific cause per 100,000 population per year.
90
New cards
Age-specific mortality rate
Total number of deaths from all causes among individuals in a specific age category per 100,000 population per year in the age category
91
New cards
Years of potential life lost
Number of years that an individual was expected to live beyond death.
92
New cards
Livebirth rate
Total number of livebirths per 1,000 population per year
93
New cards
Infant mortality rate
Number of deaths of infants less than 1 yr of age per
1,000 livebirths per year.
1,000 livebirths per year.
94
New cards
Birth defect rate:
Number of children born with defects per 10,000 births
95
New cards
Morbidity rate
Number of existing or new cases of a particular disease or
condition per 100 population
condition per 100 population
96
New cards
Attack rate
Number of new cases of disease that develop (usually in a
short time period) per the number in a healthy population at risk at the start of the period. Usually reserved for outbreaks.
short time period) per the number in a healthy population at risk at the start of the period. Usually reserved for outbreaks.
97
New cards
Case fatality rate
Number of deaths per number of cases of disease
98
New cards
Survival rate
Number of living cases per number of cases of disease.