market research descriptive statistics
1/23
There's no tags or description
Looks like no tags are added yet.
Name | Mastery | Learn | Test | Matching | Spaced | Call with Kai |
|---|
No analytics yet
Send a link to your students to track their progress
24 Terms
coding
process of grouping and assigning numeric codes to various responses to question
data entry
process of converting information to electronic format
after collecting data, what next?
data editing
coding
statistically adjusting data
data editing
identifies omissions, ambiguities, and errors in responses
problems identified with data editing
interviewer error
omissions
ambiguity
inconsistencies
coding
closed ended questions involves specifying how responses are to be entered
assigning numeric value to responses
open ended questions are difficult to ____
lengthy list of possible responses is generated
mean
average
median
score in middle
order values from small to large
measures for dispersion
describe spread of data or variation around the mean
variance
average squared difference
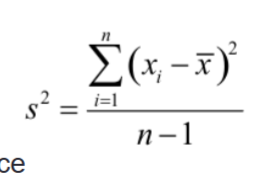
standard deviation
square root of variance
range
largest val - smallest val
continuous variable
subject or observation takes value from interval of real numbers. for example, if weight can be measured preciseley enough it takes any value from 0 upwards
discrete or categorical variable
subjects or observations can be categorized. for example, vote choice is discrete variable since there is limited set of parties or candidates to vote for
you cannot report means, std deviations, etc for ______ & _____ variables
nominal
ordinal
nominal & ordinal
proportions (= percentages), counts, or frequency tables
interval and ratio scales
mean, median, sd, variance, range
descriptive statistics
make data usable
describe results from survey
inferential statistics
generalize results to a population
managerial decisions: are for population, not sample
population parameters
summary descriptions f variables of population
parameter denotes ‘ true value’ from census rather than sample
sample statistic
summary description of variable of sample
used as estimate for population parameter
how can data be summarized? descriptive statistics
numerical summaries
central tendency (mean, median)
measure if dispersion
graphical summaries
frequency distribution
histogram
charts
nominal and ordinal graph
frequency tables, bar chart, pie chart
interval and ratio graph
histogram