Chapter 7: Sampling Distributions
1/66
Earn XP
Description and Tags
AP Statistics | 2024-2025
Name | Mastery | Learn | Test | Matching | Spaced |
|---|
No study sessions yet.
67 Terms
What is a statistic?
a number that describes some characteristic of a sample
What is a parameter?
a number that describes some characteristic of the population
What is estimated by x̄, the sample mean?
µ, the population mean
What is estimated by p̂, the sample proportion?
p, the population proportion
What is estimated by sx, the sample standard deviation?
σ, the population standard deviation
Why is a sample statistic sometimes called a point estimator of the corresponding population parameter?
because the estimate is a single point on the number line
What does N represent?
population size
What does n represent?
sample size
What does x̄ represent?
sample mean
What does µ represent?
population mean
What does s represent?
sample standard deviation
What does σ represent?
population standard deviation
What does p represent?
population proportion
What does p̂ represent?
sample proportion
What is sampling variability?
the concept that different random samples of the same size from the same population produce different values for a statistic
What is the sampling distribution of a statistic?
the distribution of values taken by the statistic in all possible samples of the same size from the same population
How do we make sense of sampling variability?
by asking what would happen if we took many samples
How do you get a sampling distribution?
by taking every one of the possible samples of size n from a population, calculated the sample proportion for each, and graphed all of those values
What is the purpose of a sampling distribution?
to determine what values count as usual and unusual
What does the distribution of a population do?
it gives the values of the variable for all individuals in the population
What does the distribution of a sample do?
it shows the value of the variable for the individuals in a sample
What does the sampling distribution of a sample statistic do?
it displays the values of p̂ for all possible samples of the same size
When is a statistic an unbiased estimator of a parameter?
if the mean of its sampling distribution is equal to the value of the parameter being estimated
Where does an unbiased estimator appear on a graph?
centered at the true population parameter
What is a biased estimator?
an estimator that is consistently high or low; “systematically” over- or underestimating
How do you get a trustworthy estimate of an unknown population parameter?
by using a statistic that’s an unbiased estimator so you don’t tend to overestimate or underestimate
True or false: using an unbiased estimator guarantees that the value of your statistic will be close to the actual parameter value
false
Why do larger samples have a clear advantage over smaller samples?
because they are much more likely to produce an estimate close to the true value of the parameter
True or false: the variability of a statistic in repeated sampling does not depend very much on the size of the population
true
How can you reduce the variability of a statistic?
by increasing sample size and improving design
What effect does the size of the population have on the variability of a statistic?
population size (N) has very little effect as long as the 10% condition is met
What does bias mean?
our sample values do not center on the population value
What does high variability mean?
repeated samples do not give very similar results
What is the difference between accuracy and precision?
accuracy means unbiased and precision means low variability
When is the sampling distribution of p̂ skewed to the right?
when n is small and p is close to 0
When is the sampling distribution of p̂ skewed to the left?
when n is small and p is close to 1
When does the sampling distribution of p̂ become more Normal?
when p is closer to 0.5 or n is larger or both
Why does it make sense for the mean of the sampling distribution p̂ to be equal to the population proportion of P?
because the sample proportion p̂ is an unbiased estimator of p
What is the value of σ dependent on?
both n and p
When is the standard deviation of a sampling distribution larger?
if the value of p is closer to 0.5
When is the standard deviation of a sampling distribution smaller?
if the value of p is closer to 0 or 1
What happens to the value of (SD little p-hat) as n gets larger?
it gets smaller
What does multiplying the sample size by 4 do to the standard deviation?
it gets cut in half
What is the mean of the sampling distribution of p̂?
p̂ = p
What is the standard deviation of the sampling distribution of p̂?
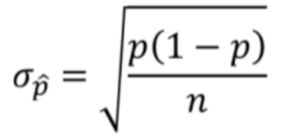
What is the 10% condition?
n ≤ 0.10N
What does the value σp̂ measure?
the typical distance between a sample proportion p̂ and the population proportion p
When is the sampling distribution of p̂ approximately normal?
if the Large Counts condition is satisfied
What is the Large Counts condition?
np ≥ 10 and n(1 - p) ≥ 10
What happens if we assume that the sampling distribution of p̂ is approximately Normal when it isn’t actually?
any calculations made using a Normal distribution will be flawed
What happens assume that the sampling distribution is independent when it isn’t actually?
the actual standard deviation will be smaller than the value given by the formula
What can we use a Normal distribution to do?
estimate the probability of obtaining an SRS in which p̂ lies in a specified interval of values
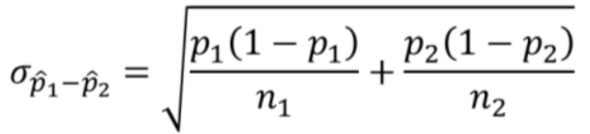
When is the sampling distribution of p̂1 - p̂2 approximately Normal?
if the Large Counts condition is met for both samples:
n1p1 ≥ 10
n1(1 - p1) ≥ 10
n2p2 ≥ 10
n2(1 - p2) ≥ 10
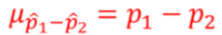
What is the mean of the sampling distribution p̂1 - p̂2?
What is the standard deviation of the sampling distribution p̂1 - p̂2?
What does the sampling distribution of the sample mean x̄ describe?
the distribution of values taken by the sample mean x̄ in all possible samples of the same size from the same population
What is the mean of the sampling distribution of x̄?

What is the standard deviation of the sampling distribution of x̄?
as long as the 10% condition is satisfied
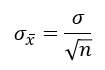
What does the value σ of x̄ measure?
the typical distance between a sample mean x̄ and the population mean µ
How do you interpret σ of x̄?
“In SRSs of size [n]. the sample mean [x-variable] will typically vary by about [µ of x̄] from the true mean of [mu]
What is the standard deviation of the sampling distribution of x̄ when we sample with replacement?
exactly the value given by the formula

What is the standard deviation of the sampling distribution of x̄ when we sample without replacement?
When is the formula for the standard deviation of the sampling distribution of x̄ nearly correct?
What is the shape of the sampling distribution of x̄ when the population distribution is Normal?
that when n is large, the sampling distribution of the sample x̄ is approximately Normal
What is the shape of the sampling distribution of x̄ when the population distribution is not Normal?
approximately Normal when the sample size is large (n ≥ 30)
the sampling distribution of x̄ will retain some characteristics of the population distribution (e.g. skewedness)