stats ch. 10 and 11 vocab
1/20
Earn XP
Description and Tags
one month remaining
Name | Mastery | Learn | Test | Matching | Spaced | Call with Kai |
|---|
No analytics yet
Send a link to your students to track their progress
21 Terms
chapters 10, 11, and 4
Chapter 10
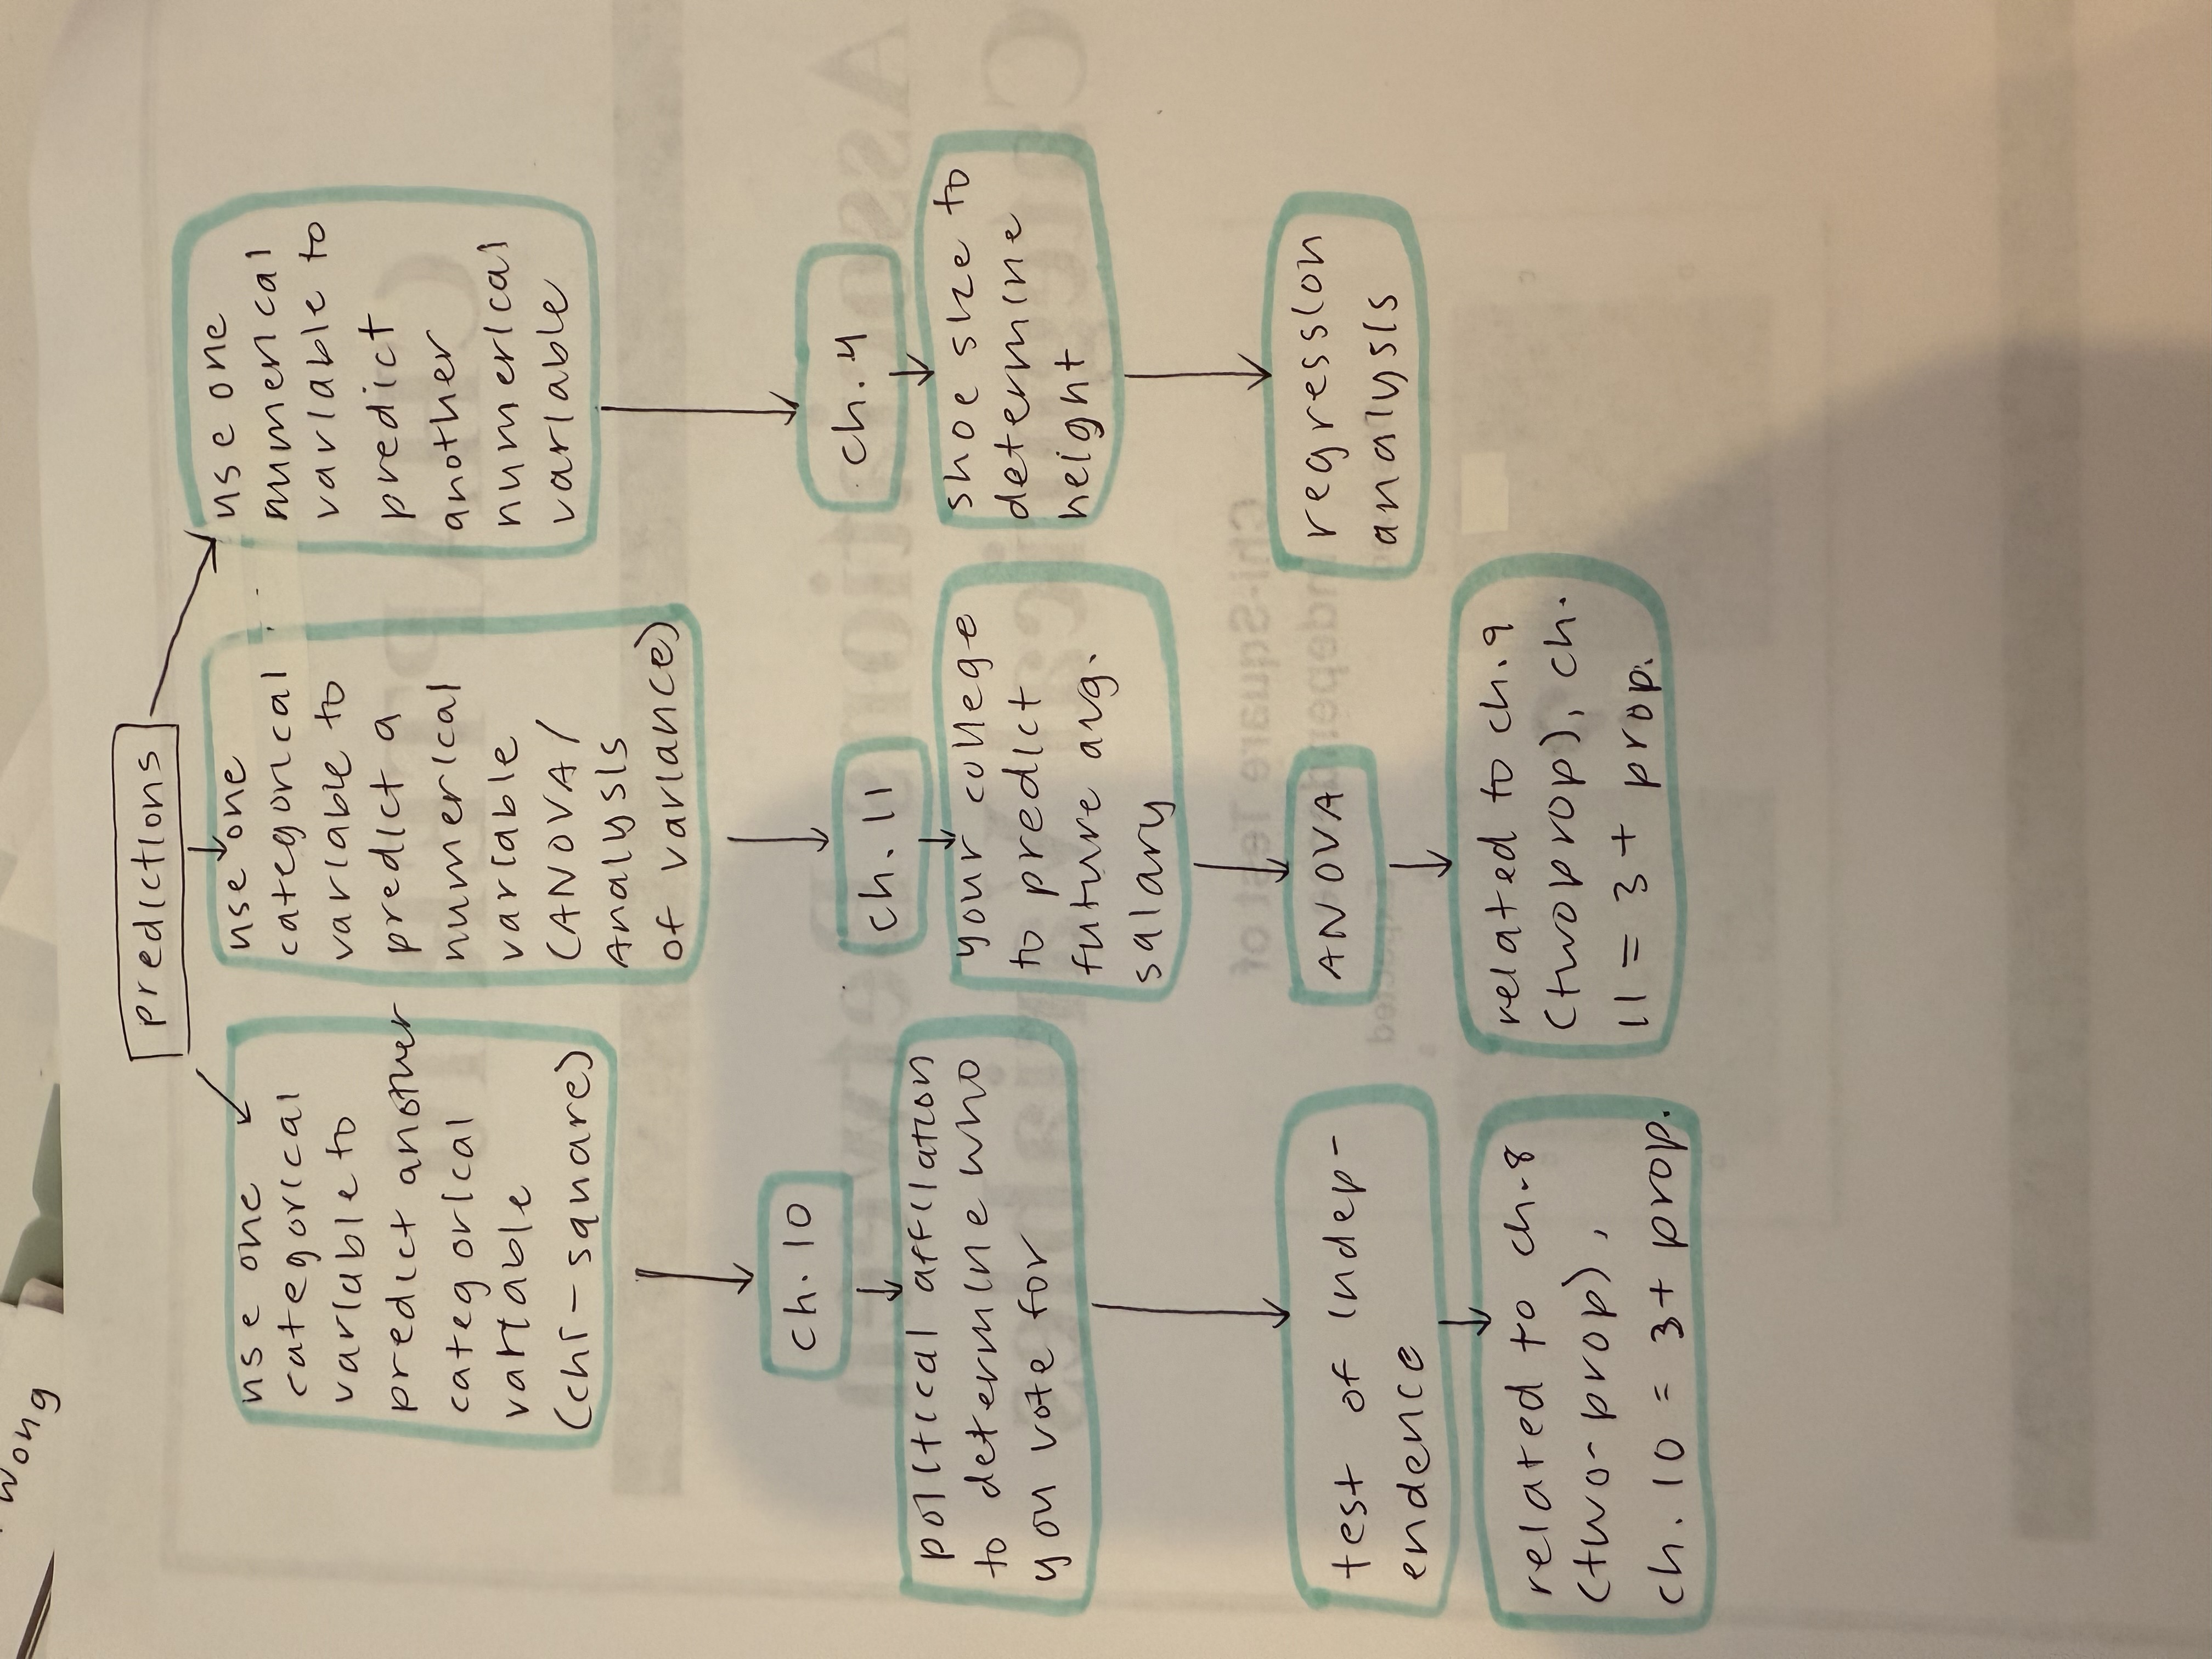
I have a paper flowchart for this, please refer to it under “Chapter 10” packet for convenience
What are categorical variables?
Places people into one of several categories (young, old, yes, no, zipcode, phone #, student ID)
“Qualitative variables”
What are contingency tables?
Two-way tables that organize two categorical variables and show many times each combination of categories occurs
Var #1 in rows, Var #2 in columns (column = what you want to predict)
The numbers are “observed counts.” It does NOT make the values numerical as long as the table is [category] vs. [category].
What are expected counts?
Frequencies we would expect to see if our assumptions (null hypothesis) = true
Calculated by (row total x column total) / grand total → equation available in TI-84 under PRGM 1: EXPCTDCT
If you already have the expected rate: (sample size) x (rate in %)
What is the chi-square (x²) statistic?
Measures the amount that our expected counts differ from observed counts
Calculated by: (observed count - expected count)²/expected count + repeat for each observed count and add them all up
Always a positive number
What is the chi-square (x²) distribution?
Probability of obtaining a x² statistic as extreme or more extreme than the one observed
Right-skewed and allows only positive values. The less degrees of freedom, the more skewed it will be.
P-value is shaded to the right of the x² number on the graph.
What is a goodness of fit test?
A kind of hypothesis test that evaluates whether the results from a situation/experiment match with the expectation (null hypothesis is yes)
ONE categorical variable with 3+ categories
What are the four steps of a Goodness of Fit Test?
Write null and alternative hypothesis (H0 = population is same as expected; HA = distributions are different)
State significance level, verify random sample, independent observations, and large sample size (E ≥ 5)
STAT → Edit → enter observed counts in L1, expected counts in L2 (expected counts are given) → STAT → TESTS → D: x²GOF-Test → enter observed in L1, expected in L2 → df is (# of categories - 1) → report x² and p-value
Reject/fail to reject the null. Same criteria as hypothesis test: compare to significance level (usually 0.05)
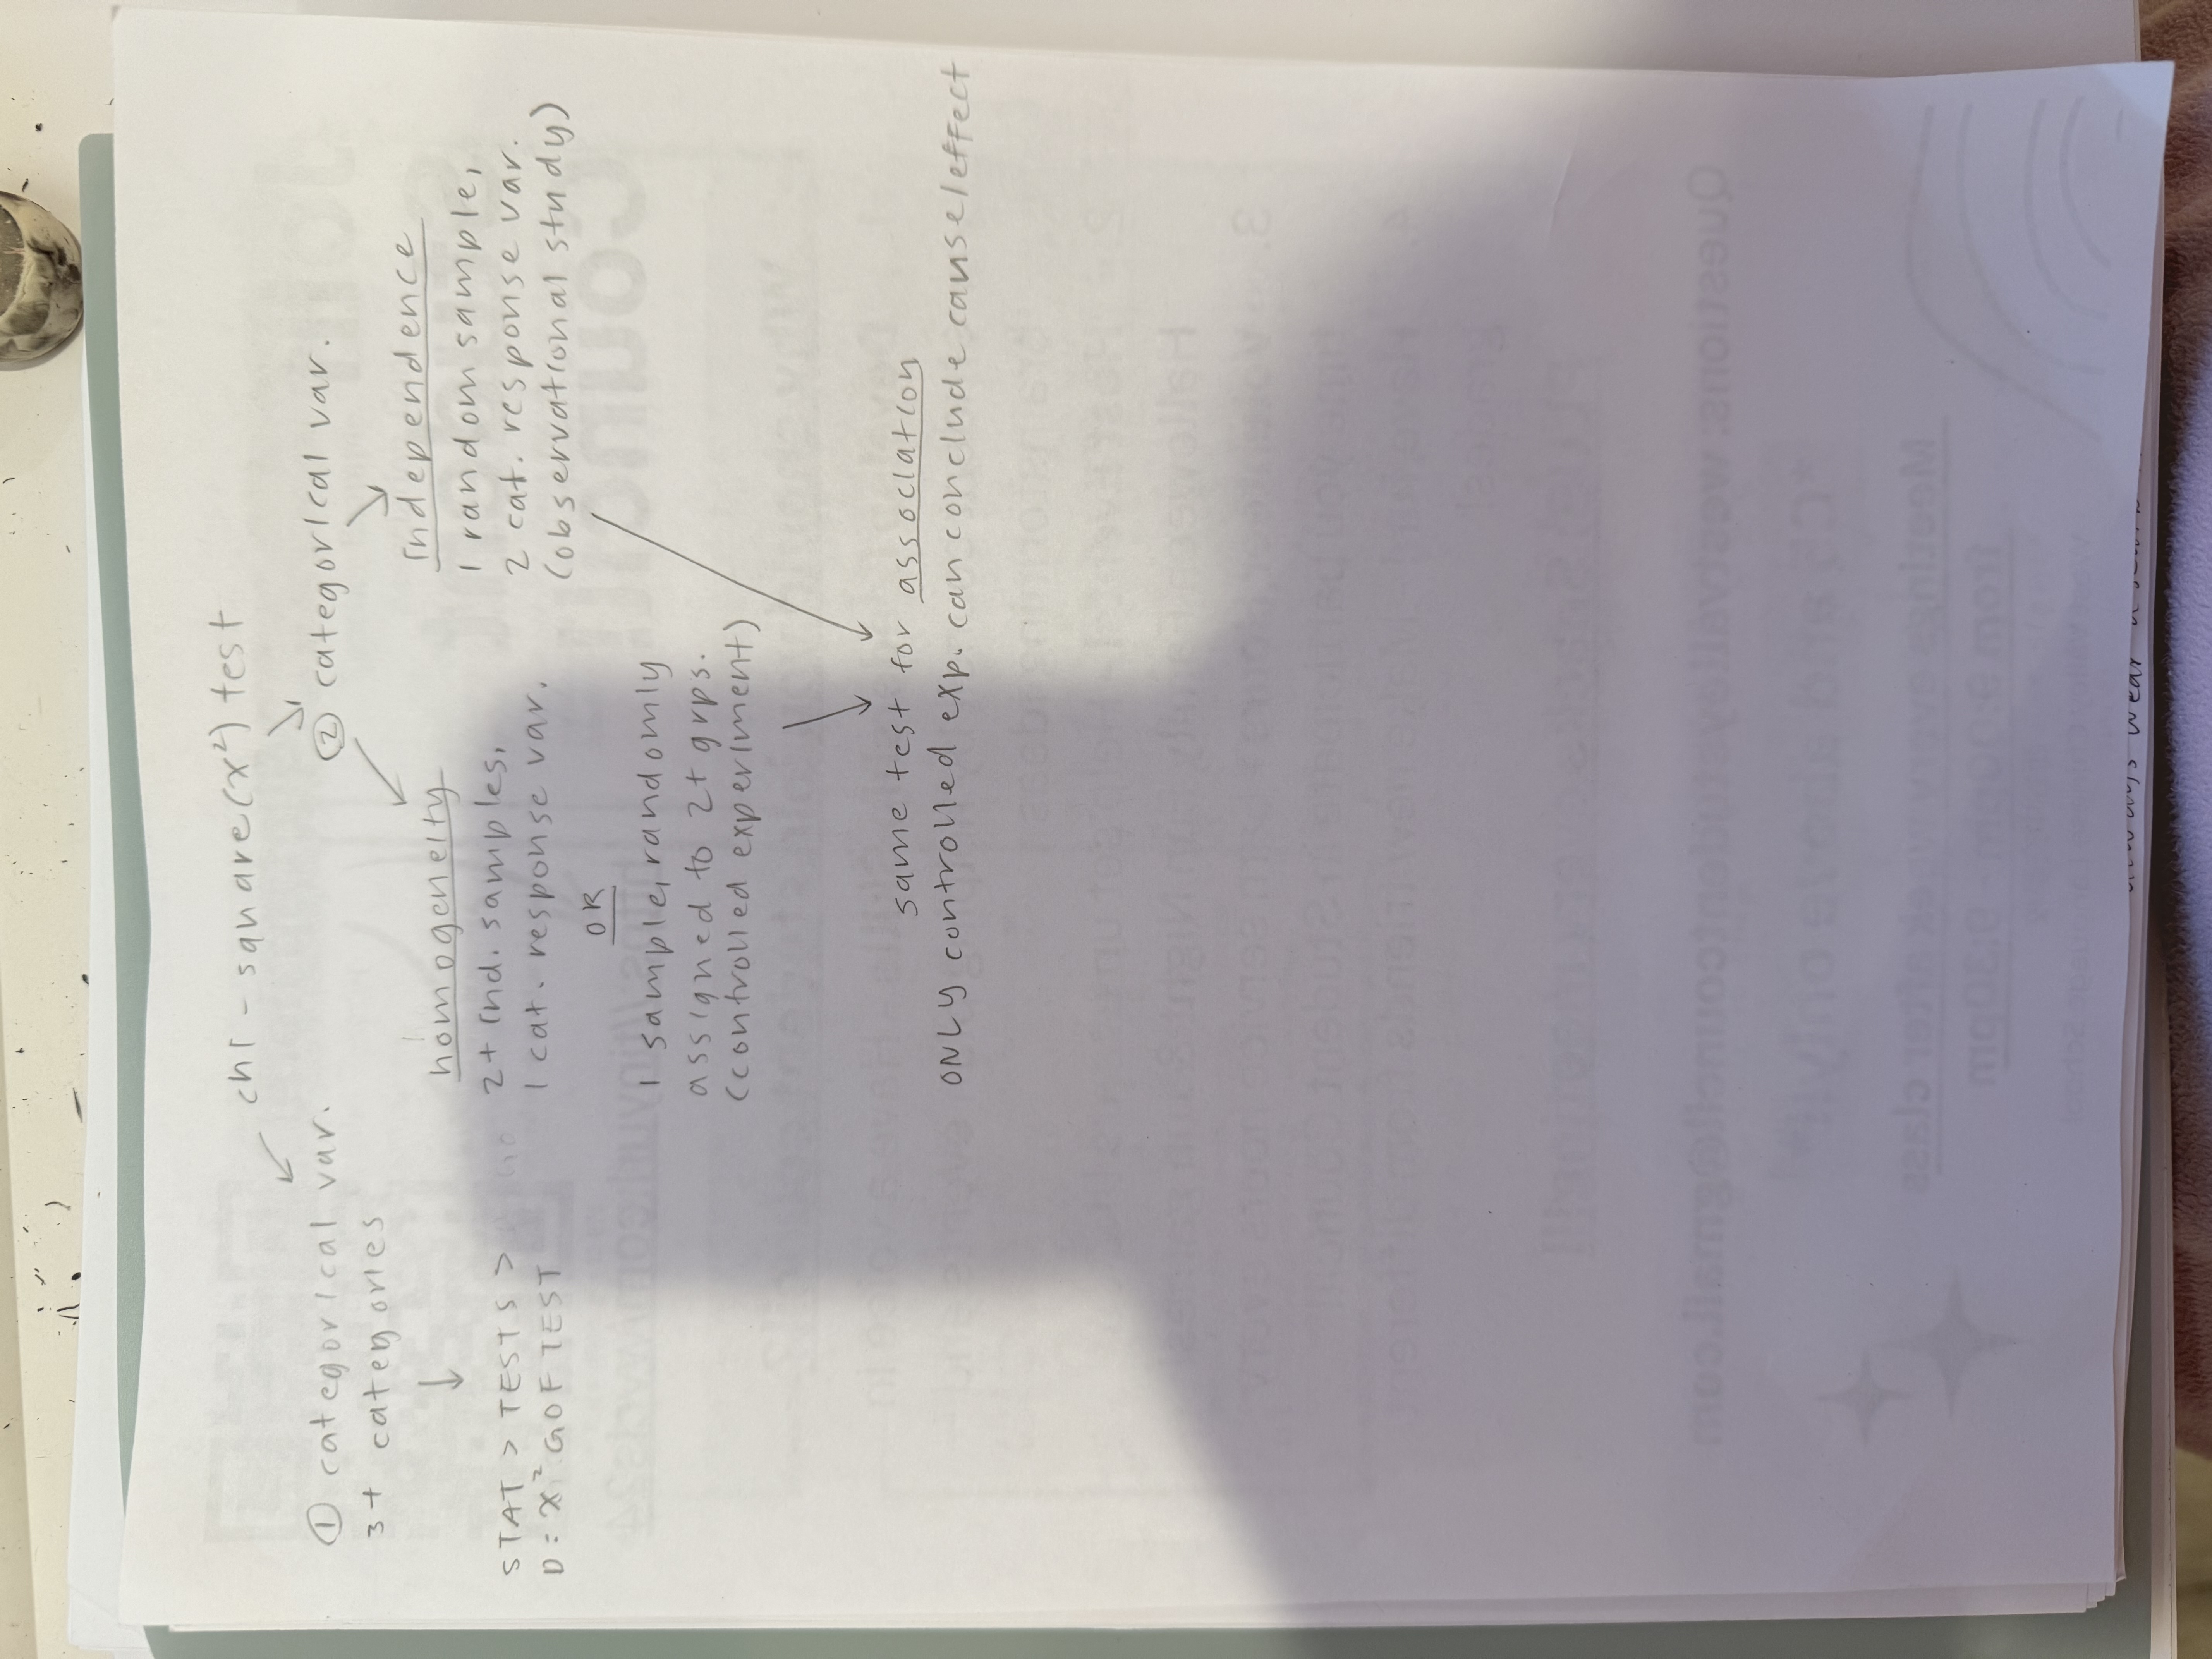
What is a chi-square test for association?
Checks whether TWO categorical variables are independent or associated
Observational studies can determine association. ONLY experiments can determine causality.
Test of homogeneity vs. test of independence
Homogeneity: 2+ independent samples and 1 categorical response variable, or 1 sample and randomly assign the individuals to 2+ groups
Independence: 1 random sample and 2 categorical response variables
Both test for association
What are the 4 steps for a test of association?
Write null and alternative hypothesis (H0 = variables are independent/no association/no prediction ability; HA = variables are dependent/is association/ability to predict).
State significance level, verify random sample, independent observations AND samples, and smallest expected count in the matrix in [STEP 3] is at least 5
2nd → (x-1) MATRIX → EDIT → 1 → enter data → 2nd →(x-1) MATRIX → EDIT → 2 → make it look like Matrix A
Then: STAT → Tests → C: x²-test → Observed = [A], Expected = [B] → report x² and p-value
Then: 2nd → (x-1) MATRIX → 2: [B] → verify all numbers are at least 5
Reject/fail to reject the null (same criteria as hypothesis test: compare to significance level, if lesser, then reject)
What are the special characteristics and limitations of a test of association?
If both categorical variables have only 2 categories, the test of homogeneity is identical to a 2-tailed test of 2 proportions
In test of independence, df = (# rows - 1) x (# columns - 1)
CON: The tests tell us if 2 variables are associated but don’t tell us how they’re associated
What is ANOVA used for?
Testing 3 or more population means & the variance between and within them
Tests whether there is an association between a categorical and numerical variable
Compares the variation between groups to variation within the groups
How do you know if a question topic is eligible for ANOVA or not?
If the variable of interest they are finding can be answered as a number (eg. cost of a gallon of gas), then there is an numerical variable. That way you know— if there’s one numerical variable and one categorical variable with 3+ means, you can use ANOVA.
If the question topic can only be answered with yes/no (eg. proportion of people who use public transportation: “do you use public transportation? yes/no?”), then there is no numerical variable. That would be 2 categorical variables or 2 numerical variables, and you would either use chi-square (categorical) or linear regression model (numerical).
What is the F-statistic?
Test statistic for ANOVA test
Computed by (variation between groups/variation within groups)
Large F means more variation between groups than within them & discredits the null hypothesis of equal means
What are characteristics of the F-distribution?
Right-skewed
Always positive because standard deviation is always positive
2 degrees of freedom, one for number of categories and one for number of observations
Smaller degree of freedom → more skew
What are the 4 steps for conducting an ANOVA test?
Write null and alternative hypothesis (H0 = no association/no predictive ability/μ1 = μ2 = μ3 = … μk /all means are the same; HA = there is an association/predictive ability/at least one of the means is not equal to another).
There are no numbers. The hypotheses just question if there’s an association between the cat. and num. variable or not.
State significance level, verify random sample, independent observations AND samples, equal variance (largest SD/smallest SD < 2) NEW!!!, normal distribution (given or each n ≥ 25)
STAT → Edit → Enter sample data in L1/L2/L3, STAT → Tests → H: ANOVA (L1, L2, L3) → Report f-test statistic and p-value
Reject/fail to reject the null. If p-value is smaller than significance level, reject the null and know at least one mean is sig. diff. from the others.
Interpret: There is (significant/not significant) evidence of an association between ____ and ____ (p-value = ____).
How do you calculate the standard deviation (to determine if there’s equal variance) if you’re only given the raw data?
Enter data in L1/L2/L3 → STAT → Calc → 1: 1-Var Stats → Use Sx → largest standard deviation in all the lists / smallest standard deviation → see if it’s less than 2, if yes, you can continue. If not, can’t use ANOVA
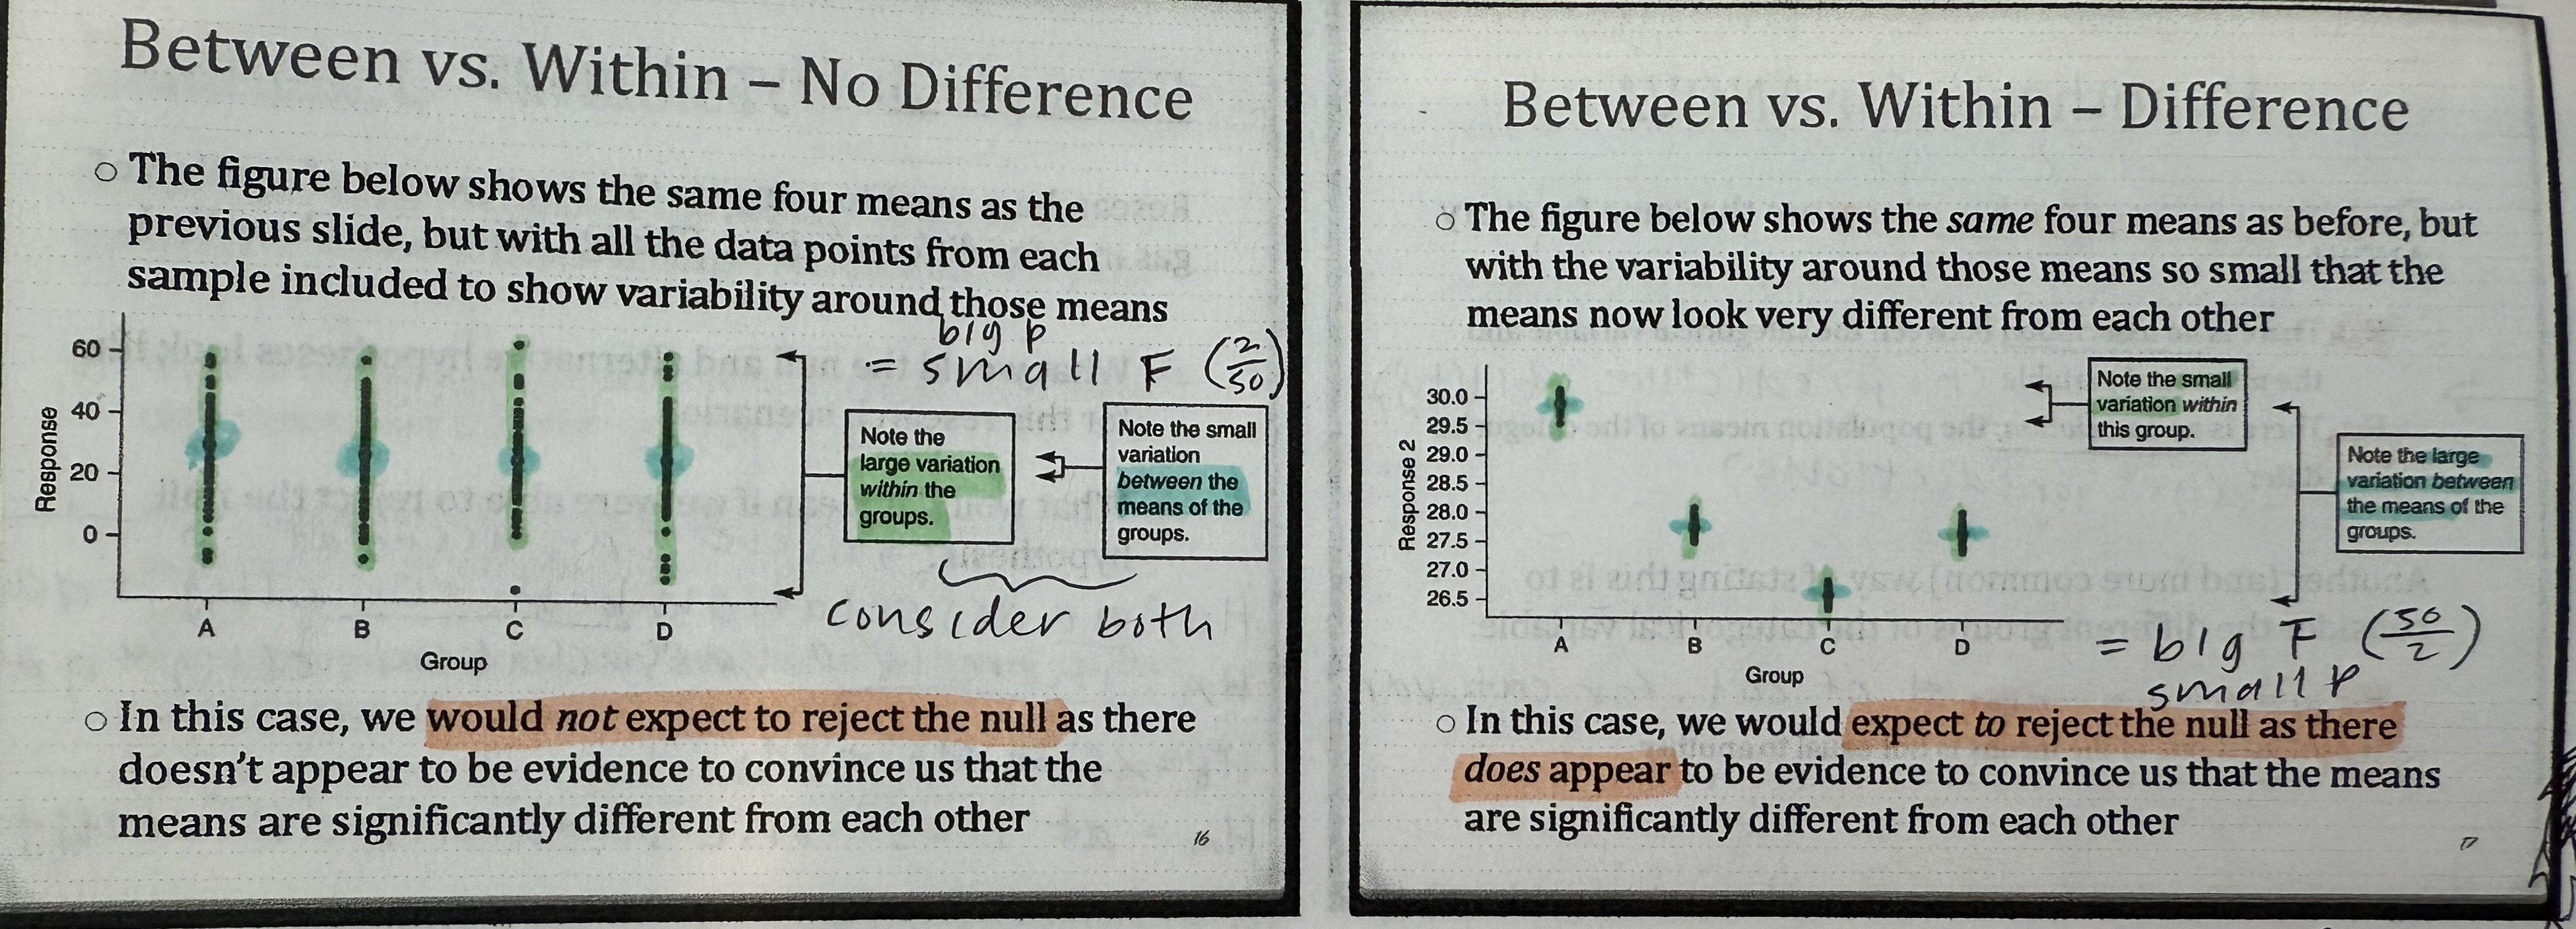
How do you know whether or not to reject the null based on how the graphs / data points look?
Don’t reject: Large variation within groups + small variation between the means of the groups → big p-value → small F-statistic → means not significantly different
Reject: Small variation within groups + big variation between the means of the groups → big F-statistic → small p-value → means are significantly different
*you know F-statistic is “big” if it’s in the tens or twenties
What are the limitations of ANOVA?
Tells you one of the means is different, but not which one