Confidence Intervals Unit 5
1/24
Earn XP
Description and Tags
Name | Mastery | Learn | Test | Matching | Spaced | Call with Kai |
|---|
No analytics yet
Send a link to your students to track their progress
25 Terms
Confidence Interval Rule
The larger your confidence, the wider the interval (the more narrow the interval, the lower the confidence)
Statistical inference
Provides methods of drawing conclusions about a population from sample data; in formal inference, we use PROBABILITY to express the strength of our conclusions about a population from sample data
CL
Confidence Level
If the confidence procedure was repeated many times,
CL% of the resulting confidence intervals would contain the population mean
A level C confidence interval for a parameter has two parts:
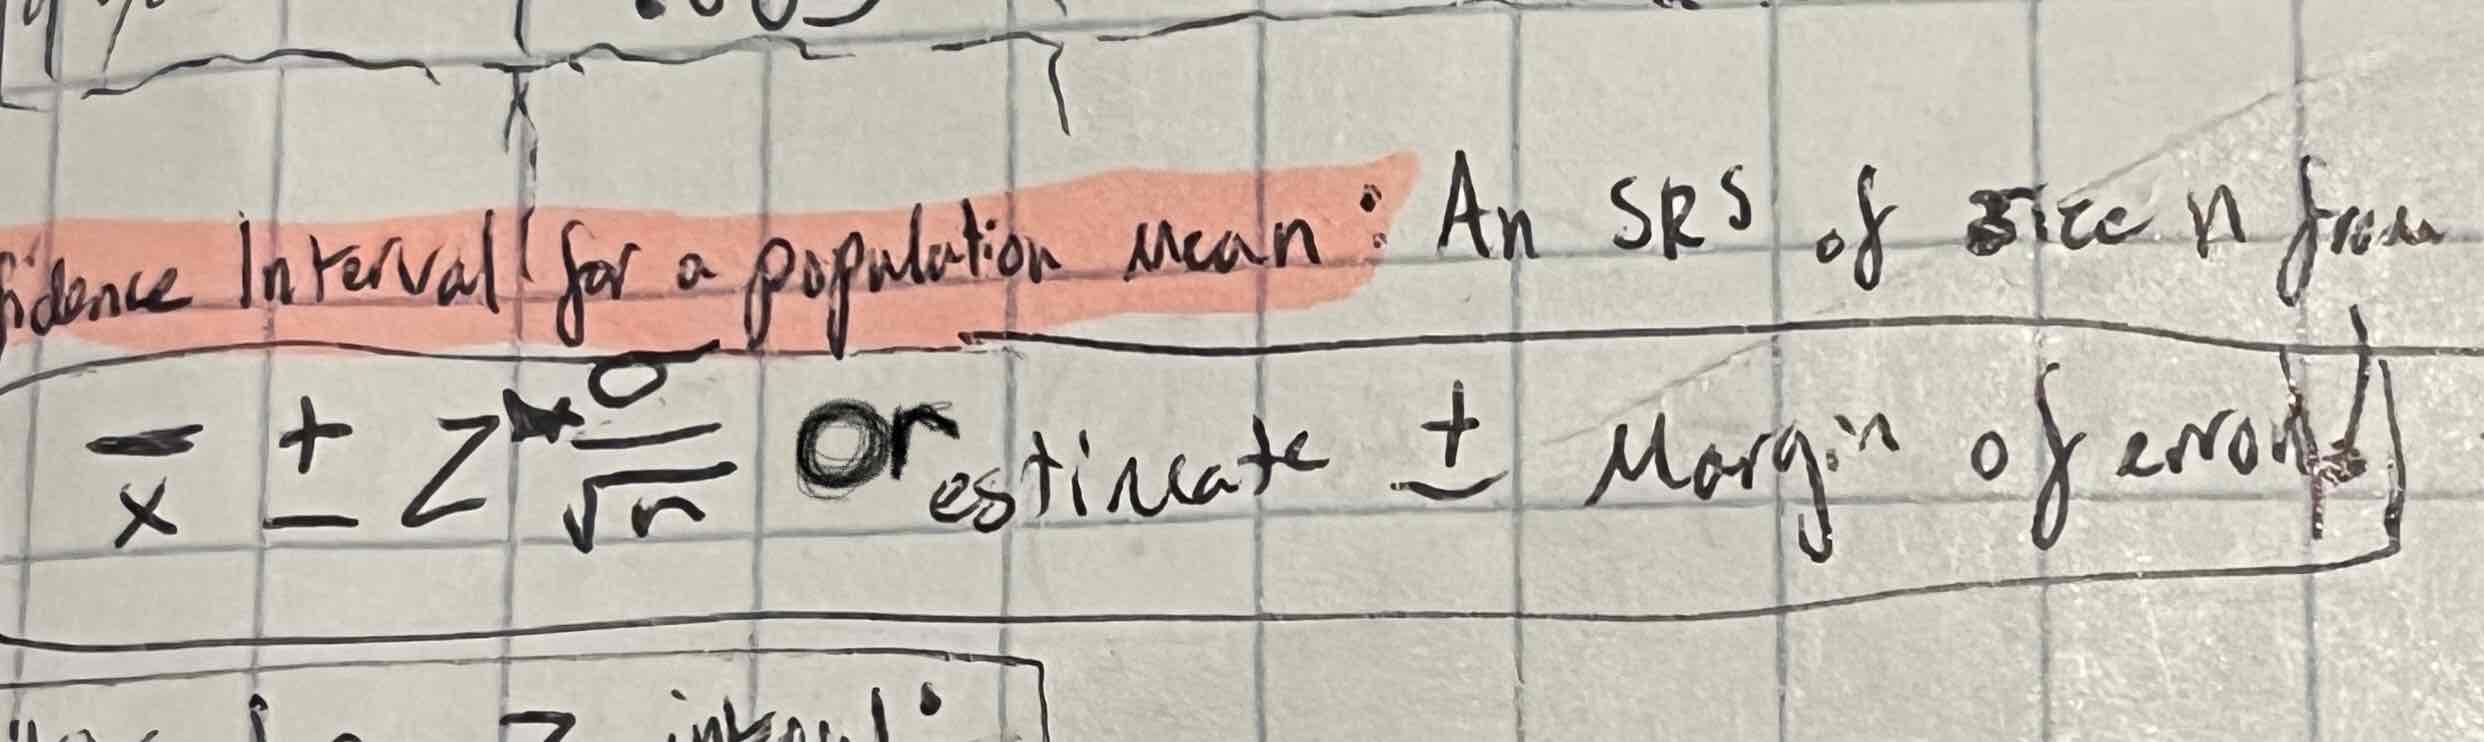
An interval calculated from the data, usually out of the form estimate ± margin of error
A confidence level C, which gives the probability that the interval will capture the true parameter value in repeated samples
Constructing a confidence interval (the construction of a confidence interval for a population mean mu is appropriate when)
The data comes from an SRS from the population of interest
The sampling distribution of x-bar is approximately normal (if the population is normal or CLT for x-bar; rules of thumb for p-hat)
The sample is independent from the population (10n≤N)
Critical Values
The number z* (z star) with probability “p” lying to its right under the standard normal curve (called the upper p critical value of the standard normal deviation)
First (1-C)/2 → Use Inversenorm
C being the confidence level
Critical values are ALWAYS positive
90% confidence level
.05 tail area & z*=1.6449
95% confidence level
.025 tail area & z*=1.96
99% confidence level
.005 tail area & z*=2.5758
Confidence Interval for a Population Mean
An SRS of size n from a population having an unknown mean mu and a known standard deviation sigma, has a level C confidence interval for mu
this interval is exact when the population distribution is normal and approximately correct for large values of n
Conditions for a z interval
Must be an SRS
Must be approximately normal (CLT or population is approx normal)
Independence (10n≤N)
Steps to construct any confidence interval (PANIC)
P - Parameter of interest (The parameter of interest is ____)
A - Assumptions
N - Name the type of interval (__ sample, (z or t)__ interval, CL=___%, (if a t-dist, df=__)
I - Interval (calculate)
C - Conclusion in Context (I am ___% confident that the true mu of (parameter in context) lies between ___ and ____.
Behavior of confidence intervals
A small margin of error says that we have gotten really close to the parameter. We want high confidence and small margin of error which will make small intervals.
Margin of Error
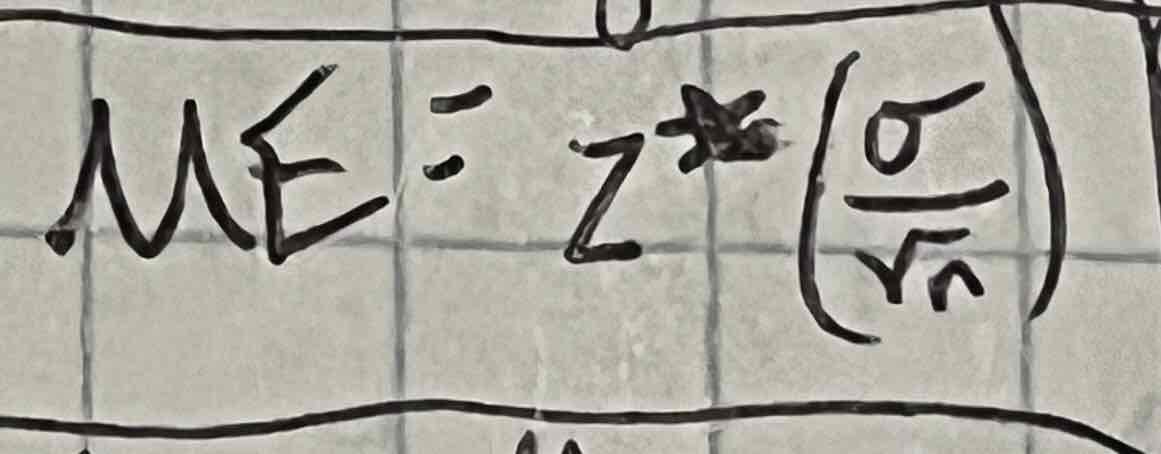
Margin of error gets smaller when
z* get smaller and confidence level C gets smaller and sigma gets smaller and n gets larger
Since we use the square root of n, we must
take 4 times the same size to cut the margin of error in half
Since we use the square root of n, we must
take 4 times the same size to cut the margin of error in half
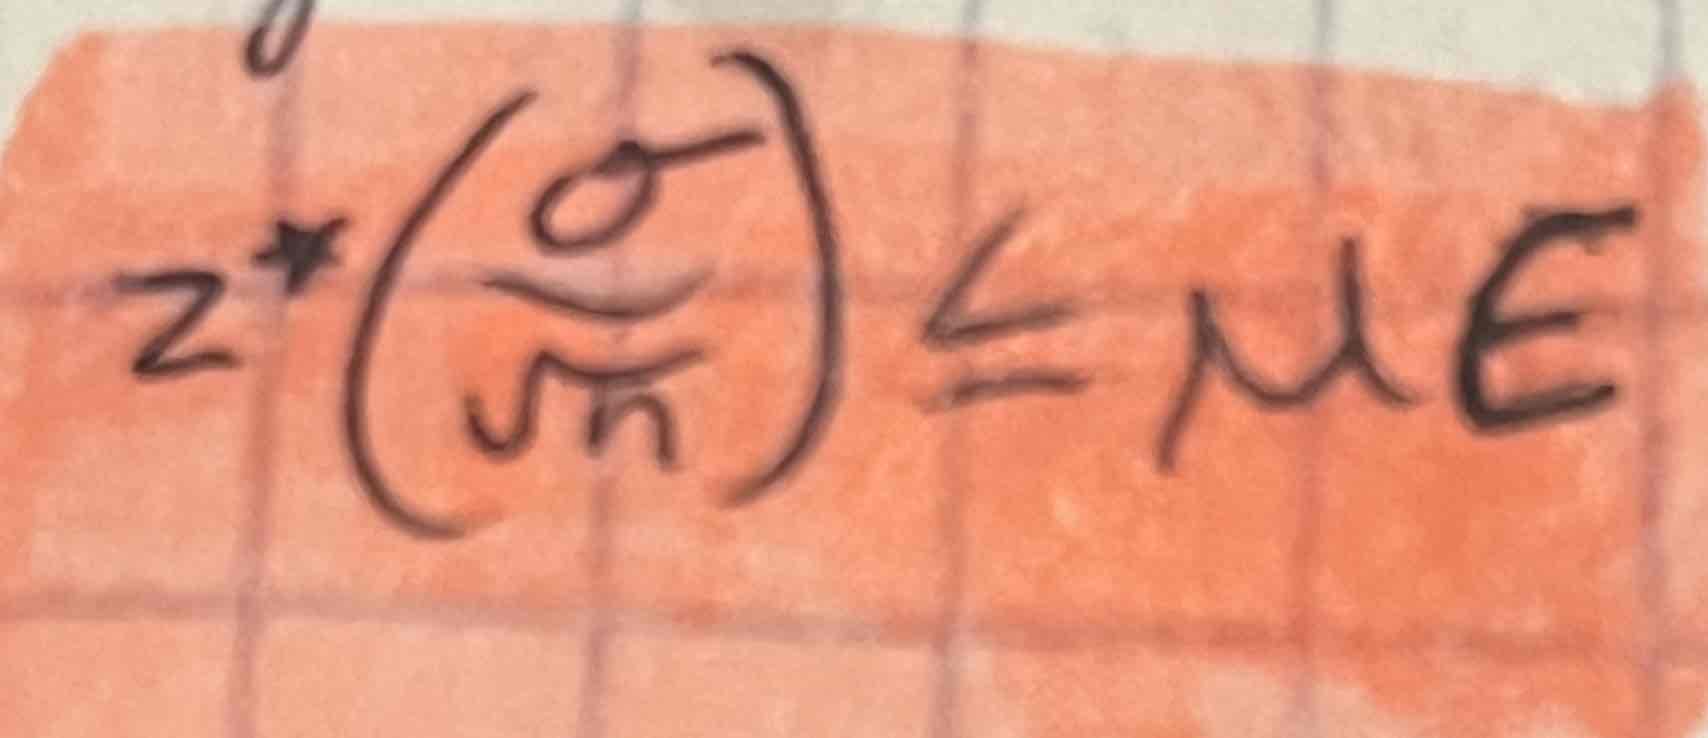
Sample size manufacturing
To determine the sample size n that will yield a confidence interval for population mean with specified margin of error, ME, set the expression for the margin of error to be less than or equal to mu and solve
ALWAYS ROUND UP
NEVER use probability to
describe a confidence interval
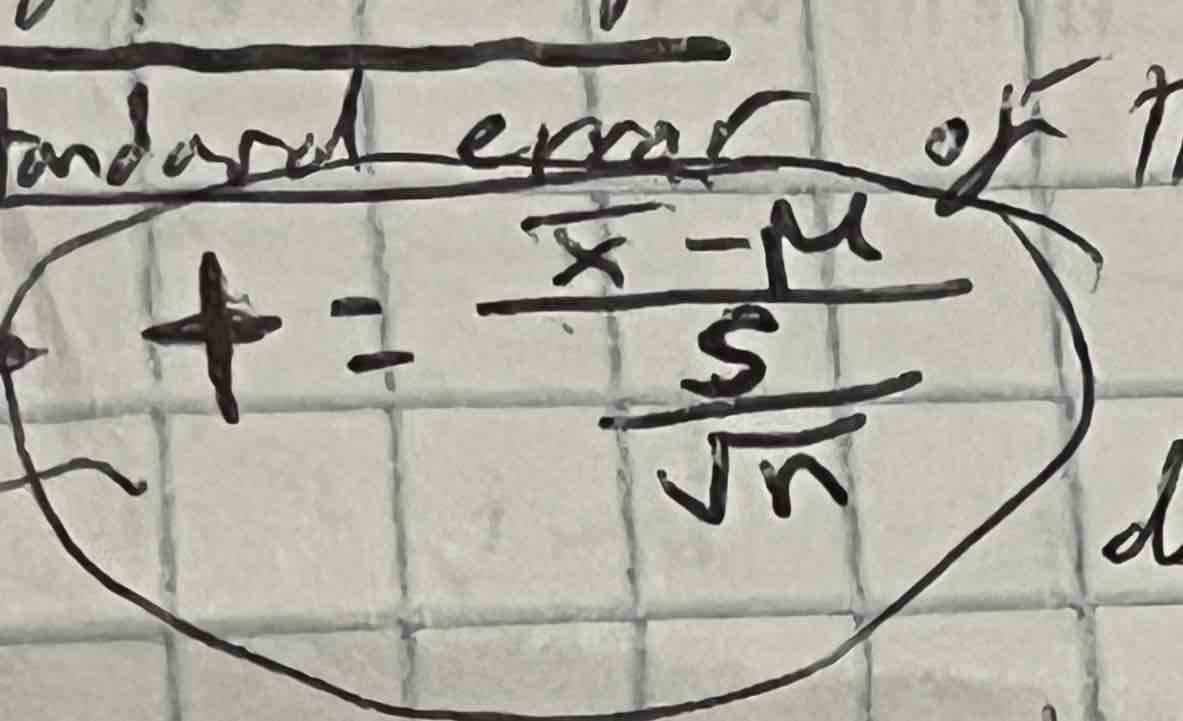
T-distribution
t is a standard value like z, t tells us how many standard deviations x-bar is from mu
It is symmetric about a zero and is bell shaped, but there is more variation, so the spread is greater
Must identify the degrees of freedom (n-1) because there is a different t statistic for each sample size
Use t-table (gives are to the RIGHT of t)
NO SIGMA; DOES NOT HAVE POPULATION STANDARD DEVIATION
As the df increases, the t-distribution
closer to normal since S is getting closer to signs
One sample t procedures are exactly correct only when
the population is normal (we assume it’s normal to justify it’s use)
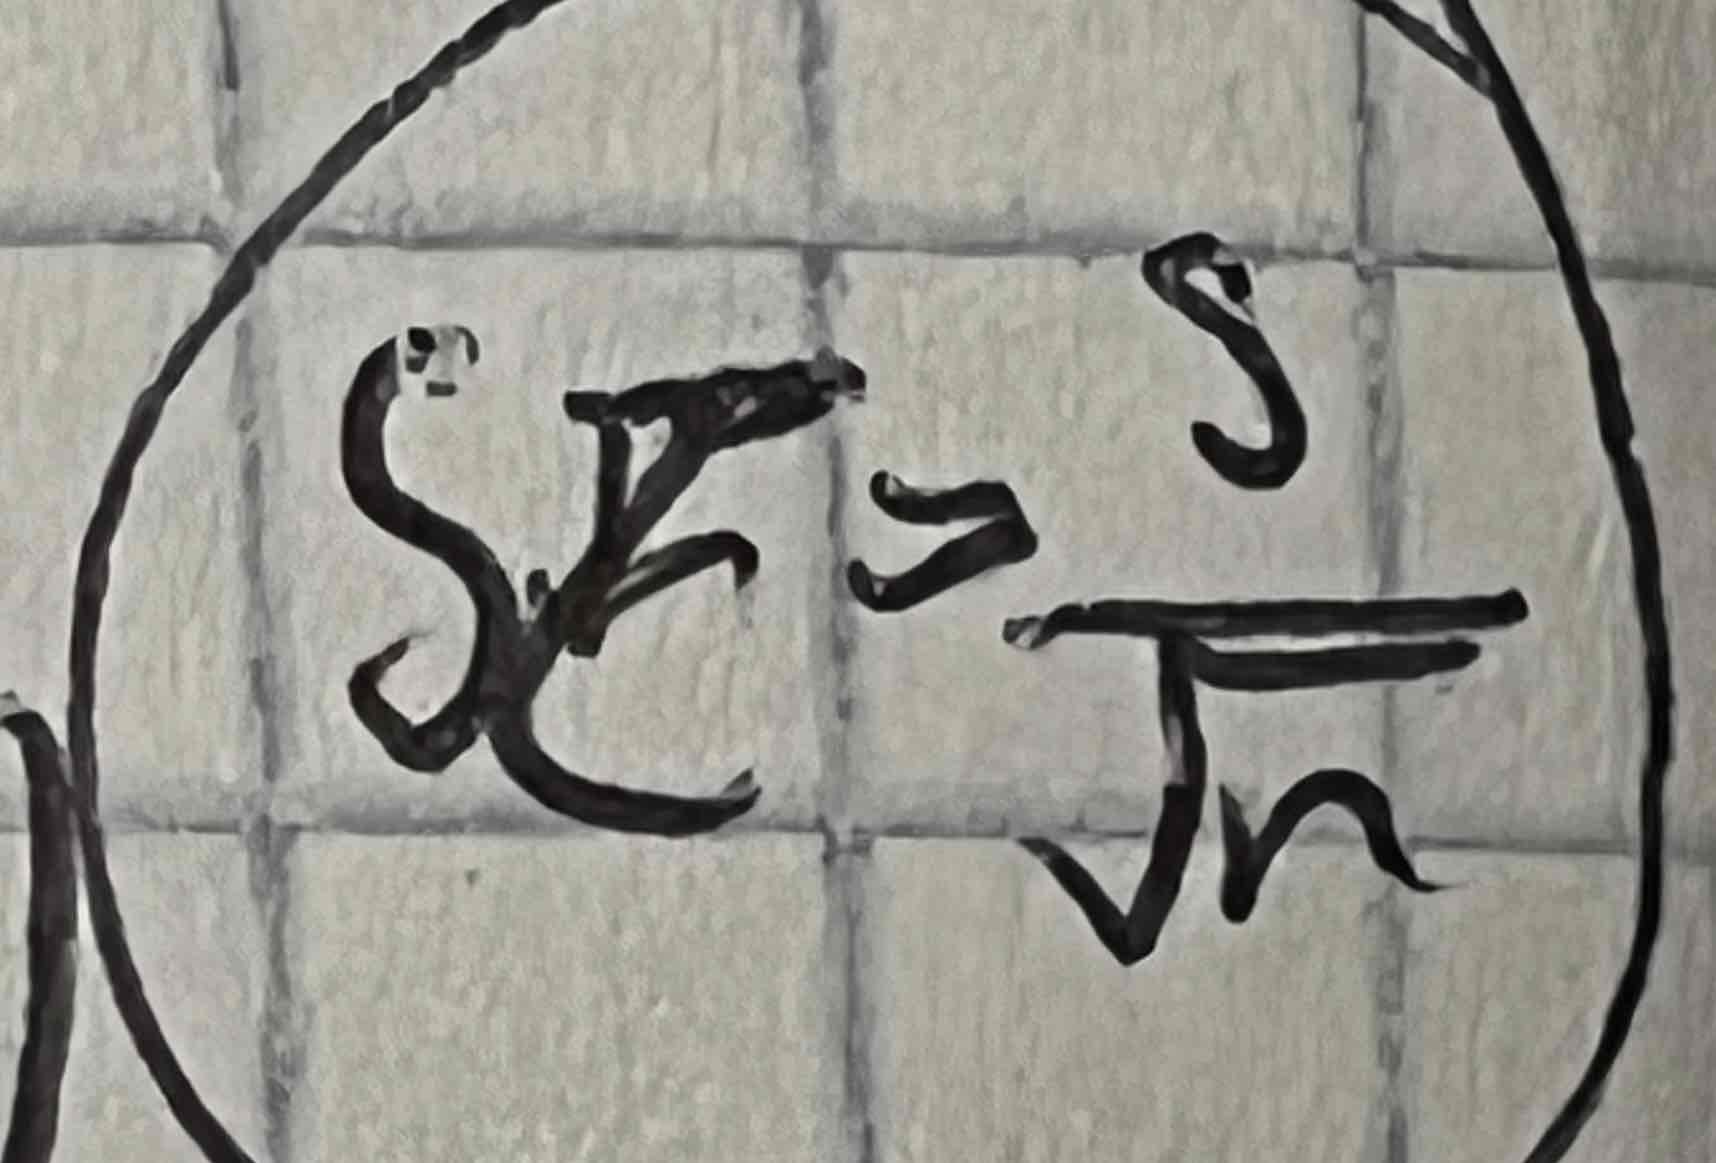
One sample t procedures
To calculate one sample t-interval, we must still assume or know the following:
The data is from an SRS from the population of interest
The sample mean x-bar has a normal distribution (normal population, graphically supported (normal probability plot) or n≥30 for CLT)
Independent (10n≤N)
NAMING THE TEST: one sample t-interval, CL=__%, df=__.
Z tests have
SIGMA, population SD