Full Higher Physics PPQs
1/24
Earn XP
Description and Tags
Full collation of the Higher Physics past paper questions (CURRENTLY AVAILABLE: 2024)
Name | Mastery | Learn | Test | Matching | Spaced |
|---|
No study sessions yet.
25 Terms
2024 P1 Q1
A cyclist travelling along a straight track accelerates at 1.2m/s²
The speed of the cyclist increases from 4.0m/s to 7.5 m/s
The distance travelled by the cyclist during this acceleration is
A - 1.5m
B - 17m
C - 20m
D - 30m
E - 34m
B

2024 P1 Q2
A ball is thrown vertically upwards and returns to its original position. Neglecting air resistance, which displacement-time (s-t) graph represents its motion?
A

2024 P1 Q3
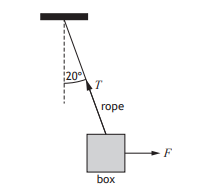
A box is suspended from a ceiling by a rope. A horizontal force F is acting on the box. The box is held stationary as shown.
The weight of the box is 4.9 N. The tension T in the rope is
A - 1.7N
B - 4.6N
C - 4.9N
D - 5.2N
E - 14N
D

2024 P1 Q4
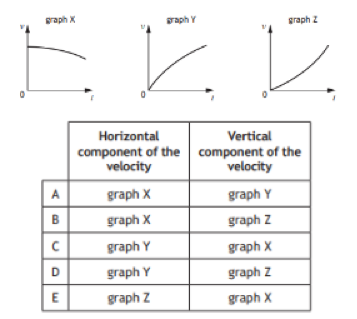
A ball is thrown horizontally over the edge of a cliff. A group of students draw three velocity-time (v-t) graphs to represent the motion of the ball, when air resistance is taken into account.
Which row in the table shows the graphs that represent the horizontal component of the velocity and the vertical component of the velocity?
A
2024 P1 Q5
In a hydroelectric power station water flows from a reservoir through turbines at a rate of 4.5 × 10⁶ kg per minute. The reservoir is 150 m above the turbines. The total power delivered by the water in falling from the reservoir to the turbines is
A - 3.0×10⁴ W
B - 7.5×10⁴ W
C - 1.1×10⁸ W
D - 6.6×10⁹ W
E - 4.0×10¹² W
C

2024 P1 Q6
Two trolleys move along a level bench as shown.
The trolleys collide and stick together. They continue to move along the bench. The velocity of the trolleys immediately after the collision is
A - 0.50 m/s
B - 1.3m/s
C - 2.0m/s
D - 2.7m/s
E - 8.0m/s
C
2024 P1 Q7
A spacecraft is travelling at a speed of 0.20c relative to the Earth. The spacecraft emits a signal for 20.0 s as measured in the frame of reference of the spacecraft.
An observer on Earth measures the duration of the signal as
A - 19.2s
B - 19.6s
C - 20.0s
D - 20.4s
E - 20.8s
D
2024 P1 Q8
The Queensferry Crossing has a length of 2700 m as measured by a stationary observer on Earth.
A spaceship travels past Earth at a constant speed of 1.80 × 10⁸ m/s relative to Earth. The length of the Queensferry Crossing as measured by an observer on the spaceship is
A - 1100 m
B - 1700 m
C - 2200 m
D - 3400 m
E - 4300 m.
C

2024 P1 Q9
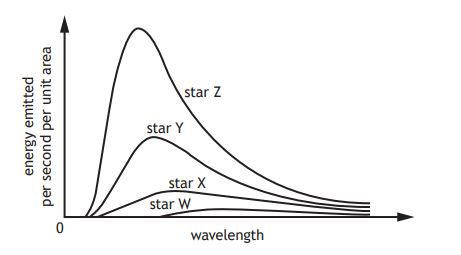
The graph shows how the energy emitted per second per unit area varies with the wavelength of the radiation for four stars W, X, Y, and Z
A student makes the following statements based on the information shown in the graph:
I Star Z is hotter than star W.
II The peak frequency of radiation emitted is greatest for star W.
III Star Y emits more energy per second per unit area than star X.
Which of the statements is/are correct?
A - I only
B - II only
C - III only
D - I and III only
E - I, II and III
D
2024 P1 Q10
Which of the following particles is a fermion?
A - W-boson
B - Z-boson
C - Photon
D - Gluon
E - Muon
E

2024 P1 Q11
The following statement represents beta decay.
Beta decay provided the first evidence for the existence of the
A - quark
B - neutrino
C - electron
D - proton
E - neutron
B
2024 P1 Q12

2024 P1 Q13
The following statement represents a nuclear reaction.
The total mass of the particles before the reaction is 26.572 × 10⁻²⁷ kg.
The total mass of the particles after the reaction is 26.560 × 10⁻²⁷ kg.
The energy released in this reaction is
A 1.20 × 10⁻²⁹ J
B 3.60 × 10⁻²¹ J
C 5.40 × 10⁻¹³ J
D 1.08 × 10⁻¹² J
E 2.39 × 10⁻⁹ J
D
2024 P1 Q14
A student carries out an experiment to investigate how irradiance of light varies with distance.
A small lamp is placed at a distance d from a light meter. The irradiance I at this distance is displayed on the light meter. This measurement is repeated for a range of different distances.
The student uses these results to plot the graph shown
The graph indicates that there is a systematic uncertainty in the experiment. Which of the following alterations would be most likely to reduce the systematic uncertainty in this experiment?
A - Repeating the experiment in a darkened room
B - Repeating the readings at each distance and calculating averages
C - Decreasing the brightness of the lamp
D - Replacing the small lamp with a larger lamp
E - Increasing the range of distances
A
2024 P1 Q15
A group of students make the following statements about coherent waves:
I Coherent waves have a constant phase relationship.
II Coherent waves have the same frequency.
III Coherent waves have the same speed.
Which of the statements is/are correct?
A - I only
B - III only
C - I and II only
D - II and III only
E - I, II and II