357 Exam 2
1/97
There's no tags or description
Looks like no tags are added yet.
Name | Mastery | Learn | Test | Matching | Spaced | Call with Kai |
|---|
No analytics yet
Send a link to your students to track their progress
98 Terms
Expertise
Skill and knowledge developed through training
Prolonged practice in a specific domain
why can scientists never “prove”?
because it is binary, and scientists want to avoid calling anything “fact”
Has a rlly high bar because there is always a level of uncertainty
Possibility of new evidence
Because it’s not a universal truth
Selection Bias
systematic errors in selecting subjects, causing a sample that is not representative of the target population
Delphi Method
Triangulation
the process of answering RQs thru multiple sources/research strategies
different sources of evidence or research strategies don’t have the same failings, so you need multiple to correct (checks/balances?)
all research strats/methods are flawed in some way
Differences in theories of evidence vs realities of evidence
In theory: science, practitioners, organizations, and stakeholders would all reach the same conclusion
In practice: evidence points every which way
Reasons:
some sources are biased
conclusion might depend on context
Why should we use evidence from practitioners?
start building an understanding of the problem itself
can be used to start to develop ideas about the logic model (causes, consequences)
helpful for identifying key terms used to search scientific papers
Components of practitioner opinions
“truth” → their description of what’s going on
random error → fluctuation in judgement that aren’t systematic
consistent bias → overestimating/ underestimating
Representativeness
when practitioners represent the total population on important characteristics
different sources of consistent bias
Qualitative data
non-numerical information
Benefits of qualitative data
Exploration (allows you to explore things that aren’t super known)
thick description (can create a deep explanation about what’s happening to reveal the underlying meanings, motivations, and social dynamics at play)
what are the unique characteristics of qualitative data?
researcher
bricolage
organic analyzation, collection, + interpretation of data
define bricolage
Intentional mixing of methods and sources of data
Types of qualitative data
open-ended surveys
existing text from practitioners
conducting our own interviews
open-ended surveys pros/cons
pros:
lower cost
easily collected w other sources of data
can usually gather more data than in interviews
Cons:
responses that are short + lack detail + aren’t effortful
no ability to follow up/ask clarification
harder to allow new insights to organically drive future data collection
pros and cons of using existing text
pros:
cheap to generate the data
large amounts of freely available data
data can be generated organically
analysis of experts’ writings is an important issue
cons:
may not quite be about the RQ
no ability to follow up/ask clarification
pros and cons of using interviews:
pros:
allows for robust answers to understand
allows for follow up questions/clarification
higher rate of return
cons:
collecting and analyzing the data is time consuming
contextual influences (ex: relationship bw interviewer and interviewee) can affect data systematically
lack of anonymity
What is Code in EBM?
systematic process of organizing, assigning, and extracting data from evidence sources
qualitative analysis
finding patterns in data and making meaning out of it
what is raw text?
Data in its original, unprocessed form, before it has been cleaned, categorized, or analyzed
A priori code
Created before we start data analysis (typically from existing literature, theory, or research questions)
Emergent code
New terms which emerge from the data
Not determined before the analysis commences
direct from the text, little interpretation
Memos
Notes that we use to record our views as analysis takes shape
could be about:
Reflection on new codes, larger categories, sub-categories, challenges to assumptions, etc
Thematic Analysis + its process
Used to identify trends in text
Summarizes text into themes
Data and findings are qualitative
qualitative data → codes → themes
Content analysis
counts specific incidents in the text
adds quantitative data of the prevalence of a theme
Open coding
New instances of existing codes are identified
– minimal interpretation, examples are noted as they appear in text
Axial coding
Think Axial like Assemble (to assemble a puzzle, put like pieces on like pieces, and break apart unlike pieces and unlike pieces)
abstract, interpret, refine open codes
Combine like codes, break apart others, take out uncommon codes
How do we ask valid and effective questions?
Two perspectives on professional expertise
System 1 thinking vs System 2 thinking
System 1:
fast, automatic, little to no effort
cuts down cognitive load (fast, implicit)
System 2:
slower
effortful, concious
domain specific
developed thru habits + learning
define intuition
spontaneous insight without conscious reasoning.
types of cognitive biases
prudence trap
recall-ability trap
prudence trap
being overly cautious, especially w high-stakes decisions
can be expensive + harmful (ex: overprescribing medication)
overcome by emphasizing honesty, taking estimates @ a range, using multiple data points
recall-ability trap
basing predictions off of what is most memorable
distorted probabilities outweigh memorable/dramatic events
overcome by finding actual statistics where possible
Illusion of explanatory depth
when people rely on folk theories to diagnose, categorize, induce, or infer, etc.
(when people think they can explain something more than they actually can)
Circumstances that invoke the illusion of explanatory depth
when what is being explained has:
hidden mechanisms
a hierarchical structure
when there are indeterminate end states
when people don’t have to try explaining something
hidden mechanisms
some mechanisms are easier to see (ex: computer screen), but understanding something with hidden mechanisms (ex: the inner workings of a computer), ppl won’t explain as well
hierarchical structure
natural and artificial systems tend to be hierarchical
when someone understands something @ higher level, they may think they understand its lower levels as well
and vice versa, if someone thinks they understand a lower level, they may believe they understand other lower levels as well
indeterminate end states
less likely for facts w/ right or wrong answer
easier to test
actual knowledge can be developed over time
heuristics and cognitive biases
mental shortcuts; “Good enough” decisions
can lead to cognitive biases when they have errors
advice giving
involves psychological distance bw practitioner and receiver (ex: social, physical, temporal → relating to time)
as a result, advice focuses on personal satisfaction instead of location and pay
emphasis on positive features instead of negative ones
construal level theory
people pay attention depending on how near or far something physically/socially/timing-wise is
something far mentally is represented @ higher levels and more abstractly (they’ll get the big ideas but the context cues and details get less attention)
something near mentally represented @ lower level + more concretely (emphasis on the details)
near vs distant construal level theory
Near:
feasibility concerns
examples
specific situational info/demands
negative features
Far:
desirability concerns
broad categories
overarching goals, values, ideologies
positive features
3 components of practitioners viewpoints
attempt to gather info
may be mislead/confused by this info
random errors = fluctuations in judgement that aren’t systematic
consistent bias
tendency to consistently over/underestimate (ex: positive outlook, cognitive biases)
what is “truth” in EBM?
a good description of what’s going on
we cannot detangle truth from shared bias. areas if overlap in practitioner opinions is too large and gives false sense of accuracy
social distance
differences in demographics, attitudes, personality, etc.
define the validity of an environment
if there are regular/consistent causal relationships
high validity vs low validity environments
high validity: predictable + specifiable cues that can be learned (ex: where a building fire originated)
low validity: limited predictable and specifiable cues (ex: predicting economic trends)
sample
number of ppl who provide data out of a larger population of interest (ex: practitioners/experts)
should be INTENTIONAL, not just convenient
also should be representative of target population
when/where can specific expert intuition develop?
when there is a high validity environment where they can practice
representativeness
practitioners represent total population on important characteristics
diff sources of consistent bias
random error is canceled out because there is sufficient # of practitioners (e.g. diff incidental emotions)
Sample size depends on…
RQ
relevance of practitioner evidence
time and money
small firms don’t have as many resources as a big firm, which leads to a smaller sample
sample size calculator for quant. analysis
how many ppl do we need to contact to detect a certain effect (S, M, L) → correlation
how do we avoid or reduce bias?
define science
a way of thinking about how to understand the world
attempt to find evidence that your hypothesis is wrong
explain the scientist-practitioner gap
the divide between academic researchers who get evidence-based knowledge and practitioners who apply and often ignore this science in real-world settings
causes of science-practice gap
knowledge transfer
limited incentives for scientists to transfer knowledge
tenure and promotion of scientists doesn’t factor into knowledge transfer
different language (jargon, scientific literacy)
info asymmetry (uniquely held info by academics + practitioners)
scientists have specialized education, practitioners get specialized training
unique goals
short term vs long term
technical, methodological, theoretical vs solution-focused
topics that scientists and practitioners agree are important
Reducing or eliminating pay ineq
Reducing or eliminating discrimination
reducing/eliminating unethical bus pract
Expanding opp for continuing education
Leveraging tech
Reducing carbon footprint
topics that practitioners find important that scientists don’t
promoting employee wellbeing
reducing turnover
communication of work
topics that scientists find important that practitioners don’t
reducing costs for companies and consumers
reducing global health concerns
affordable healthcare
ways to bridge to science-practice gap
Academic side:
Publish summaries of research intended for practitioners
Harvard business review, MIT sloan mag
Consult with practitioners
Remove article pay wall
Practitioner Side
Focus on scientific literacy
Work with scientist-practitioners who is tasked with EBM
Steps in Scientific Method
ask question
formulate hypothesis
design test of hypothesis
gather data
analyze data
draw conclusion about hypothesis
what are the different types of research designs?
1. Based on Purpose
Exploratory Research
Descriptive Research
Causal (Explanatory) Research
2. Based on Timing
Retrospective Research
Prospective Research
Longitudinal Research
Cross-Sectional Research
3. Based on Control / Method
Experimental Research
Correlational Research
Observational Research
Explain observational research design
study where behavior is systematically observed and recorded
describes phenomena
pros and cons of observational research design
Pros: identify something new, measure something behavioral
Cons: cant detect relationships, time consuming
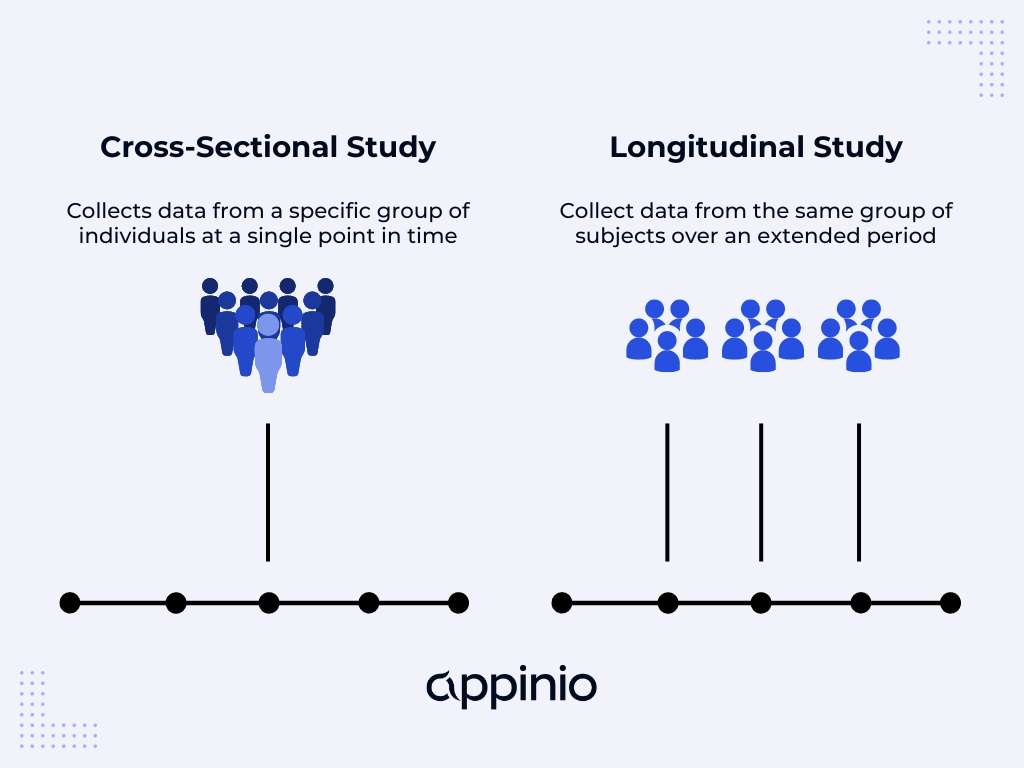
Explain cross-sectional research design
where large #s of data + variables = measured simultaneously
Ex: send a survey asking people to indicate levels of burnout, supervisor satisfaction, turnover intentions, etc.
Provides snapshot in time
pros and cons of cross-sectional research design
Pros: cost-effective, potench relationships between variables, larger samples
Cons: cannot detect cause and effect because we don’t know why something happened (we can have guesses, but we dk)
three criteria for causality
Covariation
When 1 variable changes, the other changes
Evidence for this if we see a correlation
Positive: increase in X → increase in Y
Neg: ↑ in X → ↓ in Y
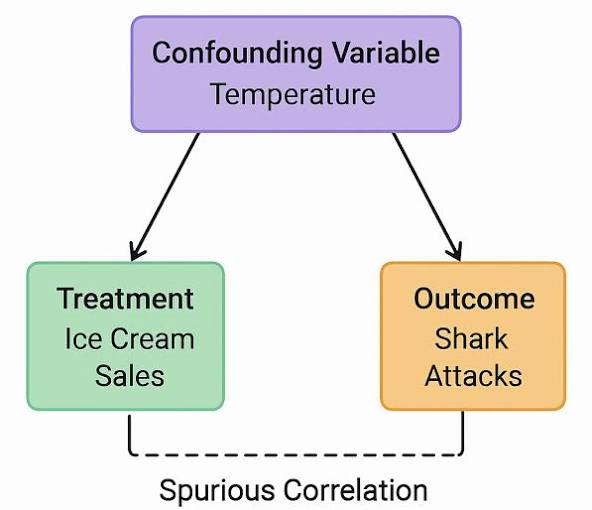
Other plausible alternatives are ruled out
X and Y might only be related thru common cause, W
Spurious correlation = two variables have common relationship with 3rd variable
No causal relationship with each other
Appearance of a relationship
Ice cream ←→ Crime (no)
Temporality
To demonstrate that X causes Y, X has to come before Y
A ∆ in X (time 1) must happen before a ∆ in Y (time 2)
Explain randomized experiment research design
Participants randomly assigned to 1 of 2+ groups
Experimental groups: participants receive an intervention
Control group: participants receive no intervention/alternative intervention
Explain longitudinal studies research design
when data is taken from the same people over multiple points in time
pros and cons of longitudinal studies
Pros:
assesses ∆ over time
Cons:
you can’t rule out alternative causes
costly
Explain meta-analysis research design
a study that summarizes a bunch of studies on the same topic
pros and cons of meta-analysis
Pros:
huge sample size
not limited to the bias of 1 study
Cons:
Garbage in = garbage out
if there’s no causality across the cross-sectional studies then your meta-analysis is worthless
explain causality
application of:
best available scientific research
organizational data
professional expertise
to identify cause-and-effect principles
Causality vs correlation?
correlation = Strength of association between variables
causation = indicates that one variable directly causes the other to change
Peer review
evaluation of scholarly research by field experts to ensure quality, validity, and originality before publication
Coincidence
remarkable, unplanned concurrence of events occurring together without apparent causal connection
Methodological bias
systematic errors in research design, data collection, or analysis that produce distorted results
Confounders
external variables in research that influence both the independent and dependent variables, causing a false or distorted association between them
Placebo effect
a phenomenon where a person’s physical or mental health improves after receiving an inert, "fake" treatment
Statistical significance/p-values
estimating the likeliness that our results from a sample mirror a genuine pattern in a population
p-value = percent chance that the result is just coincidence (lower p-vaIue = better), best p-val = < 0.05 (statistical significance)
interpret r = .14, p = .61
There is a very weak positive correlation of 14% but it is not statistically significant (p = 0.61 > 0.05) so you should treat it as no meaningful relationship between the variables.
Practical significance
how big an effect is
Effect size
quantitative measure of strength of a relationship bw 2 variables
tells us the impact of an effect
Ex: How strongly related are X and Y
indicator of practical significance
define descriptive research
Research that is used to describe characteristics, behaviors, or situations as they currently exist, without trying to determine cause-and-effect relationships.
define exploratory research
Research that is used to explore a problem or situation when there is little prior knowledge, with the goal of generating ideas, insights, or possible explanations rather than testing them.
define causal research
Research that is used to determine whether one variable actually causes a change in another variable
descriptive vs exploratory vs causal research
descriptive = current situation
exploratory = understanding something not well-known
causal = factors that cause ∆ in another variable
define retrospective research
Research that looks backward in time, using existing data or past events to examine relationships and possible causes.
define prospective research
Research that looks forward in time, following subjects or variables to observe how outcomes develop.
Ex: longitudinal study
prospective vs retrospective research
prospective = forward looking
retrospective = backward looking
define experimental research
Research where researchers manipulate one or more variables and control conditions to determine whether those changes cause an effect on an outcome.
define observational research
Research in which researchers observe and measure variables as they naturally occur, without manipulating or intervening in the situation.
Ex: watching a chimpanzee’s behavior without doing anything
explain experimental vs observational research
experimental = changing X to explain if it causes Y
observational = How are variables related under normal conditions
define correlational research
Research that examines whether two or more variables are related, without manipulating them or establishing a cause-and-effect relationship.
Are these variables associated?
When one changes, does the other tend to change too?
explain experimental vs correlational research
Experimental = manipulating variables to establish causality
Correlational = measures existing variables to identify relationships
define cross-sectional research
when a large number of data and variables are measured simultaneously
provides snapshot in time
ex: COVID-19 Impact Survey - A study of healthcare workers at a specific hospital, conducted in April 2020, to determine the prevalence of anxiety and burnout during the first wave of the pandemic.
pros + cons of cross-sectional study
pros:
cost effective
potential relationships bw variables
larger samples
cons:
can’t detect cause/effect bc they measure both the cause (exposure) and the effect (outcome) at the same, single point in time (doesn’t have temporality)
explain cross-sectional vs longitudinal research