A Level Maths - Statistics
1/208
Earn XP
Description and Tags
Name | Mastery | Learn | Test | Matching | Spaced | Call with Kai |
|---|
No analytics yet
Send a link to your students to track their progress
209 Terms
Linear Regression
y = axⁿ
logy = loga + nlogx
Exponential Regression
y = ab^x
logy = loga + xlogb
Normal Approximation
µ = np
σ =√(np(1-p))
Mean
∑x ÷ n
GF: ∑xf ÷ ∑f
Variance
(∑x²/n) - (∑x/n)²
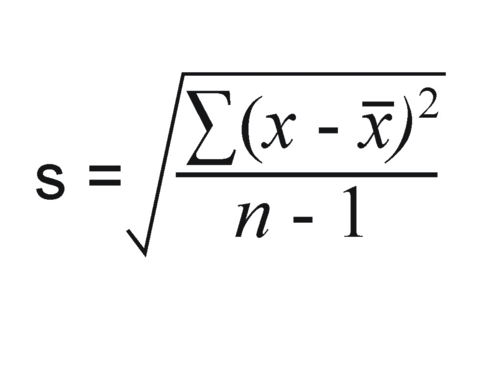
Standard Deviation
√variance
Histograms: Height
Area = k x frequency
Frequency Density
frequency ÷ class width
Population
Whole set of items of interest.
Census
Observes/measures every member of a population
Sample
Selection of observations taken from a subset of the population which is used to find out info about the population.
Sampling Frame
A list of individuals (named or numbered) from whom the sample is drawn
Random Sampling
Every member of the population has an equal chance of being selected
Systematic Sampling
Every nth person is chosen.
Stratified Sampling
Population is divided into mutually exclusive Strat and a random sample is taken from each.
Quota Sampling
Interviewer selects a sample that reflects the characteristics of the population
Opportunity Sampling
Choosing whoever is available
Continuous Variable
Can take any value in a given range
Discrete Variable
Takes specific values in a given range
Conditions for Binomial
Fixed no. of trials 2 possible outcomes Outcomes are independent Fixed probability of success
Probability: Independent if...
P(A∩B) = P(A) X P(B)
P(A|B) = P(A)
Probability: Mutually exclusive if...
P(A∩B) = 0
P(A∪B) = P(A) + P(B)
Conditional Probability
P(A|B) = P(A∩B)/P(B)
Probability Addition Rule
P(A∪B) = P(A) + P(B) - P(A∩B)
If there are 3 events, and A and B are mutually exclusive...
P(A∪B∪C) = P(A) + P(B) + P(C) - P(A∩C) - P(B∩C)
What is a DRV - discrete random variable
it is a random variable that can only take certain values
...
...
probability mass function
a function that gives the probability that a discrete random variable is exactly equal to some value
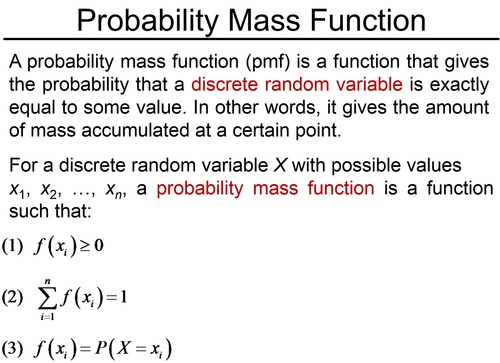
what does a probability distribution do
describes the probability of any outcome in the sample space
P(A/B) =
(P(A n B))
P(B)
If they are independent events P(A) * P(B) =
P(A N B)
SUM OF P(X=x) =
1
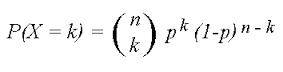
formula for probability X=r where X is the number of desired outcomes binomial distribution formula
nCr P^r * (1-p)^(n-r)
p = probability of success r = number of times you want success n= number of trials
standard deviation
a computed measure of how much scores vary around the mean score
general probability addition rule
P(A∪B)=P(A)+P(B)−P(A∩B)
P(A∩B)=P(A)+P(B)−P(A∪B)
what is an event
a set of possible outcomes - not necessarily equally likely
sample space
set of all possible outcomes , all equally likely
A ∪ B
means A or B or both
A ∩ B
means both A and B
The rules for tree diagrams are
Select which branches you need Multiply along each branch Add the results of each branch needed. Make sure that you include enough working to show which branches you are using (method). Be careful to allow for selection with and without replacement.
if you are told what has happened for the first choice and need to find second you read off tree diagram
if you are told what has happened for the second choice use formula
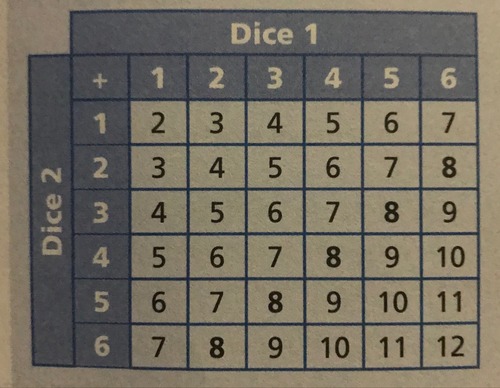
sample space diagram
mutually exclusive events
Two events that cannot occur at the same time
what is P(A∩B) if two events are mutually exclusive
P(A∩B) = 0
Sampling units
Individual units of a population
what does a census do
observes and measures every member of a population
advantages / disadvantages of census
advantages :
gives a completely accurate result
disadvantages -time consuming and expensive -hard to process large quantity of data
advantages/disadvantages of a sample
advantages :
less time consuming and expensive than census fewer people have to respond less data to process than in a census
disadvantages
data may not be as accurate sample may not be large enough to give information about sub groups of the population
sampling frame
a list of individuals from whom the sample is drawn
population
a whole set of items that are of interest
sample
a selection of observations taken from the subset of the population which is used to find out information about the population as a whole
simple random sampling
Every sample from the population has an equal chance of being chosen
formed by when each item given number then random number generator used or lottery
simple random sampling advantages/disadvantages
advantages
-easy and cheap to implement for small populations and small samples
free of bias -each sample unit has a known and equal chance of selection
disadvantages
sampling frame is needed not suitable when population size/sample size is large as it would be potentially tie consuming, disruptive and expensive
3 different types of random sampling
Simple random sampling
Systematic sampling • Stratified sampling
systematic sampling
The required elements are chosen at regular intervals from an ordered list
e.g if sample size was 20 out of population of 100 you would take one out of every 5 as 100/20=5
advantages/disadvantages systematic sampling
advantages
easy and quick to use
suitable for large samples/populations
disadvantages
sample frame needed can introduce bias if sampling frame not random
stratified sampling
a variation of random sampling; the population is divided into mutually exclusive strata - males and females for example
and a random sample is taken from each
number sampled in a stratum/total sample size = number in stratum/number in population
advantages/disadvantages stratified sampling
advantages
sample accurately reflects the population structure
guarantees proportional representation of groups within a population
disadvantages
-population must be clearly classified into distinct strata -selection from strata suffers from same disadvantages as simple random sampling
quota sampling
interviewer/reasearcher selects a sample that reflects the characteristics of the whole population
quota sampling advantages/disadvantages
Advantages:
Allows a small sample to still be representative
No sampling frame required
Quick, easy and inexpensive
Allows for easy comparison between different groups within a population
Disadvantages:
Non random sampling and so can introduce bias
Population must be divided into groups which can be costly or inacurate
Non responses are not recorded as such
opportunity sampling
a sample of whoever happens to be there and agrees to participate and fit the criteria looked for
opportunity sampling advantages/disadvantages
Advantages:
Easy to carry out
Inexpensive
Disadvantages:
Unlikely to provide a representative sample
Highly dependent on individual researchers
quantitive data
numerical data
qualitative data
Information describing color, odor, shape, or some other physical characteristic
continuous variable
a quantitative variable that has an infinite number of possible values that are not countable
discrete variable
variable that only have set values
class boundaries
Tell you the maximum and minimum values that belong in each class
class width
the difference between upper and lower class limits. - remember if continuous above 0.5 and below by 0.5
words to describe scatter diagrams - correlation
Strong - close points to each other Weak Positive Negative Fairly Very Extremely - how steep None
how to describe correlations in questions
always link to question context e.g house prices go up the closer they are to the station
regression lines
The line of best fit drawn through a scatterplot
they have equation y=a + bx
b is gradient if positive then they are correlated positively if negative then negatively correlated
interpolation
estimating a value within the range of measured data
USUALLY MORE RELIABLE
You are usually asked to give an interpretation of the gradient Eg for every 1 degree rise there will be 22 more ice creams sold per hour For every 1 minute passed the temperature will cool by 1.5 degrees For every hour passed the bacteria will have increased by 15 - does this seem right? LOOK AT THE SCALE eg 15 (million) they were in millions
extrapolation
Estimating a value outside the range of measured data.
usually unreliable
how to identify outliers
if it is 1.5*IQR above/below the upper/lower quartiles it is an outlier
if it is more than 2 standard deviations from the mean it is outlier
coding - inverse function
means it is the exact inverse function e.g if the x was formed from 2y+4 you would do x-4 /2 to get x
however for standard deviation it is slightly different -if standard deviation =b was formed by 3d+8 to get the d you would just divide by 3 and not account for subtracting the 8. - However IT IS ALWAYS POSITIVE VALUE SO IF WORKING BACKWARDS IT COULD BE NEGATIVE OR POSITIVE SO YOU WOULD NEED MEAN INFORMATION TO SOLVE.
variance
standard deviation squared
binomial PD
probability of n successful
binomial CD
probability of 0-n successful cumulative
in binomial distribution for each random variable what must there be
independent of each other
fixed number of trials
2 outcomes
fixed probability
how to find which to put on x axis
x always on top or left of graph
uniform distribution
probability of eachh event exactly same
what is trace in statistics
a specific value which is small
comparing box plots
Compare Medians
Compare Range (IQR)
Compare Skew
Put comparison into context
histograms what to know
class width * frequency density = frequency
might need to use ratios
class width shown to you
might need to see that if a certain area represents a certain frequency in a certain ratio , how you can apply this ratio to the others
need to practice this with pp
cumulative frequency tables to remember
keep a running total
plot against upper boundaries
make a smooth shaped s curve
unimodal data
data with one mode
uniform data
no mode / data is symmetrical
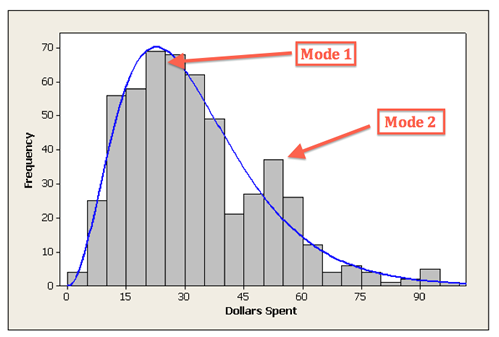
bimodal data
A histogram will have two peaks as the data has two modes.
peaks do not have to be equal
how to interpolate data e.g find the 17th value
go across each frequency and when you find the area upon which the 17th value lies, and lets say the first category contained 10 and the next 12,
you would do 17-10 =7 to get remainder of 7 , then do 7/12 * class width = x
then you would add x to the starting value in the class width and that is answer
traps you could fall for interpolation
nearest minute - make sure to get correct class width for this
mean
the arithmetic average of a distribution, obtained by adding the scores and then dividing by the number of scores
pros uses every data item
cons affected by extreme values
median
the middle score in a distribution; half the scores are above it and half are below it
pros - unaffected by extreme values
could still calculate if couple data items missing
mode
the most frequently occurring score(s) in a distribution
pros unaffected by extreme values, easy to calculate
cons only useful if there are relatively high frequencies involved
what to remember for doing inverse functions of means and standard deviations - coding
means it is the exact inverse function e.g if the x was formed from 2y+4 you would do x-4 /2 to get x
however for standard deviation it is slightly different -if standard deviation =b was formed by 3d+8 to get the d you would just divide by 3 and not account for subtracting the 8
what is variance
How the values are dispersed around the mean; the larger the variance, the larger the dispersion of the scores
what to remember about jacksonville
really hot - most hot in southern east coast of america 23-28 degree average
what to remember about Beijing
temperature relatively high high temperature range
What to remember about Perth
temperature range similar to UK It is in Australia Has some extreme values of data - maximum rainfall 102mm Near to sea
What to remember about UK
July - August have highest temperatures 15-16th october 1987 was storm so high windspeeds rainfall etc
Heathrow is warmest Leuchars coldest
Hurn is by sea so more windy
Are there cities that have very different weather to others
beijing vs leuchars
What is UK temp range
3.8-28.7 degrees celcius