Study Guide - CAP4611
1/135
There's no tags or description
Looks like no tags are added yet.
Name | Mastery | Learn | Test | Matching | Spaced | Call with Kai |
|---|
No study sessions yet.
136 Terms
What is linear regression and how is it used in predictive modeling?
Use Case: A supervised learning algorithm used to model the relationship between a dependent variable (y) and one or more independent variables (x).
How it Works: The goal is to find the best-fitting straight line (also called a regression line) through the data points.
Equation: y = mx + b -> y = theta1 + theta2 * x
Why Use Linear Regression?
Simple yet effective for predicting outcomes.
Provides insights into the relationship between variables.
Useful in many fields like economics, biology, engineering, etc.
What are the key assumptions made by a linear regression model?
Linearity, Independence, Homoscedasticity, Normality
Linearity
The relationship between the independent variable and the dependent variable must be linear.
This means that changes in the dependent variable are proportional to changes in the independent variable.
A straight line should reasonably fit the data points.
Why it matters: If the relationship is non-linear, linear regression may provide inaccurate predictions.
Independence
The observations should be independent of one another.
This means that the value of one data point should not influence the value of another.
Why it matters: If the observations are not independent, the model's predictions can be biased or misleading.
Homoscedasticity
The variance of the residuals (errors) should be constant across all levels of the independent variable.
The spread of the errors should be the same for all predicted values.
Why it matters: If the variance changes (heteroscedasticity), the model's predictions may be unreliable, especially for certain ranges of the data.
Normality
The residuals (errors) should be normally distributed. Residuals should form a bell curve, with most errors centered around zero and fewer large errors.
Why it matters: Normality of residuals is important for hypothesis testing and constructing accurate confidence intervals.
Describe the cost function used in linear regression and explain its purpose.
To measure how well our hypothesis predicts the actual data.
The cost function quantifies the error between the predicted values and the actual values for all the data points.
In linear regression, the most commonly used cost function is the Mean Squared Error (MSE): J(θ₀, θ₁)=(1/2m) i=1∑m(hθ(x^(i))−y^(i))^2
Goal: Minimize the cost function to find the best-fitting line. This will lead to the optimal values of θ₀ θ₁.
What is gradient descent and how is it used in the context of linear regression?
To find the values of that minimize the cost function.
It is an iterative optimization algorithm that adjusts to gradually reduce the cost.
In each iteration, the parameters are updated in the direction that reduces the cost the most.
The update rules for Gradient Descent are: θj:=θj − α⋅(∂/θj∂)(J(θ₀, θ₁)).
What is multicollinearity, and how can it affect the performance of a linear regression model?
Definition: Multicollinearity occurs when two or more independent variables in a regression model are highly correlated, meaning they provide overlapping information.
Why it matters: Ideally, each predictor (independent variable) should contribute unique information to explain the dependent variable. When variables are highly correlated, it becomes difficult to isolate the individual effect of each predictor on the outcome.
Explain what regularization is.
Regularization is used to reduce overfitting by penalizing overly complex models and encouraging simpler, more generalizable patterns.
It helps in striking a balance between bias and variance, ensuring that the model performs well on both the training and test datasets.
How regularization helps in the context of linear regression.
Add a penalty to prevent overfitting by shrinking large coefficients.
How do you interpret the coefficients of a linear regression model?
The coefficients represent the expected change in the dependent variable for a one-unit change in the independent variable, holding other variables constant.
Given a dataset with X and Y values, compute the linear regression line using the least squares method.
Use the least squares method to minimize the sum of squared residuals between observed and predicted values.
The linear regression equation is calculated as y = β0+β1⋅X where β0 is the intercept and β1 is the slope.
If the regression equation for predicting weight based on height is Weight = 150 + 5 × Height, what would be the predicted weight of a person who is 70 inches tall?
Given the equation Weight= 150 + 5⋅Height, if Height = 70, the predicted weight = 150 + 5⋅70 = 500 pounds.
Calculate the residuals for a given set of actual and predicted values.
Residuals are the differences between the actual values and the predicted values from the model: Residual = Actual − Predicted.
Explain how the R-squared value is calculated and what it indicates about a linear regression model.
R-squared measures the proportion of variance in the dependent variable that is predictable from the independent variables. It is calculated as: 1 − (SSresiduals/SStotal).
How would you diagnose and fix issues of heteroscedasticity in a linear regression model?
It can be diagnosed with residual plots and corrected using transformations, weighted least squares, or robust standard errors.
Suggest methods to improve the fit of a linear regression model that initially performs poorly.
Regularization, Cross-Validation, Simplification
Regularization
Add a penalty to prevent overfitting by shrinking large coefficients.
Cross-Validation:
Use cross-validation to test the model's performance on unseen data and adjust complexity accordingly.
Simplification
Avoid including too many variables or overly complex interactions that don't significantly improve the model.
How would you decide which is the better model when given the results of two different regression analyses?
Cross-validation, comparison to baseline models, RMSE.
Consider a dataset with sales and marketing spend. Construct a linear regression model to predict sales based on marketing spend and interpret the outcome.
You would build a model where sales is the dependent variable and marketing spend is the independent variable.
Interpretation involves understanding how much the predicted sales change in response to marketing investment, using the slope and intercept values from the model.
What is logistic regression and in which scenario is it used?
A supervised learning algorithm used for binary classification tasks. It predicts the probability of a binary outcome (0 or 1) based on input features.
Examples of Classification: Email: Spam / Not Spam?
Online Transactions: Fraudulent (Yes / No)?
Tumor: Malignant / Benign?
Binary Outcomes: Class 0: Negative Class (e.g., benign tumor)
Class 1: Positive Class (e.g., malignant tumor)
Threshold for Prediction: Logistic regression uses a threshold (commonly 0.5):
If the probability >0.5, predict "1" Otherwise, predict "0"
What is the logistic function and how does it differ from the linear function in terms of output range?
The logistic function (sigmoid function) outputs values between 0 and 1, predicts a categorical (binary) dependent variable using independent variables, unlike linear regression which outputs continuous dependent values using independent variables.
Explain the concepts of odds and log-odds in the context of logistic regression.
Odds: The ratio of the probability of an event occurring to it not occurring.
Log-odds: The natural logarithm of the odds, used in logistic regression to predict binary outcomes.
Describe the cost function used in logistic regression and why it is suitable for this type of model.
Logistic regression uses log-loss or binary cross-entropy as the cost function, which penalizes incorrect predictions with higher losses for confident wrong predictions.
It's suitable because the linear regression cost function will give results with local minima, which is a big problem because then we’ll miss out on our global minima and our error will increase.
How is gradient descent used to find the optimal parameters in logistic regression?
Gradient descent is used to minimize the log-loss function by adjusting model coefficients iteratively to find the optimal parameters.
What metrics are used to evaluate the performance of a logistic regression model?
Accuracy, Recall, Precision, F1-score
Accuracy
accuracy = (correct predictions/ test instances)
error = 1 - accuracy = (incorrect predictions/ test instances)
Recall
Measures the ability to identify all relevant instances (sensitivity).
Recall = (true positives/ all positives)
Precision
Measures how many of the predicted positives are actually positive.
Precision = (true positives/ predicted positives)
F1-Score
Definition: The harmonic mean of precision and recall, combining them into a single metric. F1 gives more weight to low values, so if either precision or recall is low, the F1 score will also be low.
Fi = 2 (precision recall/ precision + recall)
How does changing the threshold value affect the performance of a logistic regression model?
Changing the threshold affects the classification boundary, impacting the precision and recall trade-off. Lowering it favors recall, raising it favors precision.
How is logistic regression extended to handle more than two classes?
For more than two classes, logistic regression uses one-vs-all or softmax regression.
Why is feature scaling important in logistic regression?
Feature scaling is important because logistic regression relies on distance-based metrics, and large feature values can dominate the results.
Main differences between linear and logistic regression
Linear Regression:
Predicts a continuous dependent variable using independent variables.
Solves regression problems.
Uses the Least Squares estimation method for accuracy.
Fits a straight line (best-fit line) to predict the output.
Requires a linear relationship between the dependent and independent variables.
Logistic Regression:
Predicts a categorical (binary) dependent variable using independent variables.
Solves classification problems.
Uses the Maximum Likelihood estimation method for accuracy.
Fits an S-curve (logistic function) to classify the samples.
Does not require a linear relationship between dependent and independent variables.
What types of regularization are applied in logistic regression and how do they impact the model?
L1 (Lasso) and L2 (Ridge) regularization prevent overfitting by penalizing large coefficients, helping the model generalize better
Lasso Regularization (L1)
Adds a penalty proportional to the absolute value of coefficients, encouraging sparsity (i.e., many features may have zero weights)
Lasso stands for Least Absolute Shrinkage and Selection Operator.
When to Use Lasso Regression?: Lasso is useful when we want a simple, interpretable model that selects only the most important features.
Ridge Regularization (L2)
Adds a penalty proportional to the square of the coefficients, shrinking them, but all features are included.
Elastic Net Regularization (L1 + L2)
Combines both Lasso and Ridge regularization, balancing between shrinking and sparsity.
Explain the concept of Maximum Likelihood Estimation in the context of fitting a logistic regression model.
A method used to estimate the parameters of a logistic regression model by maximizing the likelihood function. In this context, it finds the coefficients that make the observed outcomes most probable, effectively adjusting the model to best fit the training data.
Describe what is meant by decision boundaries in logistic regression and how they are influenced by the model coefficients.
Decision boundaries in logistic regression are the thresholds that separate different classes based on the predicted probabilities. They are influenced by the model coefficients, where a linear combination of the input features and their corresponding weights determines the boundary's position, indicating the point at which the predicted probability changes from one class to another.
What is a decision tree, and how is it used in data classification tasks?
Decision Tree is a simple yet powerful supervised learning algorithm used for classification tasks.
Describe the components of a decision tree, including internal nodes, branches, and leaf nodes.
It is structured like a tree, where: Each branch node represents a decision or test based on feature values.
Each leaf node represents the final decision or classification.
Internal nodes (also called test nodes) have outgoing edges representing different options.
Leaf nodes (also called terminal nodes) represent the final outcome or classification
Explain the steps involved in building a decision tree.
Select the Best Root Attribute: Test all attributes and choose the one that provides the best split to serve as the root node.
Split the Dataset: Divide the training set into subsets based on the root node's branches (according to attribute values).
Test Remaining Attributes:
For each branch, test the remaining attributes to find the best fit for the next decision node (subsequent splits).
Repeat the Process:
Continue this process recursively for each branch until all branches lead to a final classification (leaf nodes).
Define entropy in the context of decision trees.
Definition of Entropy:
Entropy measures the homogeneity or uncertainty within a dataset.
A completely homogeneous dataset (all samples belong to one class) has an entropy of 0.
A dataset that is equally divided among classes has an entropy of 1.
Formula: Entropy(S) = −(i=1∑n) p(i) log2 p(i)
S = the dataset or sample
p(i) = the proportion of elements in class i within the dataset S
n = the total number of classes
(i=1∑n) = summation over all the classes in the dataset
Explain how entropy influence the construction of the tree.
Entropy measures the impurity or uncertainty of a node in the tree. Impurity reflects the level of randomness in the data at a node.
A pure split occurs when the data is perfectly classified into one outcome (either all "yes" or all "no").
Define information gain in the context of decision trees.
Definition: Information gain measures the reduction in uncertainty (entropy) after splitting a dataset on a particular attribute. It helps decide which attribute should be selected as a decision node or root node in a decision tree.
How it Works: Information gain is calculated as the entropy of the full dataset minus the entropy of the dataset after splitting on a specific attribute.
Formula: Gain(S, A) = Entropy(S) − ∑(|Sv|/|S|) * Entropy(Sv)
Sv = subset of S for which attribute A has value v.
|Sv| = number of elements in subset S_v.
|S| = number of elements in the full dataset S.
What is the Gini index?
Definition: A measure of impurity or purity used to evaluate splits in decision trees.
Goal: Lower Gini index values indicate a purer node, meaning the node is dominated by samples from a single class.
Formula:
Gini Index = 1 - ∑j * p^2j
where pj is the probability of a sample belonging to class j.
The Gini Index ranges between 0 (perfect purity) and 1 (maximum impurity).
How is the Gini Index used in building decision trees?
Select the Best Feature:
Use Attribute Selection Measures (ASM), such as Information Gain or Gini Index, to identify the most informative feature for splitting the records
Describe the ID3 algorithm.
Purpose: Generates a decision tree from a given dataset using a top-down, greedy approach.
Method:
At each node, it tests each attribute to determine the best split.
The algorithm selects the attribute that maximizes information gain (or minimizes entropy). Outcome: The resulting tree is used to classify future data samples.
ID3 role in decision tree construction.
Calculate Entropy: Compute the entropy of each attribute in the dataset to measure the uncertainty in class distribution.
Split the Data: Split the dataset into subsets using the attribute that results in the lowest entropy (or, equivalently, the highest information gain).
Create a Node: Create a decision tree node based on the attribute with the highest information gain.
Recursive Process: Repeat the process for each subset, using the remaining attributes until no further splits are possible.
How are attributes selected for splitting at each node in a decision tree?
The key to building a decision tree is selecting the best attribute from the list of features in the dataset for both the root and sub-nodes.
This process is guided by a technique known as Attribute Selection Measure (ASM).
ASM helps determine which attribute should be chosen at each node to split the data for better classification.
There are two common techniques used in ASM:
Information Gain: Measures the reduction in entropy (uncertainty) after splitting the dataset based on an attribute.
Gini Index: Measures the impurity of a dataset, aiming to minimize class mix after each split.
Discuss the techniques used to prevent overfitting in decision trees.
Techniques to handle overfitting include pruning (removing branches), limiting the tree depth, setting a minimum number of samples per leaf, and using cross-validation.
Pre-pruning (Early Stopping)
The tree stops growing early by avoiding splits that are not statistically significant.
Nodes can be pruned during tree construction if the split doesn't improve the model much, preventing overfitting while growing the tree.
Post-pruning (Tree Pruning)
The tree is first allowed to grow to its maximum depth.
Afterward, pruning is applied to remove nodes that add little to no predictive value, simplifying the tree and improving generalization.
List and explain the advantages of using decision trees.
Easy to Understand:
The decision tree's output is intuitive and easy to understand, even for individuals with nonanalytical backgrounds.
It doesn't require deep statistical knowledge to interpret the results.
The graphical representation of a decision tree makes it easy to visualize relationships and verify hypotheses.
Useful for Data Exploration: Decision trees help quickly identify the most significant variables and understand relationships between them. They can assist in creating new features that have stronger predictive power for the target variable.
Minimal Data Cleaning:
Decision trees require less data preprocessing compared to many other models.
List and explain the limitations of using decision trees.
Overfitting: Overfitting is a common issue with decision trees, especially when the tree is allowed to grow too deep, capturing noise in the training data. This problem can be mitigated by applying constraints such as limiting the tree's depth or pruning to remove branches that have little predictive power.
Not Ideal for Continuous Variables: Decision trees can struggle with continuous numerical variables, as they split them into discrete intervals, potentially leading to a loss of information.
This can make decision trees less effective compared to algorithms that handle continuous variables more smoothly (e.g., linear regression).
Compare and contrast decision trees with Random Forests.
Decision Trees: Make predictions by splitting the data on individual features in sequence, often prone to overfitting.
Random Forest: Combines the predictions of multiple decision trees. Each tree votes on the final prediction, and the most frequent vote (for classification) or the average prediction (for regression) is taken as the output
How Random Forests Work?
A Random Forest consists of many decision trees. Each tree in the forest is trained on a random subset of the data (using bootstrap sampling) and a random subset of features at each split.
What is Random Forest?
Random Forest is a versatile machine learning method capable of handling both regression and classification tasks. It is an ensemble learning method that combines multiple decision trees (often referred to as "weak learners") to create a stronger model.
Random forests are highly effective at handling issues such as dimensionality reduction, missing values, and outliers.
Key Features: Performs well on complex datasets with a large number of features and data points.
Robust to overfitting due to the averaging of multiple decision trees.
Works well even when the data has missing or noisy values.
How do decision trees handle missing values during the training process?
Decision trees handle missing values by either assigning the most frequent value of the feature (for categorical data) or the mean/median value (for numerical data) to the missing entries.
Provide examples of real-world applications where decision trees are effectively used.
Customer segmentation in marketing to identify distinct groups of customers based on purchasing behavior.
Medical diagnosis to assist doctors in diagnosing diseases by analyzing patient symptoms and medical history.
Credit risk assessment in banking to determine the likelihood of a borrower defaulting on a loan.
Fraud detection to identify patterns associated with fraudulent transactions.
How does a decision tree algorithm handle continuous and categorical variables differently?
Not Ideal for Continuous Variables: Decision trees can struggle with continuous numerical variables, as they split them into discrete intervals, potentially leading to a loss of information.
This can make decision trees less effective compared to algorithms that handle continuous variables more smoothly (e.g., linear regression).
A decision tree handles continuous variables by determining split points (thresholds) that divide the data into two or more groups based on values greater than or less than the threshold. For categorical variables, it creates splits by grouping distinct categories, separating them into different branches.
What methods are used to evaluate the performance of a decision tree?
The performance of a decision tree is commonly evaluated using methods like accuracy, precision, recall, and F1 score for classification tasks, and mean squared error (MSE) or mean absolute error (MAE) for regression tasks. Additionally, a confusion matrix can be used for classification, and cross-validation helps assess model generalization.
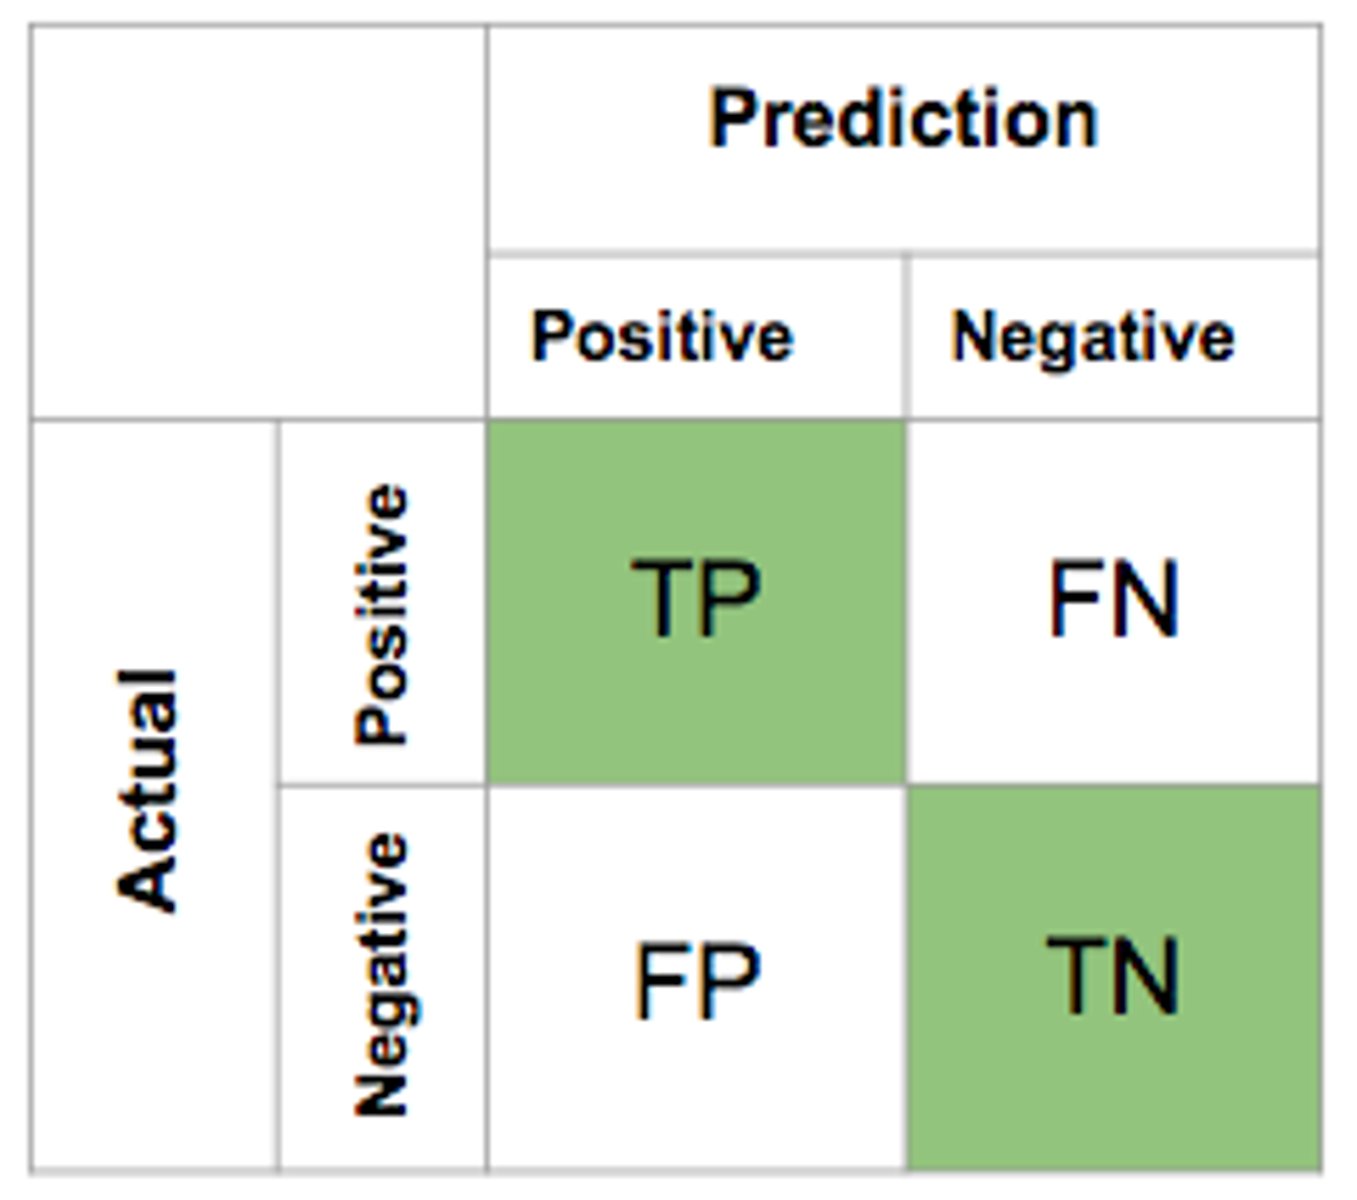
Confusion metrics
Accuracy = (TP + TN/ P + N)
Precision = (TP / TP + FP)
Recall = (TP/ TP + FN)
What is Naive Bayes and why is it referred to as "naive"?
Naive Bayes is a classification algorithm based on probability.
It's called "Naive" because it makes a simplifying assumption that all features are independent of each other.
Why use Naive Bayes?
Fast and easy to implement.
Works well for large datasets and high-dimensional data (many features).
Effective for text classification tasks like spam detection, sentiment analysis, and document classification.
Describe some real-world applications of Naive Bayes.
Email Spam Detection: Predicts whether an email is spam or not based on the words in the email.
Sentiment Analysis: Classifies movie or product reviews as "positive" or "negative" based on the words used.
Medical Diagnosis: Classifies whether a patient has a disease based on various symptoms.
Text Classification: Automatically categorizes documents into topics (e.g., news articles, emails).
Explain the probabilistic foundation of the Naive Bayes classifier.
The Naive Bayes classifier uses Bayes' Theorem and assumes that features are conditionally independent, making predictions based on the combined likelihood of each feature.
Xi ∈ X and Y are treated as random variables
State Bayes' Theorem and explain each term in the theorem.
Allows to calculate conditional probabilities for one variable when conditional probabilities for another variable are known:
𝑃(𝑋 | 𝑌) = (𝑃(𝑌 | 𝑋) * 𝑃(𝑋) / 𝑃(𝑌)).
Why is the assumption of conditional independence critical in Naive Bayes?
Conditional Independence: In Naive Bayes, features are assumed to be independent of each other, given the class.
Why It's Important: This assumption simplifies the problem by allowing us to multiply individual probabilities instead of calculating a joint probability for all features.
How are features represented in a Naive Bayes classifier?
In a Naive Bayes classifier, features are represented as independent variables, either categorical or continuous, depending on the type of Naive Bayes model.
Describe how predictions are made using Naive Bayes.
Naive Bayes makes predictions by calculating the posterior probability for each class using Bayes' Theorem and selecting the class with the highest probability based on the input features.
What are the steps involved in training a Naive Bayes classifier?
Training Phase, Prediction Phase, Testing Phase
Training Phase
Estimate the prior probabilities for each class from the training data.
P(Y = y)
Estimate the conditional probabilities for each feature and each class label.
P(xi | Y = y)
For continuous features, we often assume the features follow a normal distribution, and we estimate the mean and variance from the training data.
For categorical features, we estimate the probabilities as the frequency of each feature value in the training data.
Prediction Phase
For a new instance with features, compute the posterior probability for each class.
Select the class that maximizes this posterior probability
What is the zero frequency problem in Naive Bayes?
Zero Frequency Problem: If a categorical variable in the test dataset contains a category that was not observed in the training dataset, the Naive Bayes classifier assigns a zero probability to that category.
This means the model will be unable to make a prediction because any multiplication involving zero will result in zero.
How is the zero frequency problem in Naive Bayes addressed?
Smoothing Techniques
What Causes Zero Frequency?
This happens when the training data is not comprehensive enough and misses certain categories or feature combinations.
For example, in text classification, if a certain word appears in the test data but was not present in the training data, the model will assign it a zero probability
Smoothing
A technique used to handle zero frequency by adding a small value to the count of each feature/category combination.
Explain Laplace smoothing and its importance in Naive Bayes.
Laplace Estimation (Additive Smoothing):
One of the simplest and most commonly used smoothing techniques.
It adds 1 to the count of each feature/category occurrence in the training dataset to avoid zero probabilities.
The formula for Laplace Smoothing:
P(Xi | C) = (count(Xi in C) + 1/ count(C) + K)
Xi is a feature
C is a class
k is the total number of features
Gaussian Naive Bayes.
Assumption: The Gaussian Naive Bayes model assumes that the features follow a normal (Gaussian) distribution.
Use Case:
It is typically used when the input features are continuous.
Explanation:
If the predictors take continuous values, the model assumes that these values are drawn from a Gaussian distribution (i.e., the values form a bell curve).
This is in contrast to other Naive Bayes models that handle discrete features.
Multinomial Naive Bayes.
Assumption: The Multinomial Naive Bayes classifier assumes that the data follows a multinomial distribution, which is suitable for discrete count data.
Use Case:
It is commonly used in document classification problems, where the task is to categorize documents into predefined categories such as Sports, Politics, Education, etc.
Explanation:
The model works by using the frequency of words (or features) in a document to predict its category.
Each word in the document is treated as a predictor, and its count (or occurrence) is used to calculate the likelihood of the document belonging to a particular category.
Bernoulli Naive Bayes.
Assumption: The Bernoulli Naive Bayes classifier assumes that the features are binary (Boolean), meaning each predictor represents whether a specific attribute or word is present or absent.
Use Case:
It is particularly useful for document classification tasks where the presence or absence of a word (rather than its frequency) is used to predict the category.
Explanation:
For example, instead of counting how many times a word appears in a document, the Bernoulli classifier checks whether the word is present or not (1 or 0).
It is especially effective in tasks like text classification with binary features, such as spam detection, where the existence of certain keywords is more important than their frequency
Discuss the advantages of using the Naive Bayes classifier.
Fast and Efficient:
Naive Bayes is quick and easy to use for classification tasks.
It performs exceptionally well in multi-class prediction problems due to its simplicity.
Performs Well with Limited Data:
When the independence assumption holds, Naive Bayes can outperform more complex models like logistic regression, especially when the training dataset is relatively small.
Effective with Categorical Data:
Naive Bayes tends to perform better with categorical input variables compared to numerical ones, as it does not rely heavily on numerical distribution assumptions.
Handles High-Dimensional Data:
It can efficiently handle high-dimensional datasets, making it ideal for tasks like text classification (e.g., spam detection)
What are the limitations of the Naive Bayes classifier?
Assumption of Independent Predictors:
A key limitation is the assumption of independence between predictors.
In real-world scenarios, it's rare for features to be completely independent, which can reduce the model's accuracy when this assumption is violated.
Zero Frequency Problem: If a categorical variable in the test dataset contains a category not present in the training dataset, the model assigns a zero probability to this event and fails to make a prediction.
This is known as the Zero Frequency problem.
To address this issue, smoothing techniques like Laplace Smoothing (or Additive Smoothing) can be used.
Sensitivity to Numerical Assumptions:
For numerical data, Naive Bayes often assumes that the features follow a normal distribution. When the data deviates from this assumption, the model's performance can suffer.
What numerical assumptions does Naive Bayes make for handling continuous data?
Naive Bayes assumes that continuous data follows a Gaussian (normal) distribution, using the mean and variance of the data to calculate probabilities for each feature.
How does Naive Bayes compare to other classifiers like logistic regression or decision trees?
Naive Bayes is faster and works well with high-dimensional data but assumes feature independence, which may not hold in practice. Logistic regression and decision trees are more flexible but may require more computational resources and can better capture feature interactions.
What is a perceptron and what type of learning problems is it used for?
The perceptron is one of the simplest machine learning algorithms, used for binary classification.
What does it do?
It helps classify data into one of two categories by finding a decision boundary (a line) that separates the two classes.
Key Points:
Works well when data can be separated by a straight line (linearly separable). Lays the foundation for understanding more complex algorithms like neural networks.
What is a linear separator and why is it significant in the context of perceptrons?
A line (in 2D) or a hyperplane (in higher dimensions) that divides data into two classes.
Why is it important?
Many machine learning problems involve classifying data, and in some cases, a straight line can effectively separate different groups of data.
Perceptron tries to find the best possible line to make these classifications.
Key Takeaway:
If the data can be separated by a line, perceptron is an effective and simple method.
Explain how a perceptron processes input features to make a binary classification.
Step-by-step process: Each input feature is given a weight.
These inputs are multiplied by their weights and summed up (dot product). If the sum is greater than a threshold, the output is one class (e.g., 1), otherwise, it's another class (e.g., 0).
Key Components:
Inputs (Features): The data you're using to make a decision.
Weights: These help determine the importance of each input.
Activation Function: Decides which class the input belongs to (often just a simple threshold).
Describe the learning rule of a perceptron and how it updates its weights.
Perceptron adjusts its weights based on the errors it makes.
If the prediction is wrong, the weights are updated to correct for this mistake.
Over time, these updates help the perceptron find the best decision boundary
What is an online learning model and how does a perceptron utilize this approach?
How it works:
Unlike some models, which wait until they see all the data before learning (batch learning), online learning models update their knowledge immediately as each data point arrives.
Imagine learning a new word: instead of learning it at the end of a language course, you learn it the moment you hear it.
Why is it useful?
Efficient for streaming data or large datasets where we can't afford to wait until all the data is available.
Useful when data arrives continuously over time, like in real-time applications (e.g., stock prices, weather updates)
What is the mistake bound model and how does it relate to the perceptron's learning process?
What's the goal?
The primary goal is to minimize the number of mistakes the model makes over time.
What's the challenge?
The model doesn't assume the data follows a specific pattern or distribution.
Key Point:
Unlike traditional models that wait for all data, online learning focuses on reducing errors as quickly as possible while continuously learning.
How does the perceptron update its decision boundary when it makes a mistake?
Perceptron and Mistake Bound:
The perceptron is a classic example of an online learning algorithm that can be analyzed using the Mistake Bound model.
In simple terms, for linearly separable data (data that can be separated by a straight line), the perceptron algorithm will make a limited number of mistakes before it converges to the correct solution.
Bound on the Number of Mistakes:
For linearly separable data, the number of mistakes the perceptron makes is bounded. This means that there is a limit to how many mistakes it will make before it learns the correct decision boundary.
This mistake bound depends on the margin of separation between the classes (how far apart the classes are) and the size of the input data. If the margin is large, the perceptron will make fewer mistakes.
Define geometric margin in the context of perceptrons and explain its relevance to classification confidence.
The geometric margin tells us how far a point is from the decision boundary.
A larger margin means the point is far from the boundary, which typically indicates a more confident and accurate classification.
A smaller margin means the point is closer to the boundary, making the classification less confident
Discuss how the perceptron algorithm can be applied in a batch setting and its implications.
While the perceptron algorithm is typically used in an online setting (learning from one example at a time), we can also use it in a batch setting.
In the batch setting, we have a set S of labeled examples, and we want to find a linear separator that is consistent with all examples.