AP Macroeconomics: Module 6
1/24
Earn XP
Name | Mastery | Learn | Test | Matching | Spaced | Call with Kai | Chat |
|---|
No analytics yet
Send a link to your students to track their progress
25 Terms
A direct relationship between price and quantity is represented by:
a. the demand curve.
b. the supply curve.
c. the production possibility frontier.
d. equilibrium
e. the utility curve
b. the supply curve.
A decrease in the price of eggs will result in a(n):
a. increase in the demand for eggs.
b. increase in the supply of eggs.
c. decrease in the supply of eggs.
d. decrease in the quantity of eggs supplied (leftward movement along the supply curve of eggs).
e. decrease in the demand for eggs.
d. decrease in the quantity of eggs supplied (leftward movement along the supply curve of eggs).
When the price of lamps increases, the:
a. supply increases.
b. quantity supplied increases.
c. supply decreases.
d. quantity supplied decreases.
e. quantity demanded increases.
b. quantity supplied increases.
The typical supply curve illustrates that:
a. other things equal, the quantity supplied of a good is inversely related to the price of a good.
b. other things equal, the supply of the good creates its own demand for the good.
c. other things equal, the quantity supplied of a good is positively related to the price of a good.
d. price and quantity supplied are unrelated as the supply curve is vertical.
e. other things equal, the supply curve is horizontal.
c. other things equal, the quantity supplied of a good is positively related to the price of a good.
Consider the supply curve for cotton shirts. An increase in the price of cotton will:
a. increase the supply of cotton shirts.
b. decrease the supply of cotton shirts.
c. not shift the supply of cotton shirts.
d. decrease the demand for cotton shirts.
e. increase the quantity supplied of cotton shirts.
b. decrease the supply of cotton shirts.
A technological advance in the production of automobiles will:
a. increase the demand for automobiles.
b. increase the supply of automobiles.
c. decrease the demand for automobiles.
d. decrease the supply of automobiles.
e. have no effect on the demand or supply of automobiles.
b. increase the supply of automobiles.
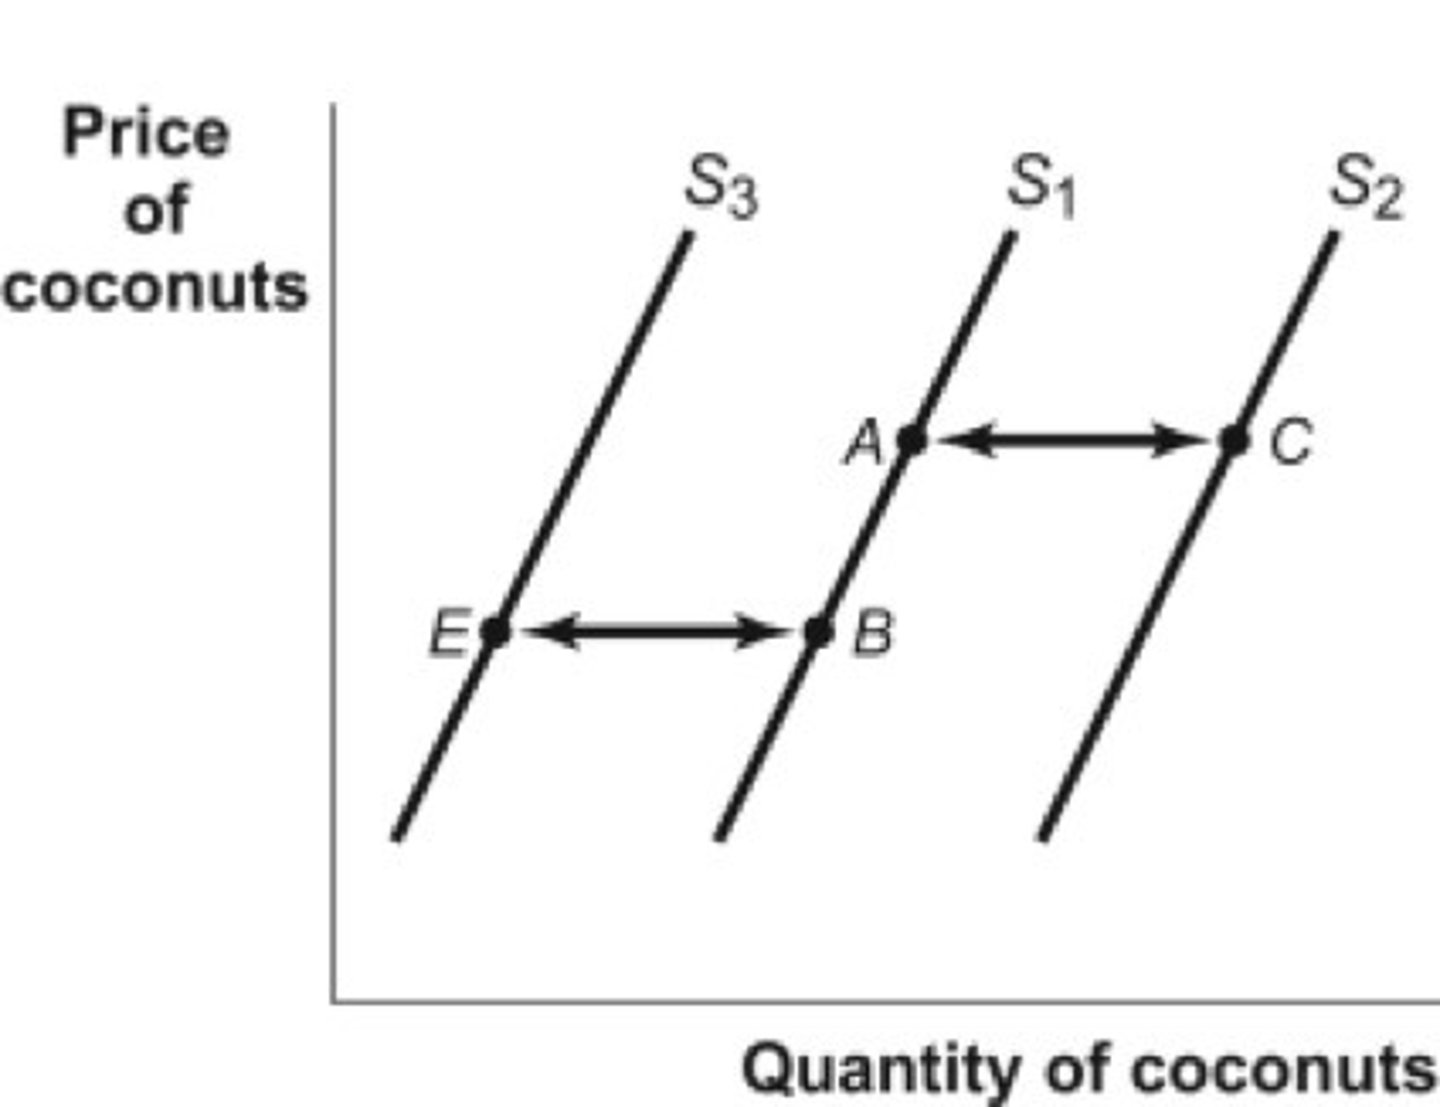
If the price of coconuts decreases, then the movement that would take place in the model could be:
a. A to C.
b. B to A.
c. C to A.
d. E to B.
e. A to B.
e. A to B.
Using the graph from question 7, if the prices of inputs (e.g., labor, fertilizer, and fuel) used to produce and transport coconuts are increasing, then the movement in the model could be:
a. A to B.
b. B to A.
c. C to A.
d. E to B.
e. B to C.
c. C to A.
Using the graph from question 7, if the prices of inputs (e.g., labor, fertilizer, and fuel) used to produce and transport coconuts are decreasing, then the movement in the model could be:
a. A to B.
b. B to A.
c. C to A.
d. E to B.
e. B to E.
d. E to B.
Using the graph in question 7, if there is an improvement in the technology used to harvest coconuts (e.g., a faster, less expensive coconut picker), then the movement in the model could be:
a. A to C.
b. B to A.
c. C to A.
d. B to E.
e. A to B.
a. A to C.
Using the graph from question 7, if there is an expectation on the part of coconut suppliers that the price of coconuts will be significantly higher in the very near future, then the movement in the model to reflect today's market behavior would be:
a. A to B.
b. B to A.
c. A to C.
d. B to E.
e. E to B.
d. B to E.
A decrease in supply means:
a. a shift to the left of the entire supply curve.
b. moving downward (to the left) along the supply curve with lower prices.
c. less will be demanded at every price.
d. more will be supplied at every price.
e. a shift to the left of the entire demand curve.
a. a shift to the left of the entire supply curve.
An increase in supply of a good is caused by:
a. resource prices rising.
b. a decrease in the price of the good.
c. an increase in the price of the good.
d. expectations of future price increases.
e. an increase in the number of sellers.
e. an increase in the number of sellers.
An increase in supply of a good is caused by:
a. an increase in input prices.
b. suppliers' expectations of higher future prices for the good.
c. an increase in the price of the good.
d. a decrease in prices of goods that are substitutes in production.
e. a decrease in the number of firms producing the good.
d. a decrease in prices of goods that are substitutes in production.
If the price of mozzarella cheese (an ingredient in pizza) declines due to a major technological breakthrough in the dairy industry, there would be:
a. a decrease in the supply of pizza.
b. an increase in the supply of pizza.
c. a decrease in the quantity of pizza supplied.
d. no change in the supply of pizza.
e. a decrease in the demand for pizza.
b. an increase in the supply of pizza.
An increase in supply of a good is caused by:
a. an increase in resource prices.
b. a decrease in the number of sellers in the market for the good.
c. suppliers' expectations of higher future prices for the good.
d. an advancement in the technology for producing the good.
e. a decrease in the number of producers of the good.
d. an advancement in the technology for producing the good.
A decrease in supply of a good is caused by:
a. a decrease in resource prices.
b. an increase in the number of sellers in the market for the good.
c. suppliers' expectations of higher future prices for the good.
d. an advancement in the technology for producing the good.
e. the removal of a tax that had previously been levied on each unit of the good produced.
c. suppliers' expectations of higher future prices for the good.
A shift to the left of a supply curve is caused by:
a. an increase in the number of sellers.
b. a technological improvement.
c. an increase in the cost of an input.
d. an increase in the number of buyers.
e. a decrease in consumer income if the product is a normal good.
c. an increase in the cost of an input.
When the price of corn is rising, we would expect:
a. the quantity demanded for corn to be rising.
b. the quantity supplied of corn to be rising.
c. the demand for corn to be shifting inward.
d. the supply of corn to be shifting outward.
e. the supply of corn to be shifting inward.
b. the quantity supplied of corn to be rising.
Which of the following is most likely to shift the supply of milk to the right?
a. a tax on each gallon of milk produced
b. an increase in household income and milk is a normal good
c. removal of milk subsidies that had previously been given to dairy farmers
d. the bankruptcy of many small dairy farms
e. a decrease in the price of feed given to dairy cows
e. a decrease in the price of feed given to dairy cows
Milk is an important ingredient in the production of ice cream. If the price of milk increases, then one would expect, holding all other things constant:
a. the supply curve for ice cream to shift left.
b. the supply curve for ice cream to shift right.
c. no change in the supply curve for ice cream.
d. a movement along the supply curve for ice cream curve, resulting in more ice cream supplied.
e. the demand curve for ice cream to shift to the left.
a. the supply curve for ice cream to shift left.
A farmer finds that when he produces more corn, he also has more corn stalks that he can then sell as decorative ornaments. To the farmer, corn and corn stalks are:
a. complements in production.
b. substitutes in production.
c. unrelated goods in production.
d. inferior goods in production.
e. luxury goods in production.
a. complements in production.
Researchers find a new strain of genetically modified seeds results in a higher yield for corn producers. Holding all other things constant, this research will:
a. shift the supply curve for corn left.
b. increase the quantity supplied of corn along the fixed supply curve.
c. decrease the quantity supplied of corn along the fixed supply curve.
d. shift the supply curve for corn to the right.
e. shift the demand curve for corn to the right.
d. shift the supply curve for corn to the right.
Producers of strawberries have seen a rightward shift of the supply curve for strawberries. Which of the following choices likely explains this rightward shift?
a. The price of labor used in harvesting strawberries has increased.
b. Technology has improved in the harvesting of strawberries.
c. The price of fertilizer used in growing strawberries has increased.
d. The number of strawberry sellers has decreased.
e. Strawberry growers expect lower market prices in the near future.
b. Technology has improved in the harvesting of strawberries.
Which of the following best describes the typical upward sloping shape of supply curves?
a. As the price of corn ethanol rises, farmers plant more acres of soybeans.
b. As the technology used in producing video games increases, more video games are produced.
c. As the tax subsidy on health insurance for families increases, more families can afford to purchase health insurance.
d. As the price of cattle falls, ranchers are less willing to sell their cattle at livestock auctions.
e. As taxes on cigarettes rise, more cigarette smokers decide to quit smoking.
d. As the price of cattle falls, ranchers are less willing to sell their cattle at livestock auctions.