Module 9
1/3
There's no tags or description
Looks like no tags are added yet.
Name | Mastery | Learn | Test | Matching | Spaced | Call with Kai |
|---|
No analytics yet
Send a link to your students to track their progress
4 Terms

A. What does the Phillips Curve Represent
A. The Phillips Curve represents the relationship between unemployment and price inflation. According to the Phillips Curve, unemployment and inflation have an inverse (or negative) relationship. A situation that yields the Phillips Curve relationship would be when, during a recession, the level of output is below potential GDP, unemployment is high, and inflation is low.
The unemployment rate is on the X axis, and the inflation rate is on the Y axis.
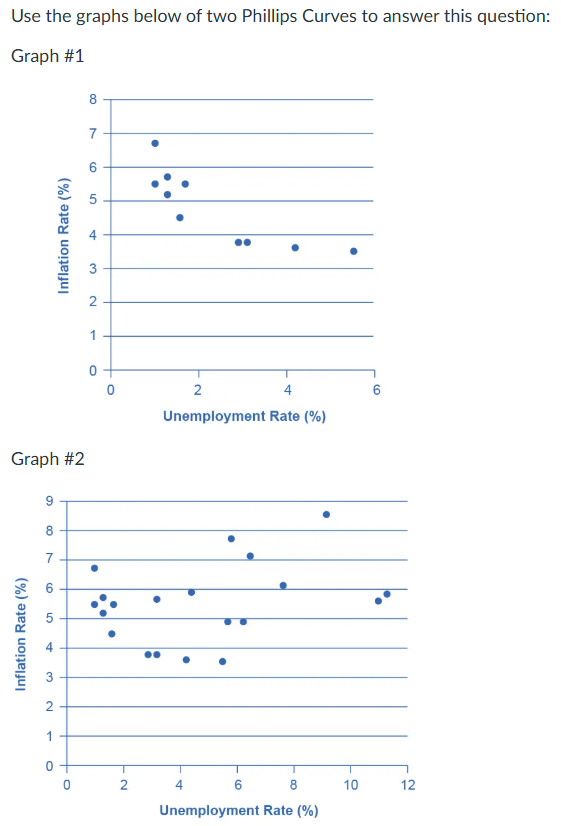
B. Explain why graph #2 is different from graph #1. Include the causes and solution in your answer.
B. The first graph shows a downward-sloping short-run Phillips Curve, while the second shows a flattened Phillips Curve.
The flattened Phillips Curve implies that the dynamic relationship between inflation and employment has changed. There are a few reasons why the Phillips Curve could have flattened. Generally, changes in people's expectations about inflation and supply shocks can cause the Phillips Curve to shift.
In the context of the United States, the Federal Reserve has been actively and mindfully targeting inflation in recent decades to keep inflation low and stable, which may have reduced how sensitive inflation is to changes in labor market performance. Additionally, it's possible that a decrease in price stickiness, caused by firms adjusting prices to current and expected demand conditions, could have caused the Phillips Curve to flatten.
The Phillips Curve could shift back to the inverse relationship between the unemployment and inflation rate if people's expectations about inflation were to change (workers expect no inflation and do not demand higher wages as a response to expected inflation). A stable supply (a decrease or stoppage of supply shocks) could also influence the Phillips Curve to revert to the expected downward slope, as seen in the short-run Phillips Curve.
Module 9 Question 3
Module 9 Question 3 Answer
Module 9 Question 4
Module 9 Question 4 Answer