Final Review (Weeks 9-15)
1/102
There's no tags or description
Looks like no tags are added yet.
Name | Mastery | Learn | Test | Matching | Spaced | Call with Kai |
|---|
No analytics yet
Send a link to your students to track their progress
103 Terms
Climate change
Long-term shifts in temperatures and weather patterns
Evidence that we have to support climate change
Temperature, greenhouse gases, biological and physical changes on earth
What impacts will climate change have on wildlife?
Habitat fragmentation, degradation and loss
Migration disruptions
Food web disruption
Range shifts
Phenology changes
Sex ratio bias
Human-wildlife conflicts
How can animals survive climate changes?
Colonization or adapt to new environment
How do we manage wildlife for climate change?
Establish refugia or safe havens
Optimizing migration pathways
Build evolutionary resilience
Use biodiversity for climate mitigation
Develop green infrastructure
Why do we harvest wildlife?
Commercial activity
Sustenance
Recreation
Management
Sustainable harvest
Population is at self-sustaining level prior to harvesting
# of individuals removed less than or equal to # of recruitments
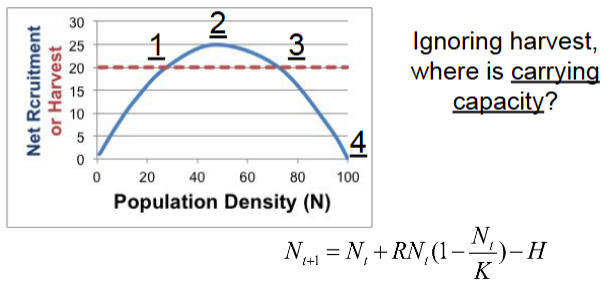
Maximum sustainable yield (MSY)
Highest # of individuals that can be harvested w/o population collapsing and going into extinction
Risky, can lead to unstable population and extinction
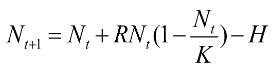
Which part of the equation represents the number of individuals being added to the
population?
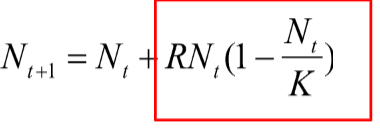
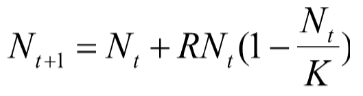
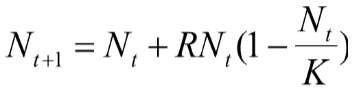
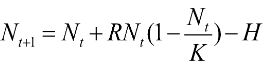
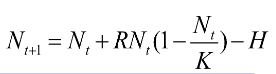
Logistic growth equation
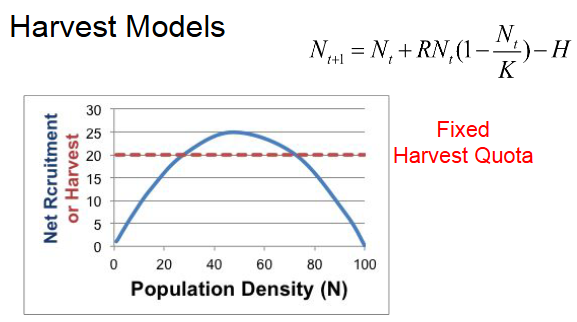
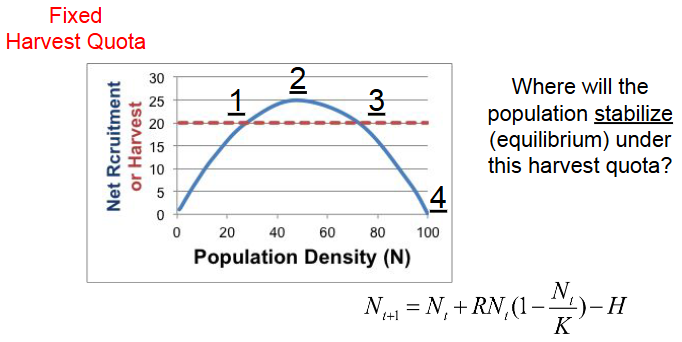
Fixed Harvest Quota
a set number of animals is removed annually, regardless of population changes, aiming for sustainable yield but carrying high risk of overharvesting and collapse if the population declines
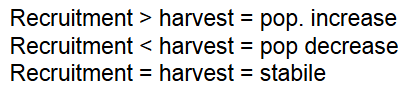
recruitment > harvest= pop. increase
recruitment < harvest= pop. decrease
recruitment = harvest= stable
For now, let’s say 0 individuals are being harvested (H=0). What is recruitment (ΔN) if K=100, R=1.0 and Nt=70, rounded to the nearest integer?
21
If K=100, R=1.0 and N=70, what will happen to the population at the next time step if H=30?
Decreases
If K=100, R=1.0 and N=70, what will happen to the population at the next time step if H=15?
Increases
4
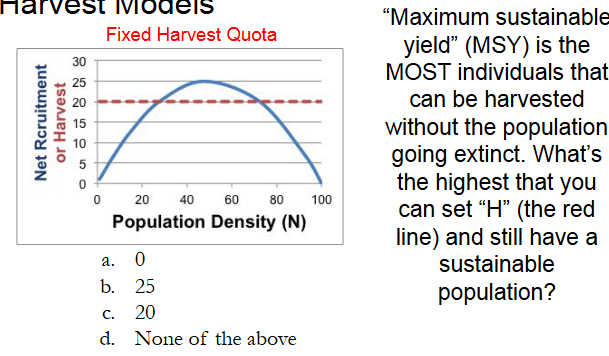
B.) 25
If K=200 and R=0.5, what is maximum sustainable yield?
25

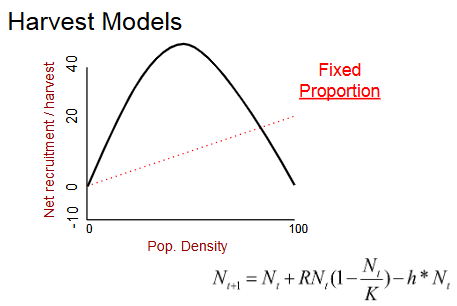
Fixed proportion
“Traditional” Management
Personal experience and traditions
Untested, no formal process
Conservatism, a lack of interest in trying new ideas
Often provides a starting point for experiments
“Experimental” Management
Driven by data and analysis
Tests ideas, new and old
Test and refine, cont.
● Outcome-based objectives
● Most objective
Technical judgement
Testable idea that can be evaluated according to a strict criteria
- Fact-based assessments
-”how many”
Value judgement
Based on ethics and beliefs
“Should”
Hypothesis
A proposed explanation for a phenomenon or observation
Null hypothesis (H0)
A statement that the phenomenon or relationship being tested has no effect, no difference or no association
Alternate hypothesis (Ha)
A statement that proposes a significant effect or difference exists between populations
Steps of scientific process
Observation
Question
Hypothesis
Prediction
Test
Results
Refine or propose new hypothesis
We have observed that Rocky Mountain elk population sizes have
been declining for years. Through aerial photos, we notice their
habitat is becoming more and more fragmented.
What would be your null hypothesis?
The degree of habitat fragmentation has no significant effect on the
elk population size
We have observed that Rocky Mountain elk population sizes have
been declining for years. Through aerial photos, we notice their
habitat is becoming more and more fragmented. What would be your alternative hypothesis?
The degree of habitat fragmentation has a significant effect on elk
population size
6 Steps of testing hypothesis
Pose a research question
2. Convert it to a null hypothesis
3. Collect data that will test the null hypothesis
4. Run the appropriate statistical test
5. Accept or reject the null hypothesis in light of that testing
6. Convert statistical conclusion to a biological conclusion
4 components that make a good experiment
Generalizable - findings can be applied more broadly than the experiment itself
Verifiable - the design and methods can be demonstrated to contain no major flaw
Validatable - results consistent with data not used in the experiment
Replicable - experiment can be repeated and results would be the same (or at least similar)
Predictor variable
Aka independent variable
○ Variables expected to affect the response variable
○ “cause”
Response variable
Aka dependent variable
○ Variables that will be affected by the predictor variable
○ “effect”
Factor
Factors are typically a general type or category of treatment
Levels
Represent the number of variation of the factor
What is the factor and level?: How effective is tree removal at promoting movement of pronghorn? We tested 0%, 50% and 100% removal of trees
Factor: tree removal
Levels: 3 → 0%, 50% and 100%
Fixed factor
Typically if investigator controls the level of the factor, then the factor is fixed
Random factor
If the investigator randomly sampled the levels of a factor from the population then the factor is random
Fixed or random: How effective is tree removal at promoting movement of
pronghorn? We tested 0%, 50% and 100% removal of trees
Fixed
Fixed or random: We measured the movement of the first 10 individuals we found
(out of the 100 that exist in this population).
Random
3 Common mistakes in experimental design
Pseudoreplication- non-independent observation treated independently
Unbalanced design- treatments are not equal in come capacity
Small sample size (low statistical power)
Statistical power
Probability that a test can correctly detect a true effect when one exists
Extinction
A species ceases to exist
Global extinction (total extinction)
a species once existed, but no longer exists anywhere on Earth
Local extinction (extirpation)
a species ceases to exist within a specific geographic area, but still exist elsewhere
Extinct in the wild
a species ceases to exist in its natural habitat but living individuals remain in captivity (typically in a zoo)
Mass extinction
Widespread species extinctions within a relatively short period
of time
○ Leads to rapid decrease in the biodiversity on Earth
○ Typically ~ 70-75% of all species are lost during these
events
Demographic Stochasticity
= random variation in birth, death and reproductive rates
An individual has a certain probability of…
- Surviving
- Breeding
- Dispersing
“Normal” Environmental Stochasticity
= variation in population growth due to the environmental fluctuations
e.g., Kangaroos = grazers in arid Australia
“Extreme” Environmental Stochasticity
Catastrophes
○ Volcanic eruptions
○ Hurricanes
○ Large wildfires
○ Severe drought
Population Viability Analysis (PVA)
Estimates the probability of persistence (or extinction) over a specified time interval
Components of a PVA
Population model
2. Demographic variation
3. Temporal variation
4. Spatial variation
5. Individual variation
6. Genetic variation
7. System stability
Variation
concept of how spread out data points are
Variance
a statistical measure that quantifies the spread of the data
Challenges with PVA
1. Lack of data to account for variation
a.. Ex. insufficient genetic data
b. Ex. poor spatial coverage of data
2. Model is too simplistic
a. Ex. model is static but often the real world is dynamic
3. High uncertainty over time
a. Ex. 100 years may be acceptable to look at but modeling
beyond that is very uncertain
Model
hypothesis that is usually expressed mathematically
Adaptive Management
Learning while doing (update management goals and plans as new information becomes available)
“Decision process that promotes flexible decision making that can be adjusted in the face of uncertainties as outcomes from management actions and other events become better understood.”
Passive Adaptive Management
Make the best possible use
of historical data to
determine the best practice
•Continue monitoring and
collecting new data
Active Adaptive Management
Conduct manipulative
experiments to improve our
understanding of the
managed system
Test different management
strategies and identify
which one is best
Evolution
-Genetic adaptation of organisms to their environments
- Change in the properties of groups of organisms over the
course of generations
- Descent with inherited modification
4 Steps Required for Evolutionary Change
1)Variation
2) Heritability
3) Competition
4) Adaptation
Four mechanisms of evolution
1.Mutation
2. Genetic Drift
3. Gene flow (migration)
4. Natural selection
Fitness
The genetic contribution by an individual’s descendants to future generations of a population relative to those of other individuals
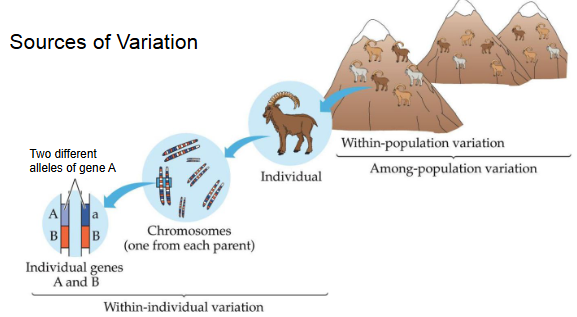
Sources of Variation
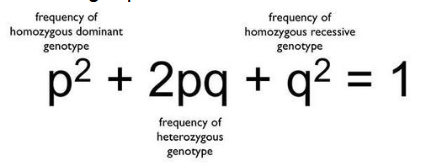
Hardy Weinberg Equation- What is p? What is q?
p= proportion of A allele (dominant) q= proportion of a allele (recessive)
Hardy-Weinberg Equilibrium Assumptions
No mutations (i.e. no new alleles)
No gene flow can occur (i.e. no migration)
Random mating must occur (i.e. individuals must pair by chance)
No genetic drift occurs
No selection can occur
Natural selection
process by which random evolutionary changes are selected for
by nature in a consistent, orderly, non-random way
Artificial selection
an evolutionary process in which humans are consciously selecting for or against a particular trait
Kin selection
selection in favor of behavior by individuals that may decrease their chance of survival but increases that of their kin (who share a proportion of their genes)
Sexual selection
selection arising through preference by one sex for certain characteristics in individuals of the other sex
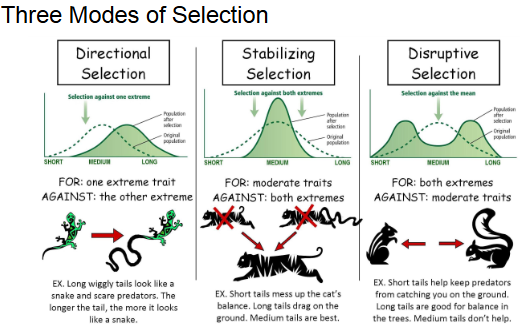
Three modes of selection
Adaptation
Trait or characteristic that improves an organism's ability to survive and reproduce (fitness)
Forms of Adaptations
Behavioral
- Structural
- Physiological
- Molecular
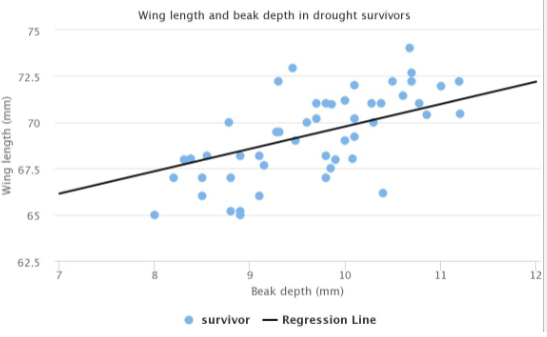
Rapid Evolution
the process of significant genetic change in a population over a relatively short timescale (sometimes a couple generations)
How to promote genetic diversity
1. Gene flow
a. Build corridors between
populations
b. Translocations
c. Captive breeding programs
2. Increase population numbers
a. Effective population size
i. Actual number of
individuals that are
reproducing and
capable of adding to the
gene pool
Productivity
percentage of energy entering the ecosystem that becomes incorporated into
biomass at that trophic level

Following the 10% rule, if our primary producers store 10,500 kcal/m 2/year, how much of that energy will be transferred to the secondary consumer?
105
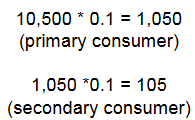
Why is energy lost between trophic levels?
Second Law of
Thermodynamics:
- During transfer of energy,
some energy is always lost
as heat
Bottom up control
Community structure and function is primarily controlled by productivity
and abundance of primary producers
Top down control:
Community structure and function is primarily controlled by productivity and abundance of predators (secondary or above typically)
What type of environmental changes could shift a system
from bottom-up to top-down or vice versa?
Trophic Cascades
- Removal of top predator triggers
a chain reaction that affects
lower trophic levels
- Bottom-up trophic cascades
- Changes to abundance and
structure of primary
producers influences higher
trophic levels.
Bioaccumulation
Increasing concentration of persistent, toxic substances in organisms at each trophic level
Macroecology
Explores the domain where ecology, biogeography, paleobiology, evolution and community ecology come together
Three hypotheses for explaining why there is higher biodiversity at the equator than the poles
Species - energy hypothesis
2. Time and stability
hypothesis
3. Area hypothesis
Bergmann's Rule
Species size increases in the cooler portions of their geographic range
Cope’s Rule
Lineages tend to increase size over geological time periods
The Island Rule
Gigantism: tendency of small species
to evolve towards larger size in islands
Dwarfism: tendency of larger species
to evolve towards smaller size in
islands
Drive extinctions
-Environmental fluctuations
- Catastrophes
Stochastic extinctions
Demographic malfunction
- Small population size
leading to issues
- Genetic malfunction
- Loss of heterozygosity
Conservation Biology
Scientific discipline that draws on diverse fields to carry out research on biodiversity, identify threats to biodiversity, and play an active role in the preservation of biodiversity
Biodiversity
The variety of living organisms considered at all levels of organization, including the
genetic, populations/species, and higher taxonomic levels; and the variety of habitats, ecosystems, and landscapes as well as the processes occurring within
Why is biodiversity important?
1. Intrinsic value
2. Ecosystem function
3. Ecosystem services
S.L.O.S.S. Debate (single large and several small - connected)
Single Large:
1. Species with large ranges
(home and geographic)
2. Species with variable habitat
needs
3. Animals sensitive to edge
effects
4. Animals with inbreeding
Several Small:
1. Species with narrow ranges
and niches (specialists)
2. Species with high disease
transmission (catastrophes)
3. Animals that do well in edge
habitats
4. Smaller organisms
Community
a group of populations of two or more different species in a specific space and/or time
Keystone species
species that have a disproportionately large impact on the ecosystem relative to its abundance
Ecosystem engineers
species that significantly modifies the landscape that other organisms rely on
Ecosystem
Communities exist within a set of abiotic and biotic conditions and these combinations
Landscape ecology
studies how the arrangement (spatial patterns) of habitats, land uses, and ecosystems (the landscape) affects animal movements, populations, biodiversity, and overall ecological processes
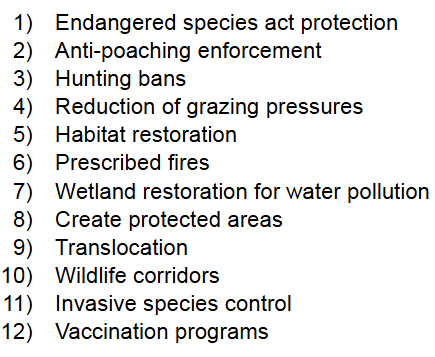
Potential Management Strategies
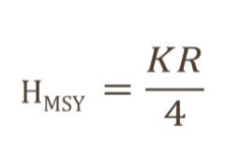
If we have a population with the following parameters, what is our
maximum sustainable yield?
K = 300
R = 0.5
N = 200
37.5