Psychology Statistics
5.0(1)
Studied by 15 peopleCard Sorting
1/41
Earn XP
Description and Tags
Last updated 5:40 PM on 9/15/22
Name | Mastery | Learn | Test | Matching | Spaced | Call with Kai |
|---|
No analytics yet
Send a link to your students to track their progress
42 Terms
1
New cards
statistics
characterizes a sample
2
New cards
parameter
characterizes a population
3
New cards
sample
subset of observations from the population of interest
4
New cards
population
ALL participants
5
New cards
descriptive statistics
help us organize and summarize data
6
New cards
inferential statistics
draw conclusions about populations based on sample data
7
New cards
independent variable
used to describe/explain DV differences or cause the DV changes
8
New cards
dependent variable
outcome of interest in an experiment, what we measure
9
New cards
extraneous variables
variables (not the IV) that impact the DV, interfere with our findings
10
New cards
quantitative
tells about amount or degree of variable
11
New cards
qualitative
tells if things are different or the same but not amount
12
New cards
nominal
categorize people/subjects into groups, groups usually have a title
13
New cards
ordinal
NOT equal intervals
(ex. educational level, place in a contest, standing in graduation class)
(ex. educational level, place in a contest, standing in graduation class)
14
New cards
interval
equal intervals, categorize, rank order
15
New cards
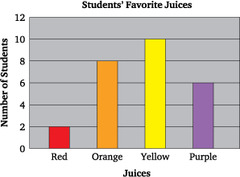
bar graph
set of NONadjoining rectangles whose heights represent frequency values, NOMINAL data
16
New cards
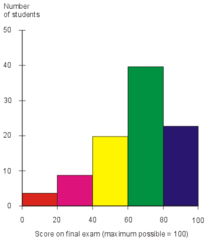
histogram
Set of ADJOINING rectangles whose heights represent the frequency of their values; QUANTITATIVE data
17
New cards
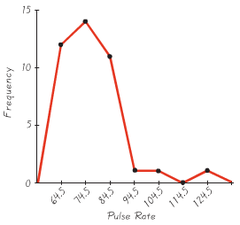
frequency polygon
Series of dots whose heights represent the frequency of values connected by a line; QUANTITATIVE data
18
New cards
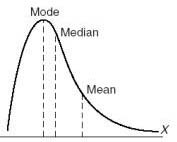
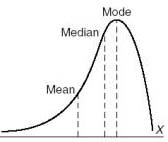
positive skew
mean>median
19
New cards
negative skew
mean
20
New cards
central tendency
single score representing the entire data set and it helps us interpret single scores (ex. mean, mode, range)
21
New cards
variability
a way of summarizing how spread out the scores in a distribution are
22
New cards
mode
most commonly occurring score
23
New cards
median
value that divides a distribution into two equal halves
24
New cards
mean
arithmetic average
25
New cards
μ
mean for a population
26
New cards
x̄
mean for a sample
27
New cards
correlation
quantify the strength and direction of the relationship between two variables
28
New cards
spurious
artificially high or low
29
New cards
empirical
based on actual scores
30
New cards
generalizability
can apply findings from one sample or context to others
31
New cards
random sample
subset of a population chosen so that all samples of size N have an equal opportunity of being selected
32
New cards
correlational studies
participants come with their group membership (ex. # of pets, political affiliation, gender)
33
New cards
Sampling distribution
distribution of sample statistics
34
New cards
Frequency distribution
distribution of individual scores
35
New cards
conceptual hypothesis
general statement about the relationship between the IV and DV or about the magnitude of a relationship
36
New cards
statistical hypothesis
hypothesis written in mathematical notation
37
New cards
null hypothesis
assumes there is no relationship/difference/effect
38
New cards
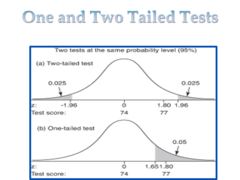
1 tailed test vs 2 tailed test
39
New cards
type I error
rejecting a true null
40
New cards
type II error
retaining a false null
41
New cards
matched pairs
the experimenter made the matches (ex. basketball dunking)
42
New cards
repeated measures
same participants are tested twice