Unit 2 y11 Population and Resource issues in 21st century
1/16
There's no tags or description
Looks like no tags are added yet.
Name | Mastery | Learn | Test | Matching | Spaced | Call with Kai |
|---|
No analytics yet
Send a link to your students to track their progress
17 Terms
Birth rate / fertility rate
number of live births per thousand of population per year.
Infant mortality
number of deaths of children under 1 year of age per 1,000 live births
life expectency
average number of years an individual can be expected to live, given current social, economic, and medical conditions
Death rate
number of deaths each year per 1,000 people
Natural increase rate
percentage growth of a population in a year, computed as the total birth rate minus the total death rate
Demographic transition Model
sequence of demographic changes in which a country moves from high birth and death rates to low birth and death rates through time.
+ It
-
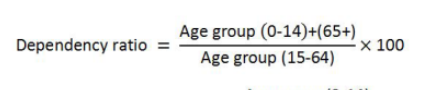
Dependency ratio
number of people under age 15 and over age 64 compared to the number of people active in the labor force (the number of people dependent on the care from the number of people who work and provide care)
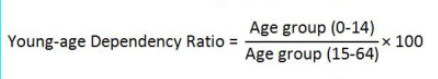
youth dependency ratio
the ratio of the youth population (ages 0-14) per 100 people of working age (ages 15-64). A high youth dependency ratio indicates that a country will be spending more on schooling and other services for children.
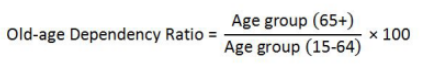
old-age dependency ratio
ratio of the elderly population (ages 65+) per 100 people of working age (ages 15-64). Increases in the elderly dependency ratio put added pressure on governments to fund pensions and healthcare.
population distribution
how people are spread out across an area
sparse vs. dense
few people/lot of crowded people
population density
measurement of the number of people per given unit of land (ex. number of people per square kilometre)
human factor 1
economic:
Dense:
close to ports - Sydney
good roads and railways
human factor 2
physical factor 1
physical factor 2
physical factor 3